ATMC BUS102 Introduction to Economics: Assessment Task 2
VerifiedAdded on 2023/01/23
|6
|825
|31
Homework Assignment
AI Summary
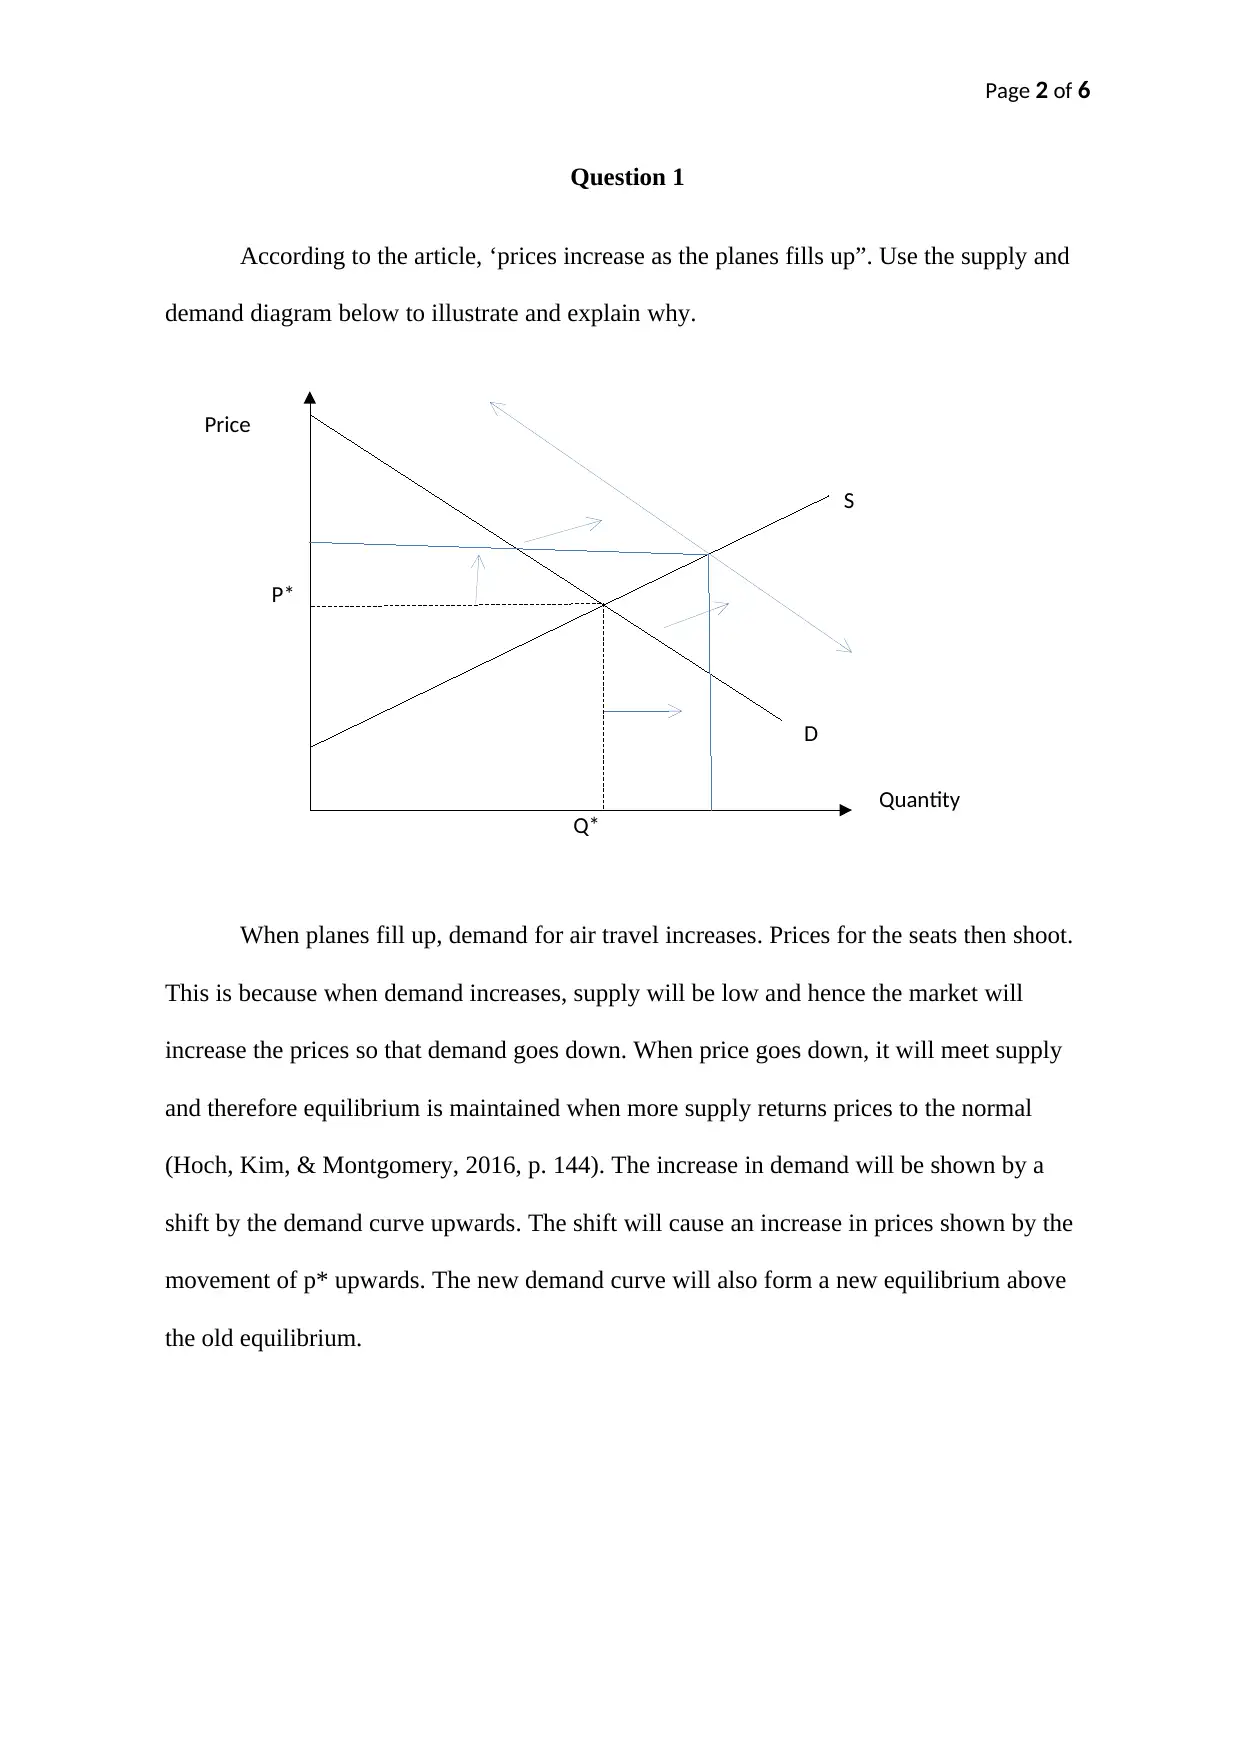
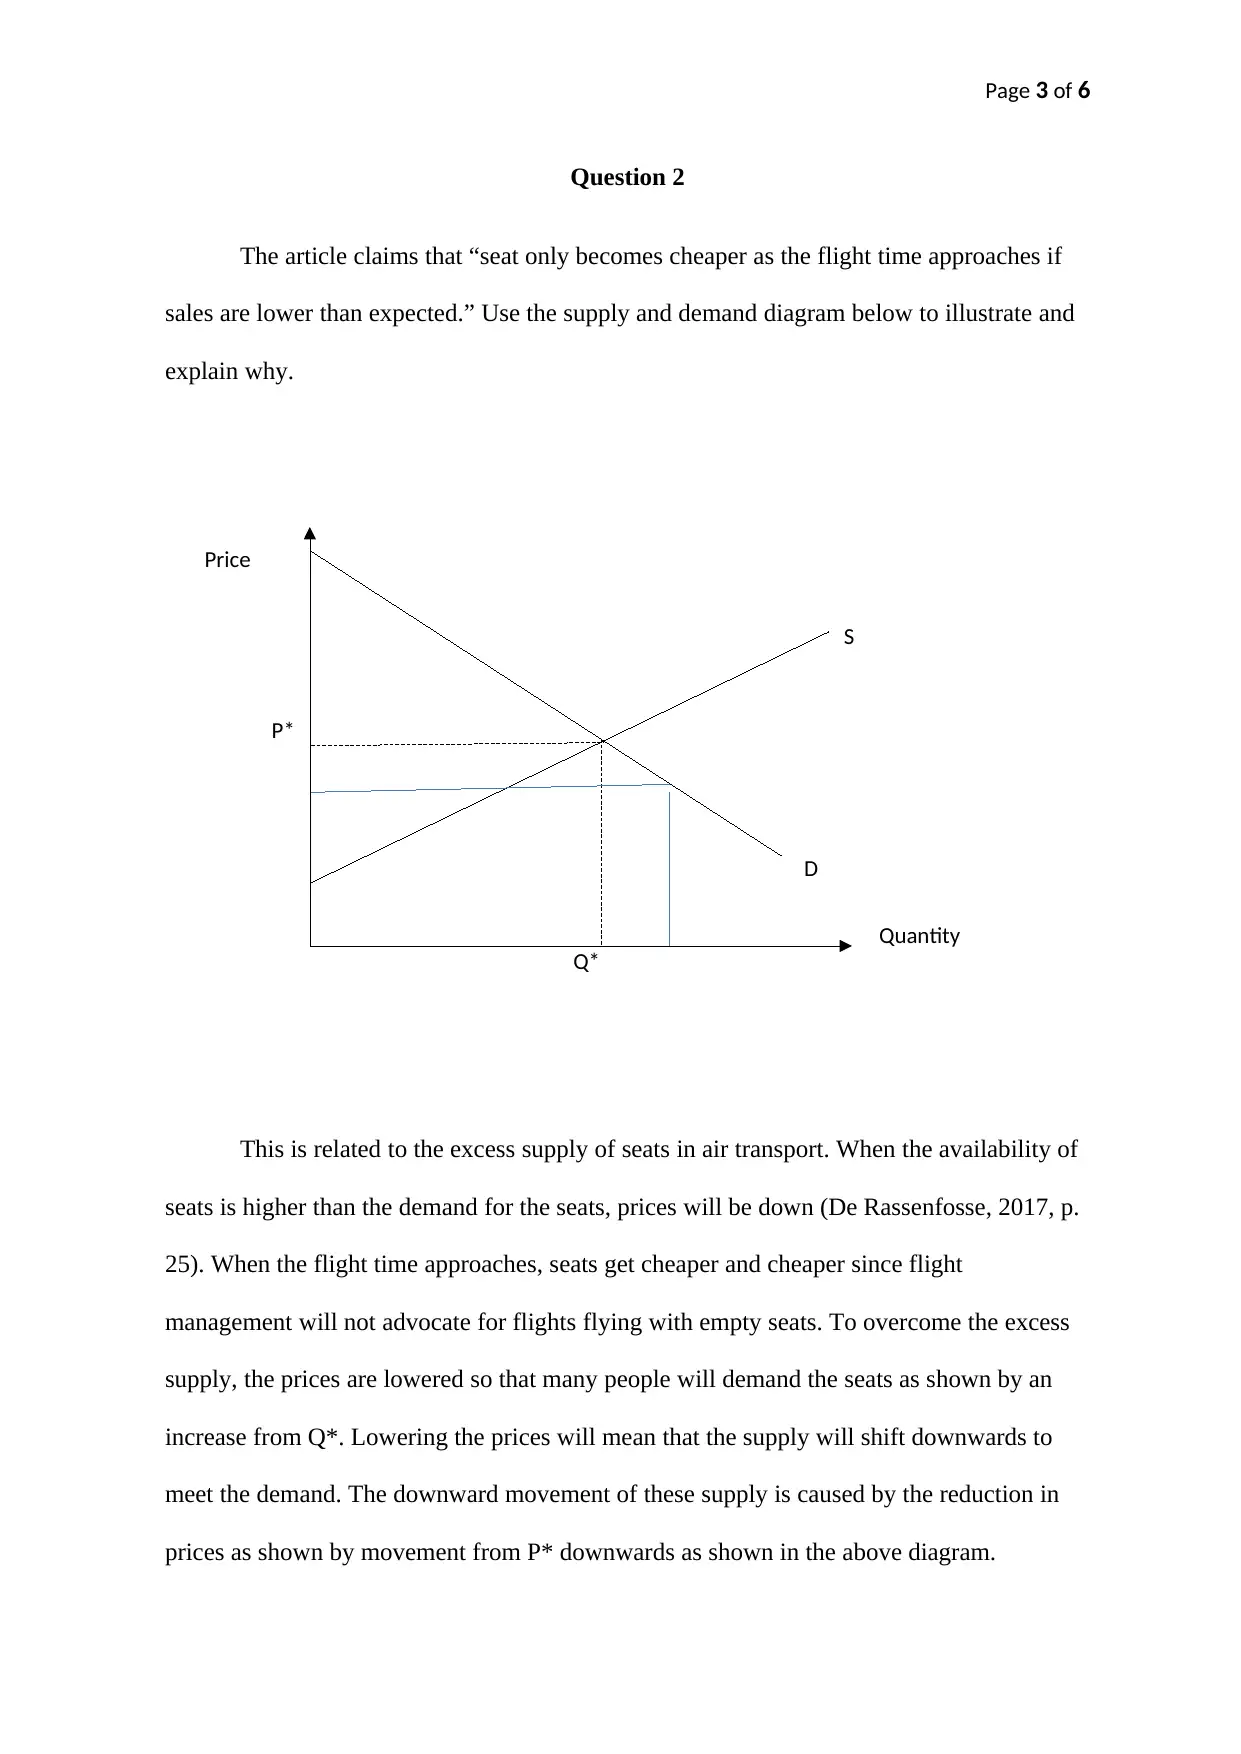
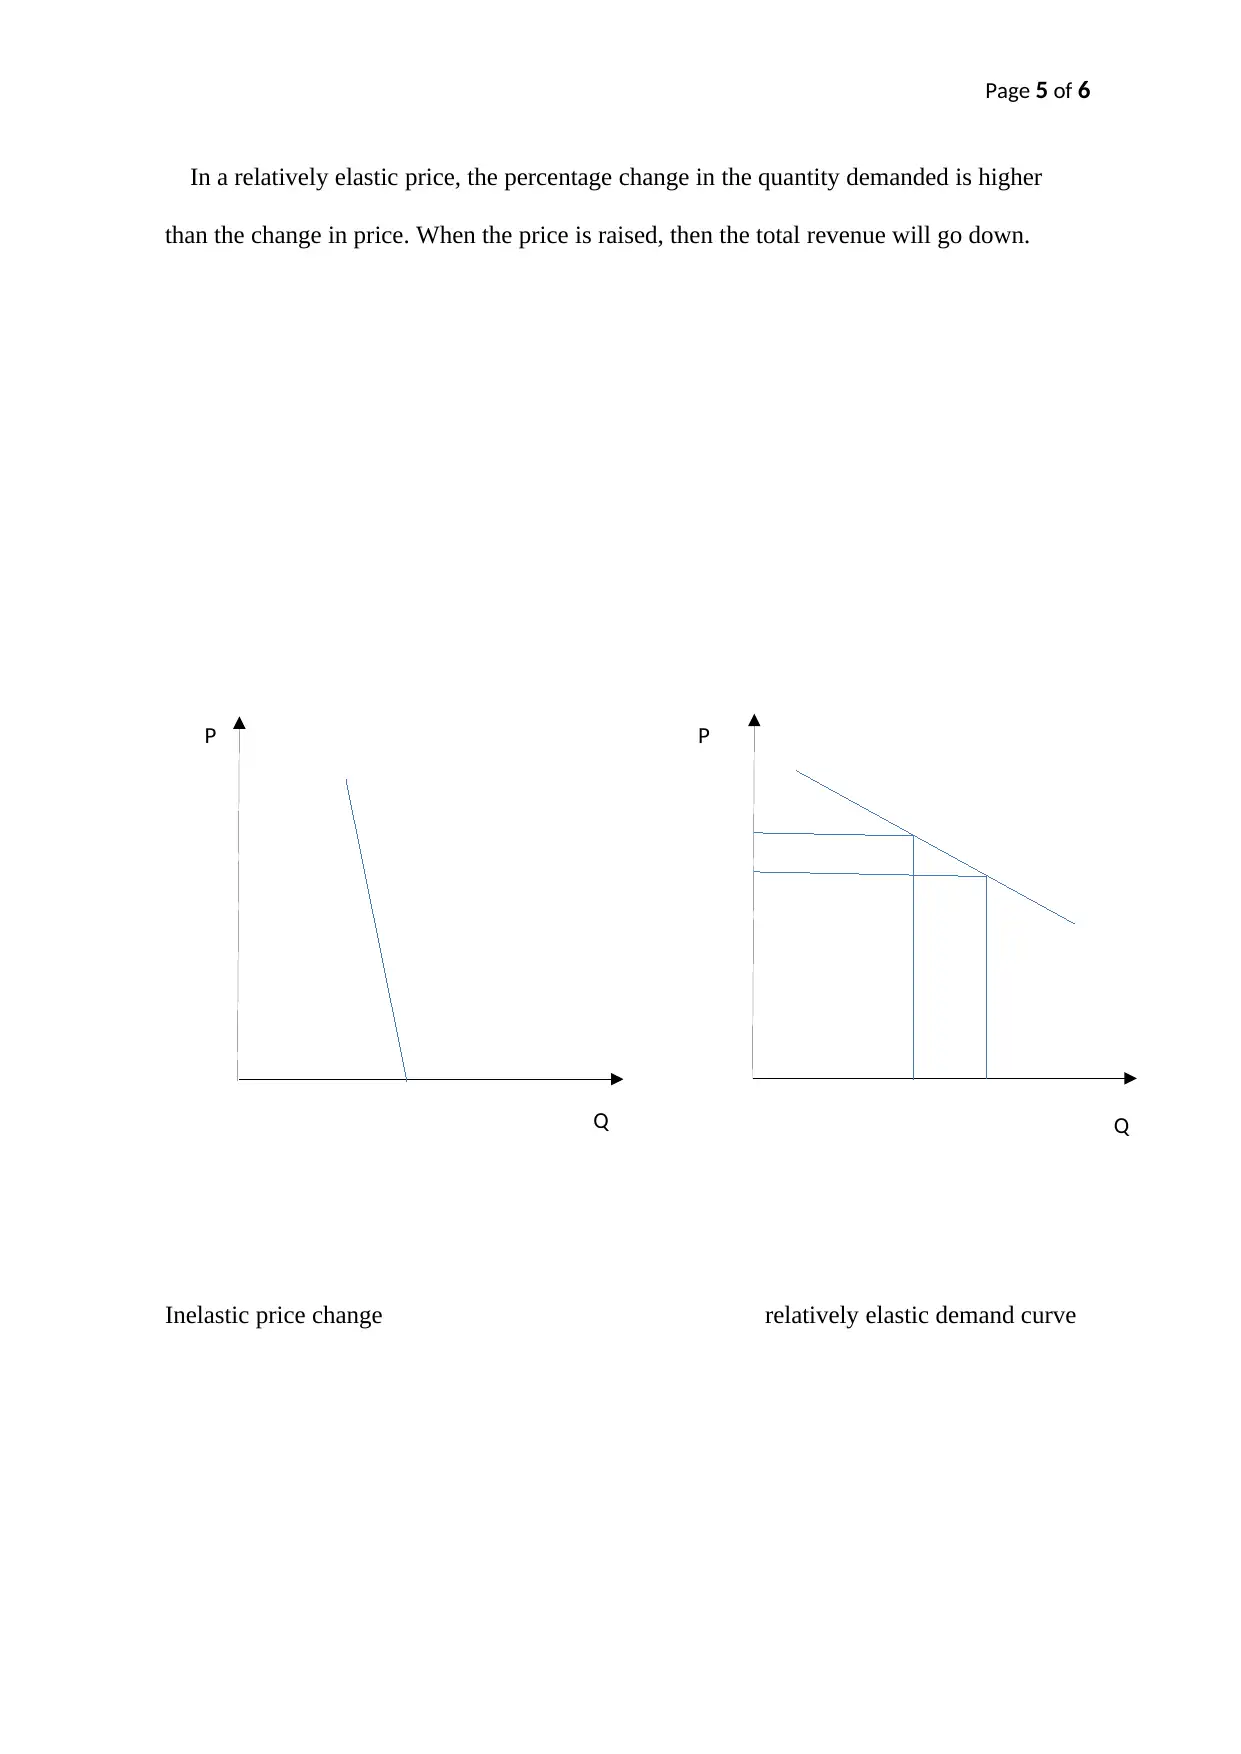
This economics assignment analyzes an article discussing flight and hotel pricing strategies. The student uses supply and demand diagrams to illustrate how prices increase as planes fill up and decrease as flight time approaches with lower-than-expected sales. The assignment defines and explains dynamic pricing in relation to the elasticity of demand, considering factors like substitute availability and income levels. Furthermore, the assignment examines the effect of price changes on quantity demanded, differentiating between relatively elastic and inelastic demand scenarios, using diagrams to visually represent these concepts. The student references several sources to support the analysis, demonstrating a solid understanding of economic principles.

Page 1 of 6
ATMC BUS102 Introduction to Economics
Assessment Task 2 – Responses to articles
Article 2: DUE via Safe Assign 6pm Saturday 18th May
Full Name:
Student number:
Tutor’s name:
ATMC BUS102 Introduction to Economics
Assessment Task 2 – Responses to articles
Article 2: DUE via Safe Assign 6pm Saturday 18th May
Full Name:
Student number:
Tutor’s name:
Paraphrase This Document
Need a fresh take? Get an instant paraphrase of this document with our AI Paraphraser

Price
S
Quantity
D
P*
Q*
Page 2 of 6
Question 1
According to the article, ‘prices increase as the planes fills up”. Use the supply and
demand diagram below to illustrate and explain why.
When planes fill up, demand for air travel increases. Prices for the seats then shoot.
This is because when demand increases, supply will be low and hence the market will
increase the prices so that demand goes down. When price goes down, it will meet supply
and therefore equilibrium is maintained when more supply returns prices to the normal
(Hoch, Kim, & Montgomery, 2016, p. 144). The increase in demand will be shown by a
shift by the demand curve upwards. The shift will cause an increase in prices shown by the
movement of p* upwards. The new demand curve will also form a new equilibrium above
the old equilibrium.

Price
S
Quantity
D
P*
Q*
Page 3 of 6
Question 2
The article claims that “seat only becomes cheaper as the flight time approaches if
sales are lower than expected.” Use the supply and demand diagram below to illustrate and
explain why.
This is related to the excess supply of seats in air transport. When the availability of
seats is higher than the demand for the seats, prices will be down (De Rassenfosse, 2017, p.
25). When the flight time approaches, seats get cheaper and cheaper since flight
management will not advocate for flights flying with empty seats. To overcome the excess
supply, the prices are lowered so that many people will demand the seats as shown by an
increase from Q*. Lowering the prices will mean that the supply will shift downwards to
meet the demand. The downward movement of these supply is caused by the reduction in
prices as shown by movement from P* downwards as shown in the above diagram.
⊘ This is a preview!⊘
Do you want full access?
Subscribe today to unlock all pages.

Trusted by 1+ million students worldwide

Page 4 of 6
Question 3
Explain the meaning of “dynamic pricing” in terms of elasticity of demand.
Dynamic pricing is a pricing plan in which traders set elastic prices for their
products based on the market forces of demand. Employment of dynamic pricing models
permit companies to adjust prices following any change in the determinants of demand.it is
important to examine how to price change affects sales (Singleton, 2017, p. 34). The
dynamic pricing models involve price elasticity of demand as a determining factor of
optimum price. Dynamic pricing uses historical data to show the nature of the relationship
between the price and quantity demanded. Factors that influence price elasticity include
substitute’s available, level of income and brand loyalty among others.
Question 4
The article claims that ‘prices can also differ depending on whether the hotel is in a
business or leisure destinations’. Complete the diagrams below to explain and illustrate the
effect of an increase in price on quantity when demand is:
Relatively inelastic (as the case of business city prices during the week) and
Relatively elastic
In a relatively inelastic demand, alterations in prices lead to relatively low changes in the
quantity demanded. In this case, the quantity demanded by people is not highly responsive
to the prices (De Rassenfosse, 2017, p. 25). No matter what the price will be, people will
not be able to avoid purchasing this commodity hence there is a little response on the
quantity demanded. The percentage change in the quantity demanded is lower than the
percentage change in prices.
Paraphrase This Document
Need a fresh take? Get an instant paraphrase of this document with our AI Paraphraser

P P
Q Q
Page 5 of 6
In a relatively elastic price, the percentage change in the quantity demanded is higher
than the change in price. When the price is raised, then the total revenue will go down.
Inelastic price change relatively elastic demand curve
Q Q
Page 5 of 6
In a relatively elastic price, the percentage change in the quantity demanded is higher
than the change in price. When the price is raised, then the total revenue will go down.
Inelastic price change relatively elastic demand curve

Page 6 of 6
References
De Rassenfosse, G. (2017). On the Price Eleasticity of Demand. Industry and Innovation,
32(4), 22-54.
Hoch , S. J., Kim , B. D., & Montgomery, A. L. (2016). Determinants of store-level price
elasticity. Journal of marketing Research, 65(8), 132-156.
Singleton, K. J. (2017). Empirical dynamic asset pricing: model specification and
econometric assessment. London: Princeton University Press.
⊘ This is a preview!⊘
Do you want full access?
Subscribe today to unlock all pages.

Trusted by 1+ million students worldwide
1 out of 6
Related Documents

Your All-in-One AI-Powered Toolkit for Academic Success.
+13062052269
info@desklib.com
Available 24*7 on WhatsApp / Email
Unlock your academic potential
Copyright © 2020–2025 A2Z Services. All Rights Reserved. Developed and managed by ZUCOL.