Economic Principles Report: Demand Analysis for Energy Bars
VerifiedAdded on 2020/04/13
|8
|926
|66
Report
AI Summary
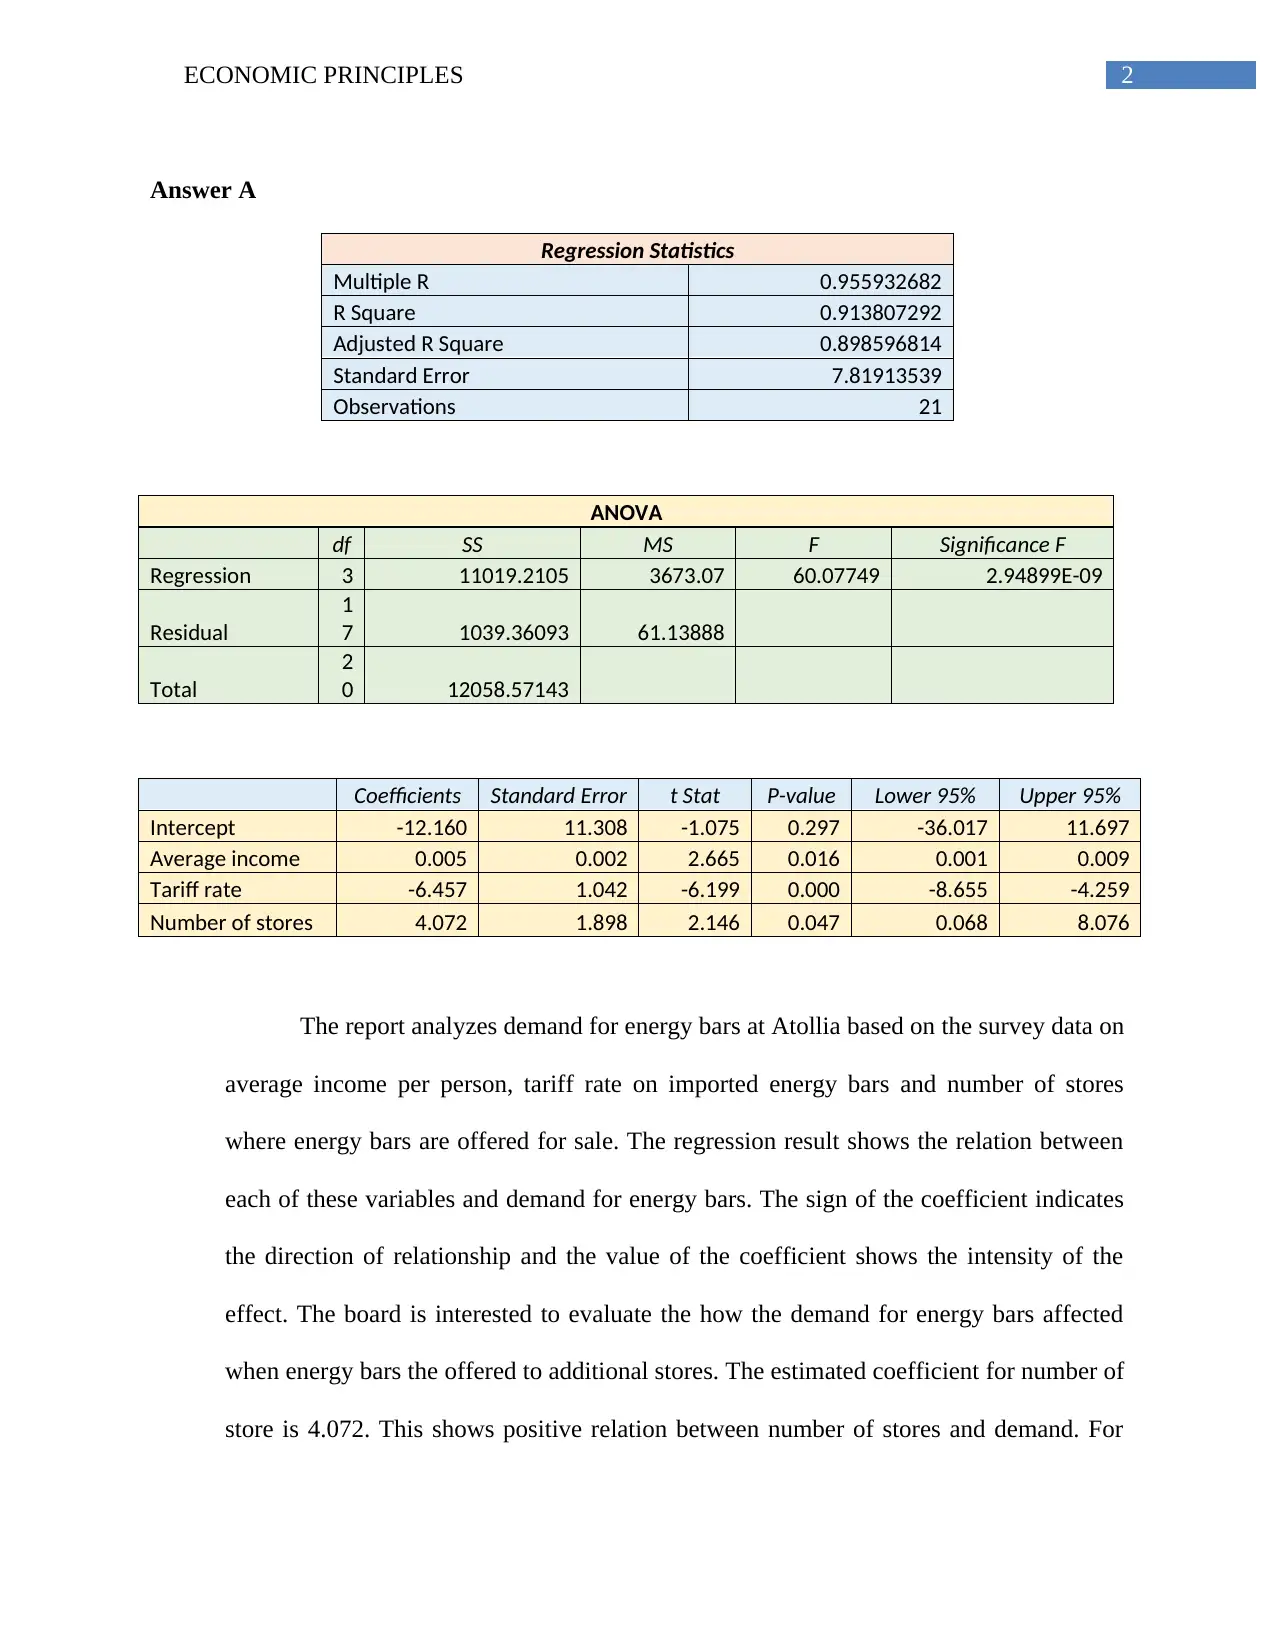
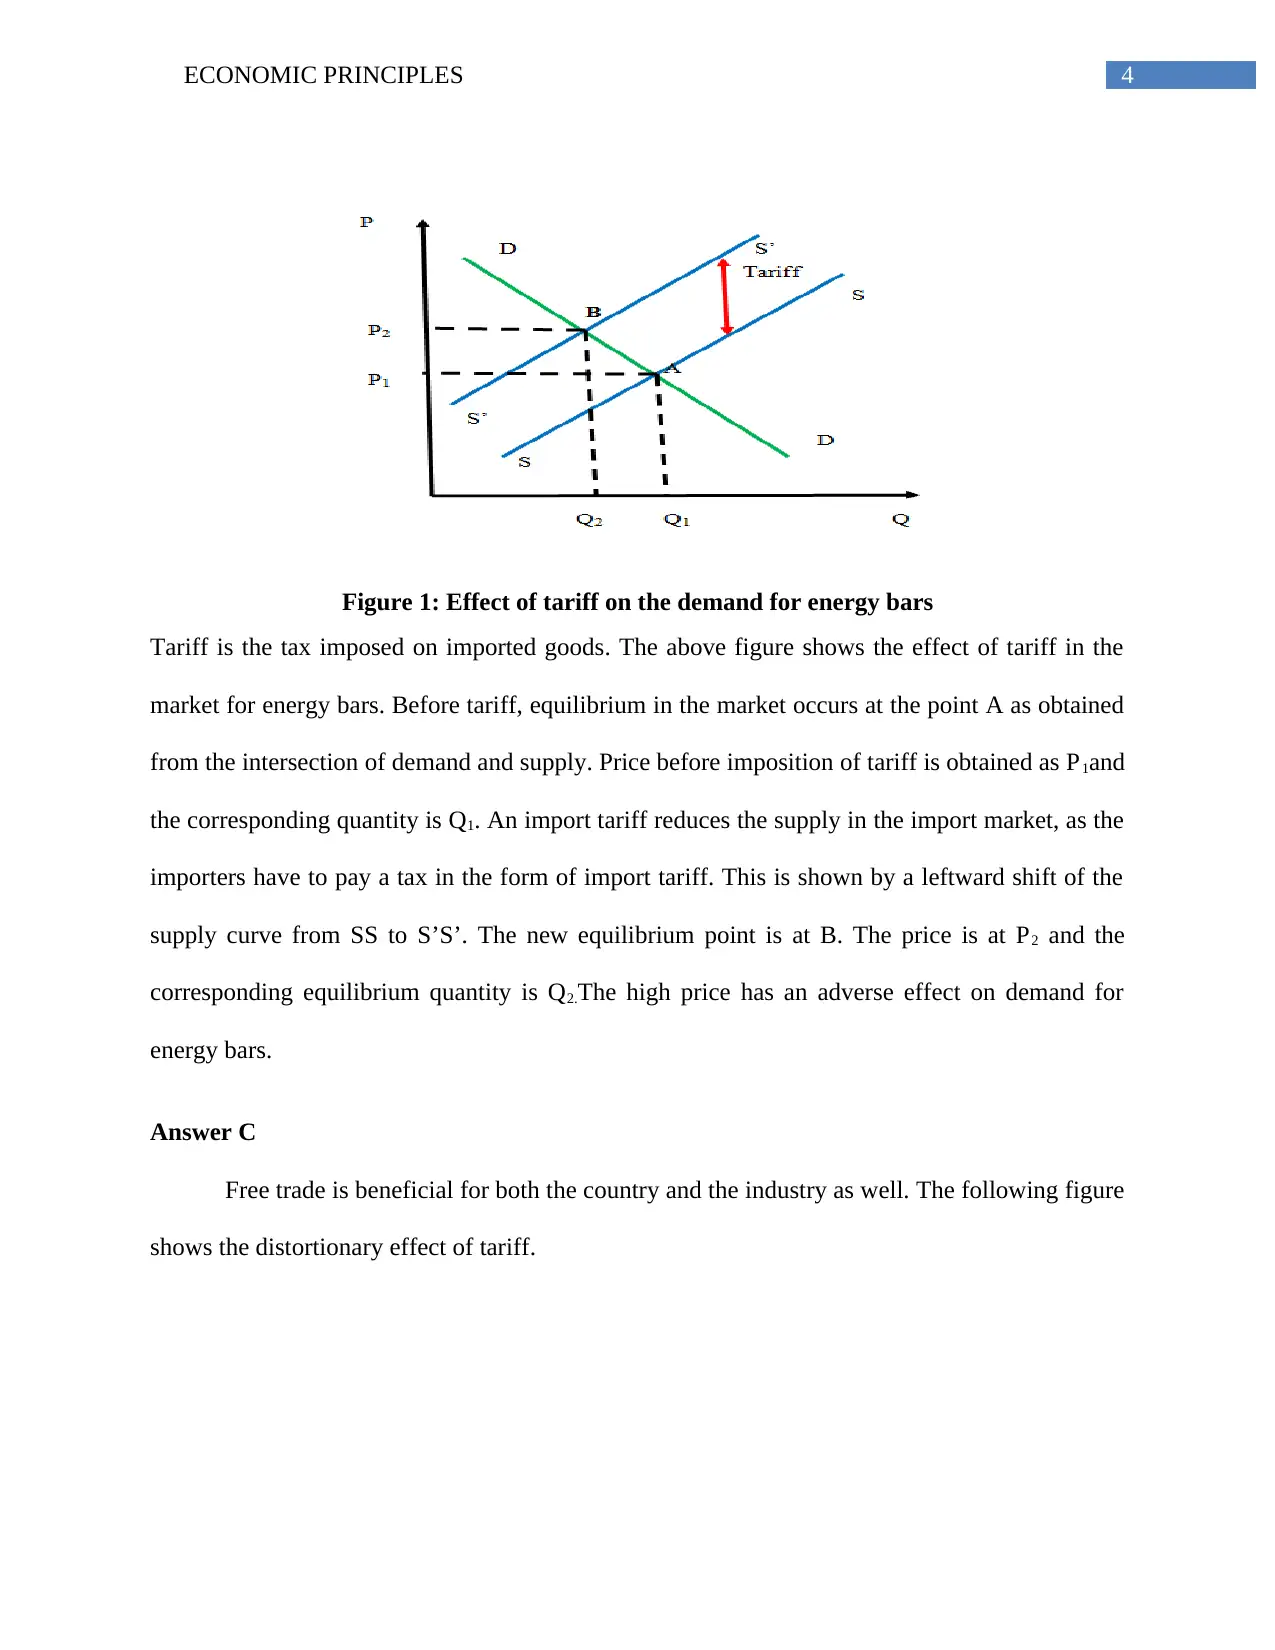
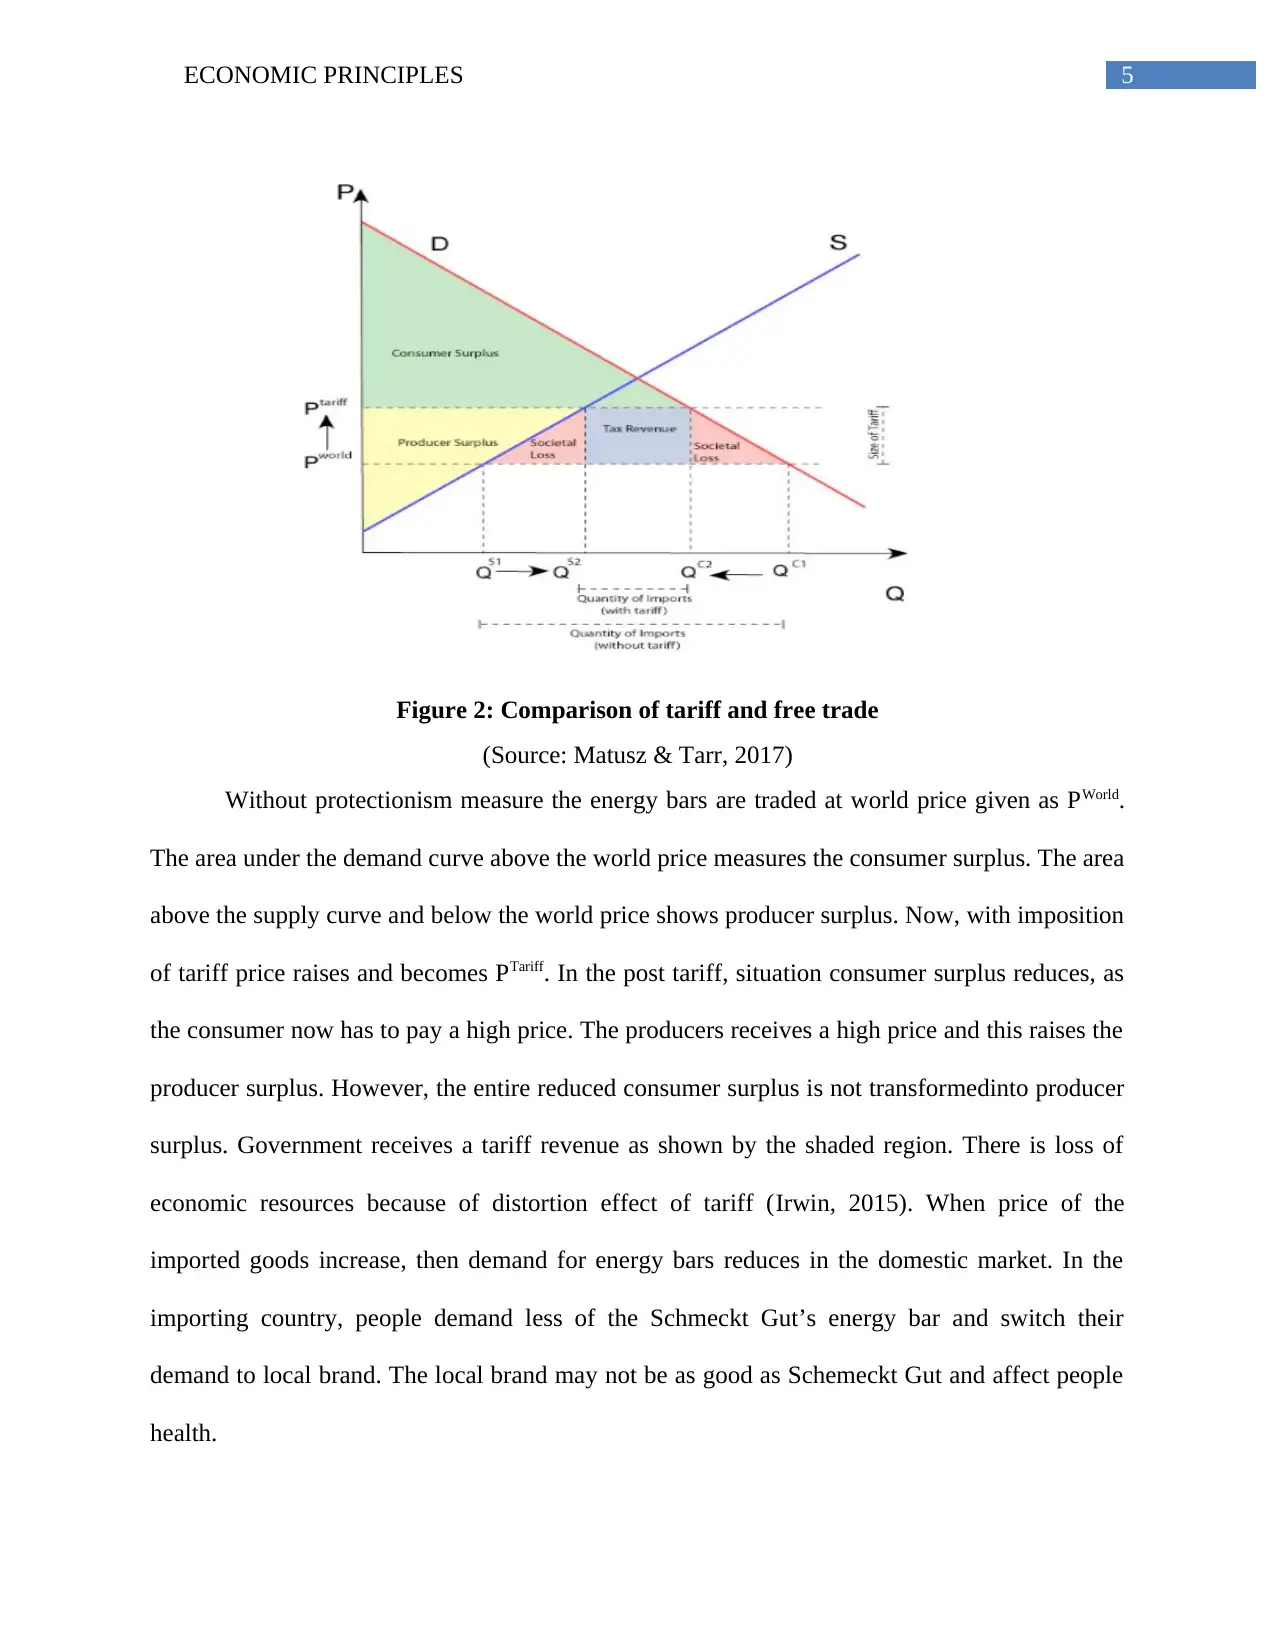
This report analyzes the demand for energy bars in Atollia, focusing on the impact of economic principles such as tariff rates, average income, and the number of stores selling the product. The analysis utilizes regression statistics to determine the relationship between these variables and the demand for energy bars. The report investigates the effect of tariffs on energy bar demand, highlighting the inverse relationship and the negative impact on sales. It also explores the benefits of free trade compared to protectionist measures like tariffs, illustrating the distortionary effects of tariffs on consumer and producer surplus and the potential negative health impacts on consumers. The report concludes by emphasizing the dampening effect of tariffs on the overall demand for energy bars, supported by the regression results, and provides figures to visually represent the effects of tariffs on the market equilibrium. The report utilizes references to support its findings.

Running Head: ECONOMIC PRINCIPLES
Economic Principles
Name of the Student
Name of the University
Author note
Economic Principles
Name of the Student
Name of the University
Author note
Paraphrase This Document
Need a fresh take? Get an instant paraphrase of this document with our AI Paraphraser

1ECONOMIC PRINCIPLES
Table of Contents
Answer A.........................................................................................................................................2
Answer B.........................................................................................................................................3
Answer C.........................................................................................................................................4
References........................................................................................................................................6

2ECONOMIC PRINCIPLES
Answer A
Regression Statistics
Multiple R 0.955932682
R Square 0.913807292
Adjusted R Square 0.898596814
Standard Error 7.81913539
Observations 21
ANOVA
df SS MS F Significance F
Regression 3 11019.2105 3673.07 60.07749 2.94899E-09
Residual
1
7 1039.36093 61.13888
Total
2
0 12058.57143
Coefficients Standard Error t Stat P-value Lower 95% Upper 95%
Intercept -12.160 11.308 -1.075 0.297 -36.017 11.697
Average income 0.005 0.002 2.665 0.016 0.001 0.009
Tariff rate -6.457 1.042 -6.199 0.000 -8.655 -4.259
Number of stores 4.072 1.898 2.146 0.047 0.068 8.076
The report analyzes demand for energy bars at Atollia based on the survey data on
average income per person, tariff rate on imported energy bars and number of stores
where energy bars are offered for sale. The regression result shows the relation between
each of these variables and demand for energy bars. The sign of the coefficient indicates
the direction of relationship and the value of the coefficient shows the intensity of the
effect. The board is interested to evaluate the how the demand for energy bars affected
when energy bars the offered to additional stores. The estimated coefficient for number of
store is 4.072. This shows positive relation between number of stores and demand. For
⊘ This is a preview!⊘
Do you want full access?
Subscribe today to unlock all pages.

Trusted by 1+ million students worldwide

3ECONOMIC PRINCIPLES
unit increase in the number of stores, demand increases by 4.07%. The P value of the
coefficient is 0.047. This implies the variable is marginally significant at 5% level of
significance and significant at 10% level of significance. The other two variables
affecting demand are average income and tariff rate. The former shows a significant
positive relation with demand while the later shows a significantly negative impact on
demand.
Answer B
1.
The impact of tariff on demand for energy bars can be traced from the regression result. The
result shows the estimated coefficient for tariff rate is -6.457. This signifies an inverse
relationship between the energy demand and tariff rate. Therefore, as the tariff rate increases
demand for energy bars go down. With increase in the tariff rate, the demand for energy bars
decreases by 6.45%. The variable is statistically significant as implied by a significant P value of
0.000. The trade minister should be informed regarding the adverse impact of the tariff on
demand and sales of energy bars of Schmeckt Gut.
2.
Paraphrase This Document
Need a fresh take? Get an instant paraphrase of this document with our AI Paraphraser

4ECONOMIC PRINCIPLES
Figure 1: Effect of tariff on the demand for energy bars
Tariff is the tax imposed on imported goods. The above figure shows the effect of tariff in the
market for energy bars. Before tariff, equilibrium in the market occurs at the point A as obtained
from the intersection of demand and supply. Price before imposition of tariff is obtained as P1and
the corresponding quantity is Q1. An import tariff reduces the supply in the import market, as the
importers have to pay a tax in the form of import tariff. This is shown by a leftward shift of the
supply curve from SS to S’S’. The new equilibrium point is at B. The price is at P2 and the
corresponding equilibrium quantity is Q2.The high price has an adverse effect on demand for
energy bars.
Answer C
Free trade is beneficial for both the country and the industry as well. The following figure
shows the distortionary effect of tariff.

5ECONOMIC PRINCIPLES
Figure 2: Comparison of tariff and free trade
(Source: Matusz & Tarr, 2017)
Without protectionism measure the energy bars are traded at world price given as PWorld.
The area under the demand curve above the world price measures the consumer surplus. The area
above the supply curve and below the world price shows producer surplus. Now, with imposition
of tariff price raises and becomes PTariff. In the post tariff, situation consumer surplus reduces, as
the consumer now has to pay a high price. The producers receives a high price and this raises the
producer surplus. However, the entire reduced consumer surplus is not transformedinto producer
surplus. Government receives a tariff revenue as shown by the shaded region. There is loss of
economic resources because of distortion effect of tariff (Irwin, 2015). When price of the
imported goods increase, then demand for energy bars reduces in the domestic market. In the
importing country, people demand less of the Schmeckt Gut’s energy bar and switch their
demand to local brand. The local brand may not be as good as Schemeckt Gut and affect people
health.
⊘ This is a preview!⊘
Do you want full access?
Subscribe today to unlock all pages.

Trusted by 1+ million students worldwide

6ECONOMIC PRINCIPLES
The result is supported from the regression result. The regression gives a negative
coefficient for tariff rate implying a negative relation between tariff and Schmeckt Gut energy
bar demand. The statistically significant negative coefficient for tariff reflects the dampening
effect of tariff on average demand of energy bars.
Paraphrase This Document
Need a fresh take? Get an instant paraphrase of this document with our AI Paraphraser

7ECONOMIC PRINCIPLES
References
Irwin, D. A. (2015). Free trade under fire. Princeton University Press.
Matusz, S. J., & Tarr, D. G. (2017). Adjusting to trade policy reform. In Trade Policies for
Development and Transition (pp. 77-114).
References
Irwin, D. A. (2015). Free trade under fire. Princeton University Press.
Matusz, S. J., & Tarr, D. G. (2017). Adjusting to trade policy reform. In Trade Policies for
Development and Transition (pp. 77-114).
1 out of 8
Related Documents
Your All-in-One AI-Powered Toolkit for Academic Success.
+13062052269
info@desklib.com
Available 24*7 on WhatsApp / Email
Unlock your academic potential
Copyright © 2020–2025 A2Z Services. All Rights Reserved. Developed and managed by ZUCOL.


