AUB Group Ltd: FY2018 Financial Report Analysis - A Deep Dive
VerifiedAdded on 2023/03/23
|8
|1928
|71
Report
AI Summary
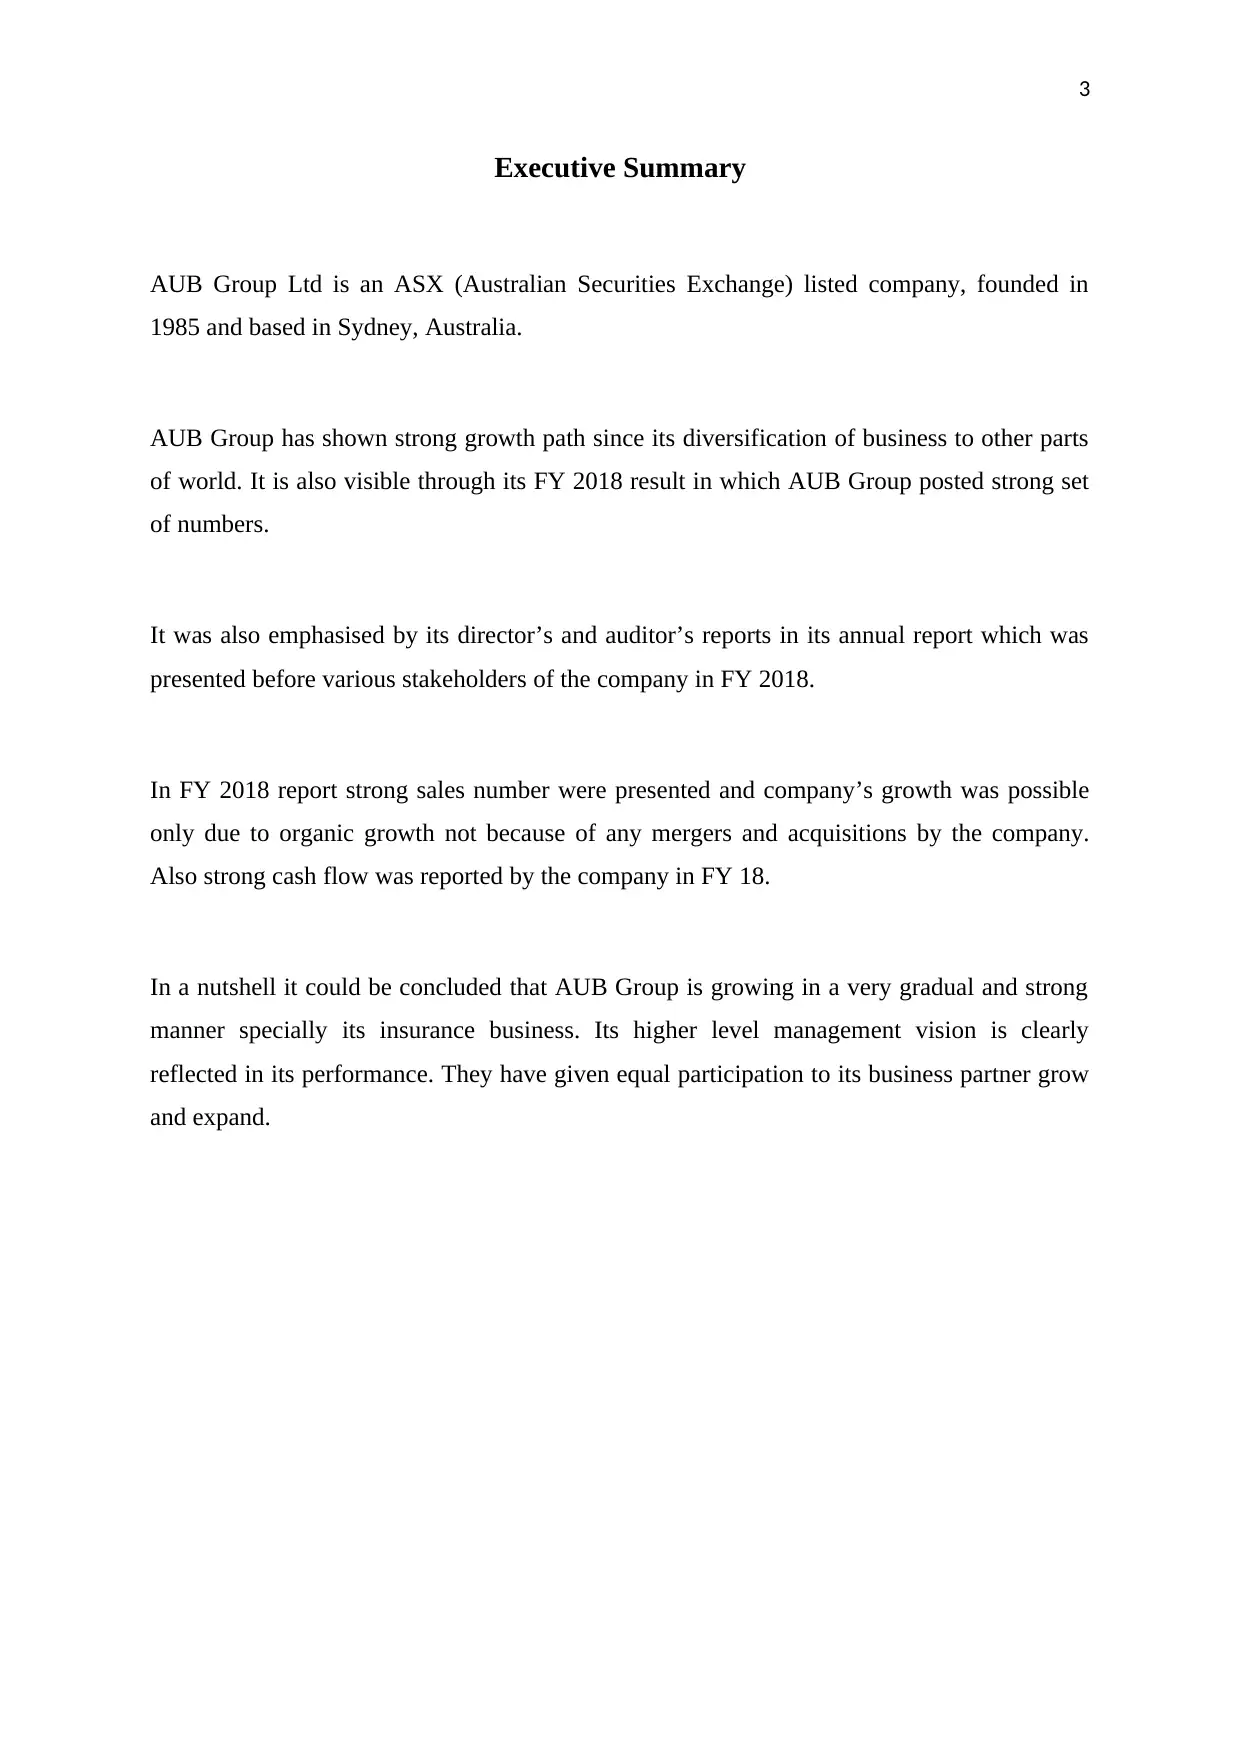
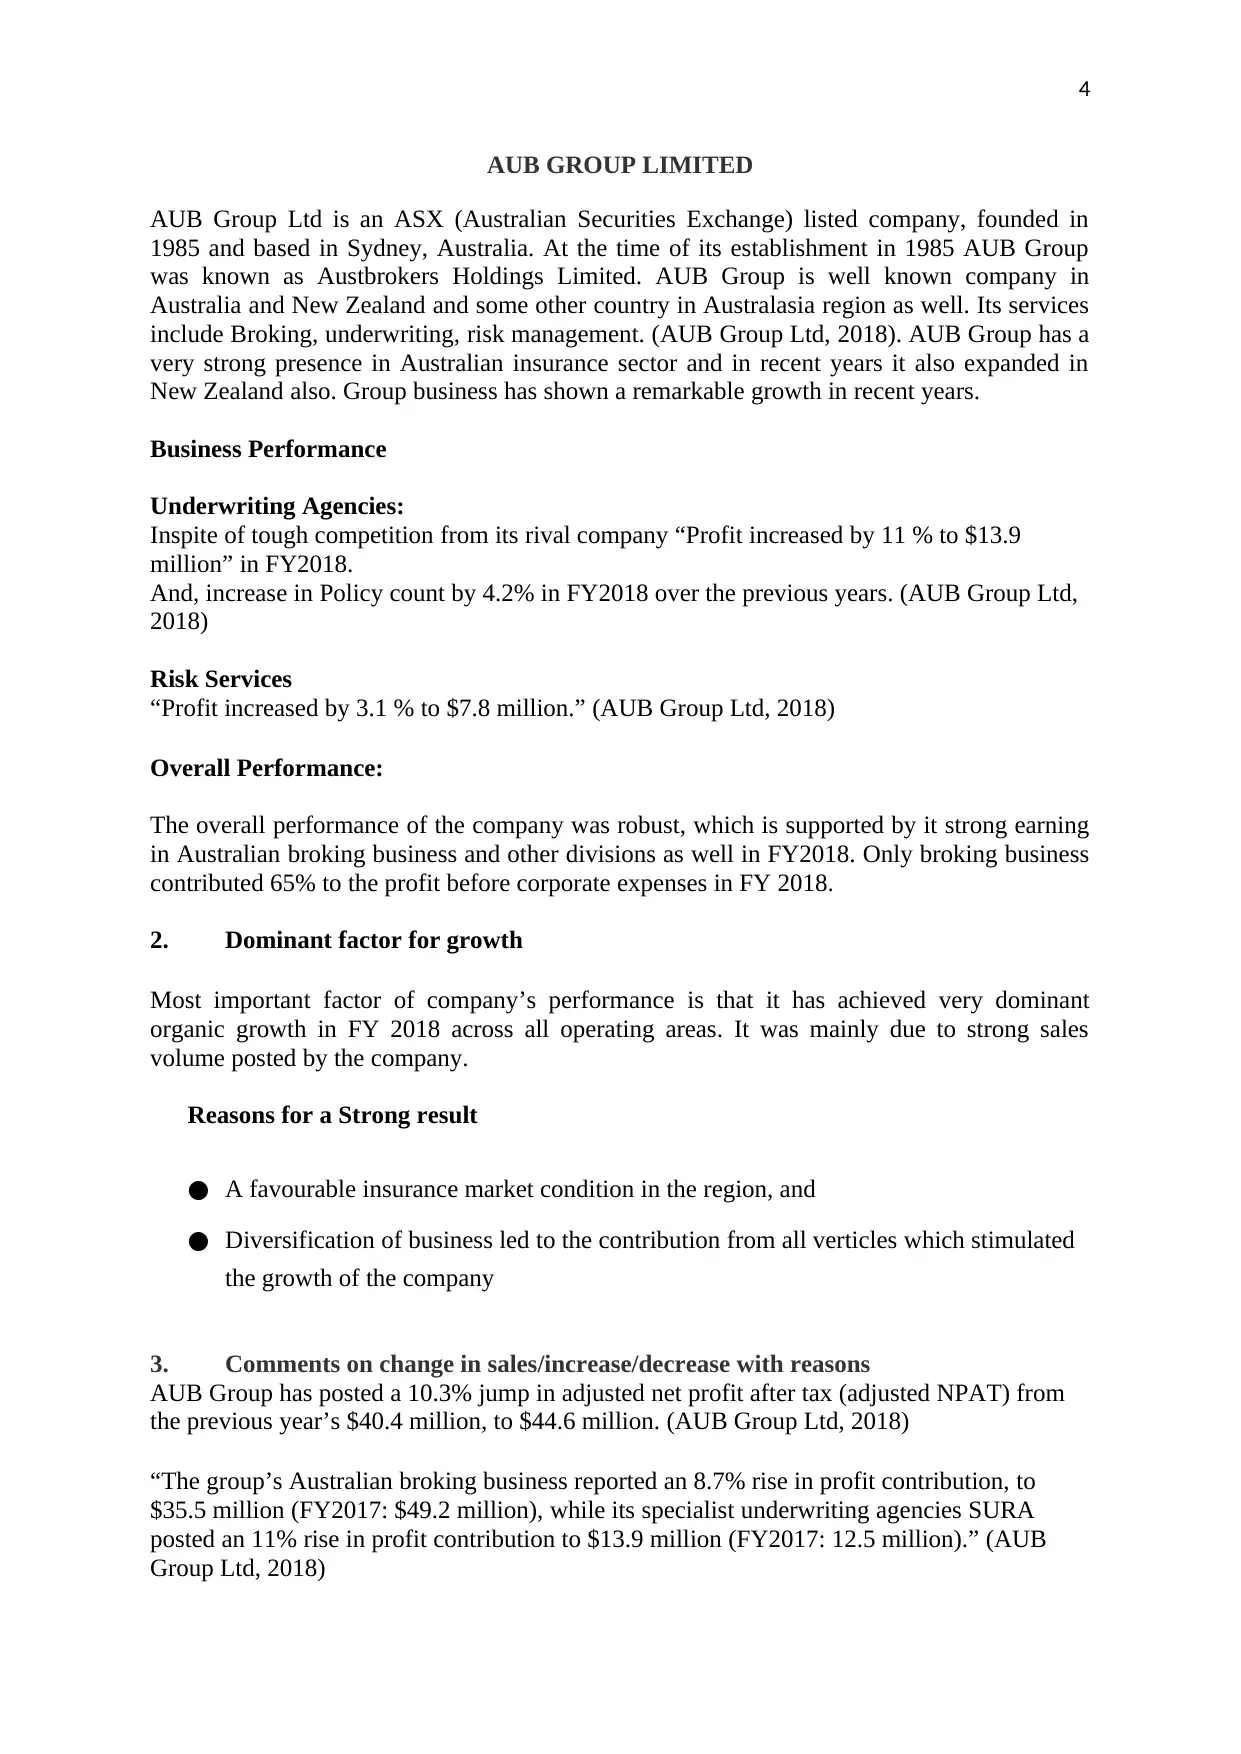
This report provides a detailed analysis of AUB Group Ltd's financial performance in FY2018, based on their annual report. It highlights the company's strong organic growth, increased sales, and robust cash flow. The analysis includes summaries of the director's and auditor's reports, along with calculations of various financial ratios such as current ratio, price-to-earnings ratio, debt-equity ratio, and gross margin. The report concludes that AUB Group presented a positive set of results, driven by diversification and cost minimization, suggesting a bright future if the management maintains its strategic approach. Desklib offers a variety of study tools, including past papers and solved assignments, to support students in their academic pursuits.

1
School/College Name
Year
Class
Topic
Subject
Submitted By
Submitted To
School/College Name
Year
Class
Topic
Subject
Submitted By
Submitted To
Secure Best Marks with AI Grader
Need help grading? Try our AI Grader for instant feedback on your assignments.

2
Table of Contents Page No.
Executive Summary 3
Providing brief of the company 4
Selection & comments on the dominating section of the annual report 4
A brief summary of director’s report from director’s report section 4
A brief summary of auditor’s report from auditor’s report section 6
Change in sales/increase/decrease with reasons 4
Change in cash flow from operating activities 6
Cash flow from operating activities in number/percentage 6
Comments on retained profits/loans and debentures 6
Calculations of various ratios 6
Conclusion 7
References 8

3
Executive Summary
AUB Group Ltd is an ASX (Australian Securities Exchange) listed company, founded in
1985 and based in Sydney, Australia.
AUB Group has shown strong growth path since its diversification of business to other parts
of world. It is also visible through its FY 2018 result in which AUB Group posted strong set
of numbers.
It was also emphasised by its director’s and auditor’s reports in its annual report which was
presented before various stakeholders of the company in FY 2018.
In FY 2018 report strong sales number were presented and company’s growth was possible
only due to organic growth not because of any mergers and acquisitions by the company.
Also strong cash flow was reported by the company in FY 18.
In a nutshell it could be concluded that AUB Group is growing in a very gradual and strong
manner specially its insurance business. Its higher level management vision is clearly
reflected in its performance. They have given equal participation to its business partner grow
and expand.

4
AUB GROUP LIMITED
AUB Group Ltd is an ASX (Australian Securities Exchange) listed company, founded in
1985 and based in Sydney, Australia. At the time of its establishment in 1985 AUB Group
was known as Austbrokers Holdings Limited. AUB Group is well known company in
Australia and New Zealand and some other country in Australasia region as well. Its services
include Broking, underwriting, risk management. (AUB Group Ltd, 2018). AUB Group has a
very strong presence in Australian insurance sector and in recent years it also expanded in
New Zealand also. Group business has shown a remarkable growth in recent years.
Business Performance
Underwriting Agencies:
Inspite of tough competition from its rival company “Profit increased by 11 % to $13.9
million” in FY2018.
And, increase in Policy count by 4.2% in FY2018 over the previous years. (AUB Group Ltd,
2018)
Risk Services
“Profit increased by 3.1 % to $7.8 million.” (AUB Group Ltd, 2018)
Overall Performance:
The overall performance of the company was robust, which is supported by it strong earning
in Australian broking business and other divisions as well in FY2018. Only broking business
contributed 65% to the profit before corporate expenses in FY 2018.
2. Dominant factor for growth
Most important factor of company’s performance is that it has achieved very dominant
organic growth in FY 2018 across all operating areas. It was mainly due to strong sales
volume posted by the company.
Reasons for a Strong result
● A favourable insurance market condition in the region, and
● Diversification of business led to the contribution from all verticles which stimulated
the growth of the company
3. Comments on change in sales/increase/decrease with reasons
AUB Group has posted a 10.3% jump in adjusted net profit after tax (adjusted NPAT) from
the previous year’s $40.4 million, to $44.6 million. (AUB Group Ltd, 2018)
“The group’s Australian broking business reported an 8.7% rise in profit contribution, to
$35.5 million (FY2017: $49.2 million), while its specialist underwriting agencies SURA
posted an 11% rise in profit contribution to $13.9 million (FY2017: 12.5 million).” (AUB
Group Ltd, 2018)
Secure Best Marks with AI Grader
Need help grading? Try our AI Grader for instant feedback on your assignments.

5
4. Summary of the Director’s Reports:
The names of each director, served during the reporting year and their Qualification;
1) D. C. Clarke LLB (Non-Executive Chair), MAICD
2) M.P.L. Searles GAICD, DipM, Grad DipMktg
3) R. J. Carless BEc, MAICD
4) R. J. Low B Com, FCA, GAICD
5) P. A. LahiffBSc Agr, GAICD
6) C. L. Rogers, CFA, B Com,MBA,GAICD
Company Secretary
J. L Coss, BA, LLB, Dip CII,ANZIIF (Fellow) CIP, FGIA, FCIS, Adv
Dip (Management)
Company Secretary
H. T. Elderman, JD, BA
Key trading activities:
The operation of AUB Group executed through two key business segments that is
Insurance Intermediaries and Risk Services.
The AUB Group handles over “1.2 million client policies, via some 135 partner
businesses located across Australia and New Zealand. In total, the Group represents
around $4.7 billion of policy premium.” (AUB Group Ltd, 2018)
Financial Status of Company
● On an Adjusted NPAT (Net Profit after tax) basis, earnings per share increased by
10.3% to thousand $ 44,554 over the prior year at 30 June 2017 at thousand $ 40,382.
● “Shareholders’ equity increased to $357.2 million from $345.8 million at 30 June
2017.” (AUB Group Ltd, 2018)
● Interest-bearing loans and borrowings increased by $26.1 million to $121.2 million
this was mainly due to acquisitions by the Group.
Future Business Strategies
● To develop stronger partnership with our partner and helping them to get more
opportunity and become even more profitable in future.
● Customising our solution as per the client need and offer better results for clients.

6
● To improve our services as per the need of client and also for efficiency improvement,
and
● Keeping our foundations intact through our disciplined approach in investment and
supporting our people.
Key Business Risk
● Compliance and regulatory risk
● Investment risk
● People, conduct and culture risk
● Technology and cyber risk
● Dependence on key suppliers
● Operating & Financial Risk
Recommendations for dividends for the reporting year
“On 27 August 2018 the AUB Group Limited declared a final dividend on ordinary
shares of 32.0 cents per share in respect of the 2018 financial year.” (AUB Group Ltd,
2018) The total amount of the dividend was $20.431 million.
Risk Management:
Risk management through effective and strategically delivered services for the client to
achieve it desired objective/goal.
5 Report submitted by Auditor:
Financial Report by Ernst & Young, Australia
“We have audited the financial report of AUB Group Limited (the Company) and its
subsidiaries (collectively the Group), which comprises the consolidated statement of
financial position as at 30 June 2018, consolidated statement of comprehensive income,
consolidated statement of changes in equity and consolidated statement of cash flows for
the year then ended, notes to the financial statements, including a summary of significant
accounting policies, and the directors’ declaration.” (AUB Group Ltd, 2018)
“In our opinion the accompanying financial report of the Group is in accordance with the
Corporations Act 2001, including:
a. Giving a true and fair view of the consolidated financial position of the Group as at 30
June 2018 and of its consolidated financial performance for the year ended on that
date; and
b. Complying with Australian Accounting Standards and the Corporations Regulations
2001.” (AUB Group Ltd, 2018)

7
6. Cash flow:
“The Group generated positive cash flow from operating activities of $46.2 million Net cash
from operating activities before customer trust account movements compared to the prior
year 2017 at $56.4 million. Reduction in cash flow, predominantly due to timing differences
on 2017 supplier payments. Total cash at the end of the period were $58.7 million.” (AUB
Group Ltd, 2018)
7. Ratio Analysis:
a) Current Ratio= Current Assets / Current Liabilities
Current Ratio = 338,370/273,262= 1.24
Current Assets=338,370
Current Liabilities=273,262
Company has 1.24 dollar of current assets for every 1 dollar of current liabilities
b) Price to earnings Ratio (P/E) =Price Per share/Earning Per share (EPS)
Price to earnings Ratio= 12.2/1.81= A$ 6.74
Price per Share= A$ 12.20
Earnings Per share=A$ 1.81
For every A$ 1 we are willing to A$ 6.74 times
c) Debt Equity Ratio= Debt/ (Debt plus Equity) Ratio
Debt Equity Ratio=121,202/478,432= 25.33%
Interest-bearing loans and borrowings= ($’ 000) 121,202
Total equity and borrowings= ($’ 000) 478,432
Maintaining Debt to Equity ratio less than 30% is a good sign for a company.
d) Gross Margin= Gross Profit/Net Sales
Gross Margin= 68,148/62.692= 1.08
Gross Profit= ($’000) 68,148
Net Sales= ($’000) 62,692
Indicate % of sales $ available for expenses and profit after the cost of company deducted
from sales.
8. Conclusion:
AUB Group presented a very good set of result in financial year 2018. This was possible due
to overall organic growth of company. Their strong sales number boosted company’s
performance. In last few years their focus on diversification of their business also contributed
in strong number for organisation. All verticals shows good set of numbers but their
insurance business was particularly very good. Their consistent effort of cost minimization
was also helping to improve their margin. In a nutshell, it is visible that growth of the
company will remain in future too if management don’t commit any horrible mistake. Their
high level management team always focused on introducing innovative ideas into company’s
Paraphrase This Document
Need a fresh take? Get an instant paraphrase of this document with our AI Paraphraser

8
organisational structure to boost future prospects for the company. The Group delivery of the
services to the clients are very efficient and as per the need of the customer. This company’s
future looks very bright in coming years as well due to its strong performance.
Referencing
AUB Group Ltd. (2018) Annual Report 2018. Sydney: AUB Group. Available at:
https://www.aubgroup.com.au/site/investor/results-centre/annual-reports (Accessed: 15 May
2019)
Damodaran, Aswath. (2002) Corporate Finance: Theory and Practice, 2nd edn. Delhi: Wisely
India Pvt. Ltd.
Horngren, Charles T, Datar, Srikant M, Rajan, Madhav V. (2013) Cost Accounting A
Managerial Emphasis. 14th edn. Delhi: Dorling Kindersley Pvt. Ltd.
Khan, MY, Jain, PK. (2012) Basic Financial Management, 3rd edn. Delhi: Tata McGraw Hill
Education Pvt. Ltd.
1 out of 8
Related Documents

Your All-in-One AI-Powered Toolkit for Academic Success.
+13062052269
info@desklib.com
Available 24*7 on WhatsApp / Email
Unlock your academic potential
© 2024 | Zucol Services PVT LTD | All rights reserved.