Auckland International Airport: Financial Management Plan Report
VerifiedAdded on 2022/08/13
|29
|4059
|17
Report
AI Summary
This report provides a financial management plan for Auckland International Airport, analyzing its financial performance based on annual reports. The report includes an executive summary, stakeholder analysis (government and shareholders), and capital budgeting using NPV and IRR methods. It evaluates profitability ratios (net profit margin, operating profit margin, return on equity, return on assets) and efficiency ratios (asset turnover, inventory turnover, accounts payable turnover). The analysis covers risk and return, country risks, and the company's hedging strategies. The report also includes suggestions for improvements and concludes with an assessment of the airport's financial health and future prospects. The report finds that the company is committed to meeting the needs of its stakeholders and has increased revenue, despite some declines in profitability ratios. The company is also shown to be managing its operations effectively.
Running Head: FINANCIAL MANAGEMENT PLAN
Executive Summary
The purpose of the report is to do a financial management
plan of Auckland International Airport. The study is supported by
analysing the annual reports of the three financial year of the
company. It is found that Auckland airport is committed to
meeting the needs of the stakeholders and the shareholders of
the company. The business has increased its revenue in the
current financial year. The company is able to manage their
operations.
Paraphrase This Document
Need a fresh take? Get an instant paraphrase of this document with our AI Paraphraser
1
FINANCIAL MANAGEMENT PLAN
Contents
Part A.........................................................................................................................................2
Part B..........................................................................................................................................3
Part C..........................................................................................................................................4
Part D.........................................................................................................................................5
Part E..........................................................................................................................................7
Part F..........................................................................................................................................8
Part G.........................................................................................................................................9
Part H.......................................................................................................................................13
Part I.........................................................................................................................................15
Part J.........................................................................................................................................16
References...........................................................................................................................19
Part A.........................................................................................................................................2
Part B..........................................................................................................................................3
Part C..........................................................................................................................................4
Part D.........................................................................................................................................5
Part E..........................................................................................................................................7
Part F..........................................................................................................................................7
Part G.........................................................................................................................................9
The company communication framework and structure designed in such a
way in order to ensure proper communication with shareholders and other
2
FINANCIAL MANAGEMENT PLAN
stakeholders of the company properly managed.This strategy forms part
of the disclosure and communication policy.The company keep internal
stakeholder and shareholder informed and communicated through various
strategy involved namely:.............................................................................................12
Part H.......................................................................................................................................13
Part I.........................................................................................................................................15
Part J.........................................................................................................................................16
References...........................................................................................................................18
⊘ This is a preview!⊘
Do you want full access?
Subscribe today to unlock all pages.
Trusted by 1+ million students worldwide
3
FINANCIAL MANAGEMENT PLAN
Part A
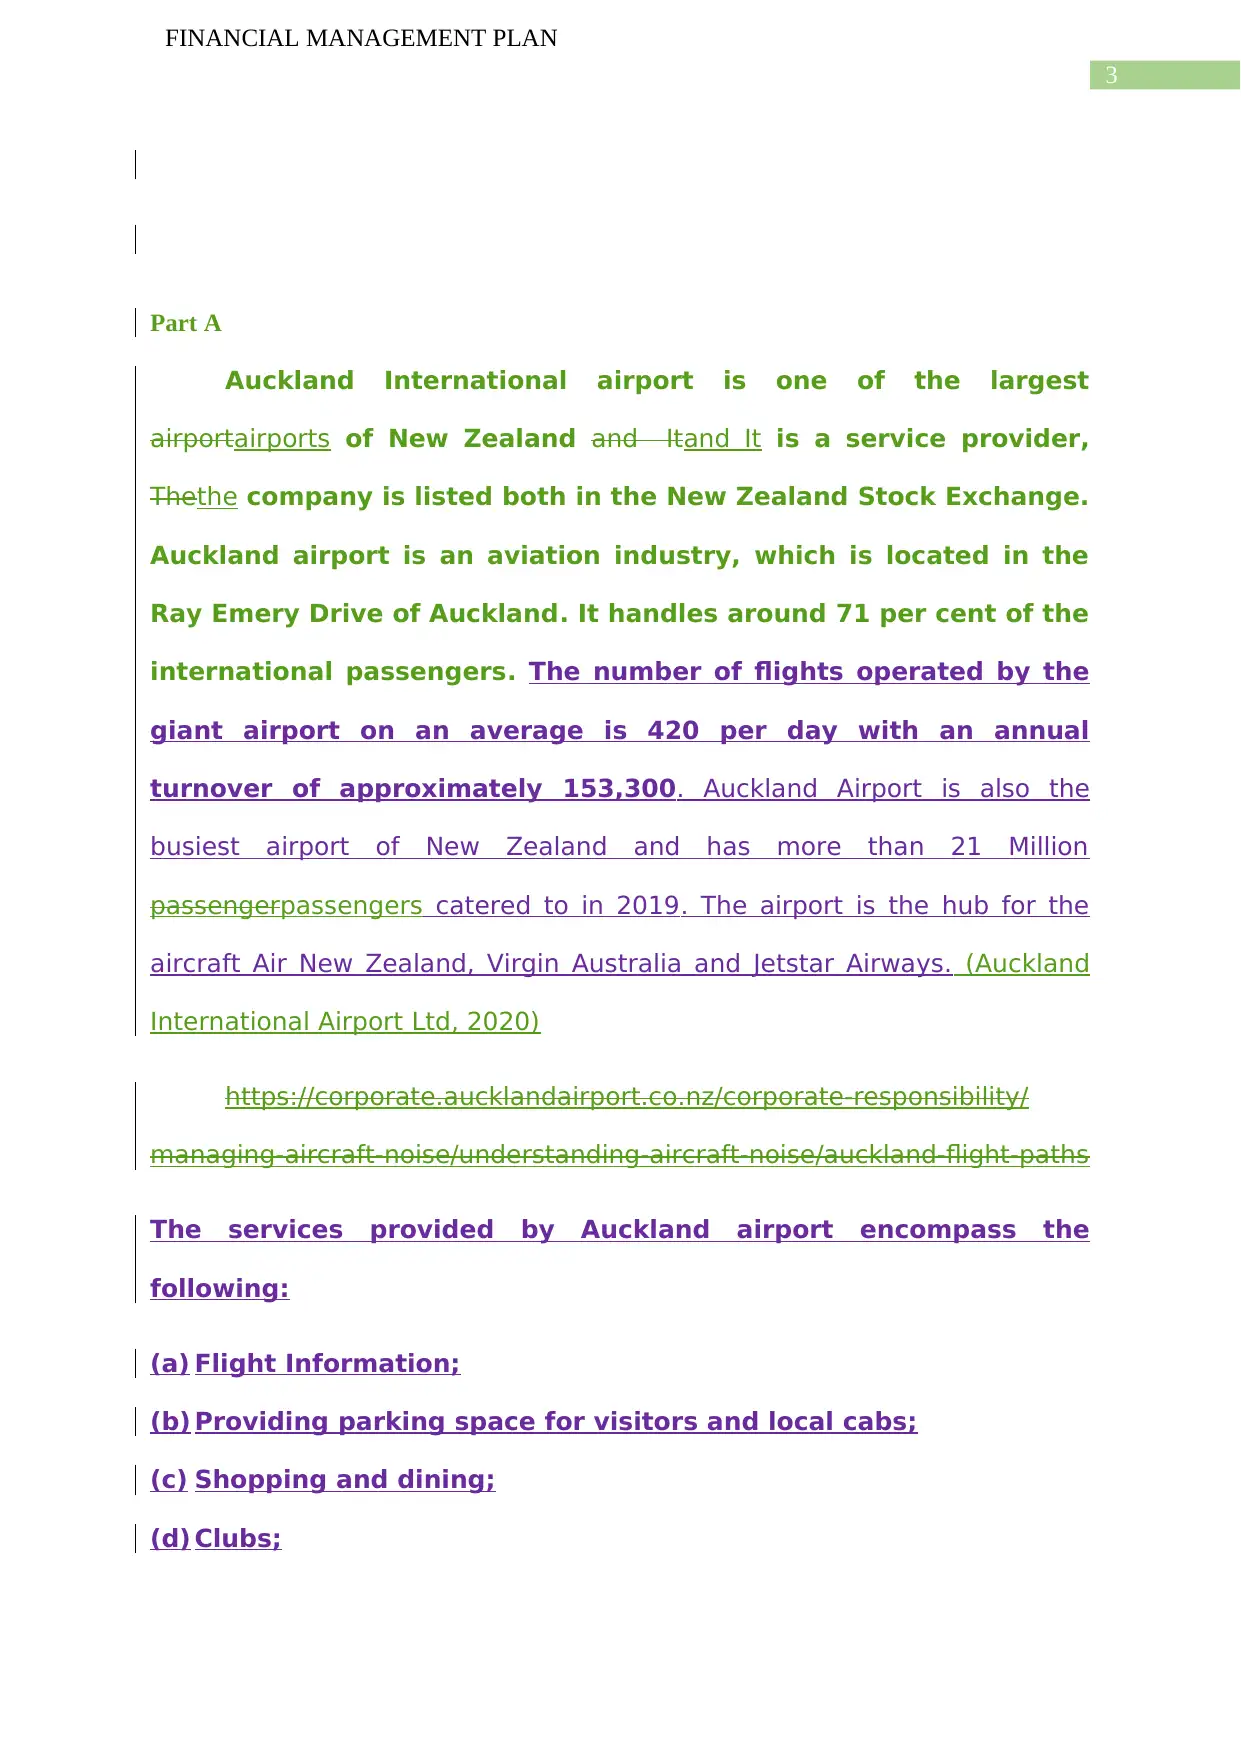
Auckland International airport is one of the largest
airportairports of New Zealand and Itand It is a service provider,
Thethe company is listed both in the New Zealand Stock Exchange.
Auckland airport is an aviation industry, which is located in the
Ray Emery Drive of Auckland. It handles around 71 per cent of the
international passengers. The number of flights operated by the
giant airport on an average is 420 per day with an annual
turnover of approximately 153,300. Auckland Airport is also the
busiest airport of New Zealand and has more than 21 Million
passengerpassengers catered to in 2019. The airport is the hub for the
aircraft Air New Zealand, Virgin Australia and Jetstar Airways. (Auckland
International Airport Ltd, 2020)
https://corporate.aucklandairport.co.nz/corporate-responsibility/
managing-aircraft-noise/understanding-aircraft-noise/auckland-flight-paths
The services provided by Auckland airport encompass the
following:
(a) Flight Information;
(b) Providing parking space for visitors and local cabs;
(c) Shopping and dining;
(d) Clubs;
FINANCIAL MANAGEMENT PLAN
Part A
Auckland International airport is one of the largest
airportairports of New Zealand and Itand It is a service provider,
Thethe company is listed both in the New Zealand Stock Exchange.
Auckland airport is an aviation industry, which is located in the
Ray Emery Drive of Auckland. It handles around 71 per cent of the
international passengers. The number of flights operated by the
giant airport on an average is 420 per day with an annual
turnover of approximately 153,300. Auckland Airport is also the
busiest airport of New Zealand and has more than 21 Million
passengerpassengers catered to in 2019. The airport is the hub for the
aircraft Air New Zealand, Virgin Australia and Jetstar Airways. (Auckland
International Airport Ltd, 2020)
https://corporate.aucklandairport.co.nz/corporate-responsibility/
managing-aircraft-noise/understanding-aircraft-noise/auckland-flight-paths
The services provided by Auckland airport encompass the
following:
(a) Flight Information;
(b) Providing parking space for visitors and local cabs;
(c) Shopping and dining;
(d) Clubs;
Paraphrase This Document
Need a fresh take? Get an instant paraphrase of this document with our AI Paraphraser
4
FINANCIAL MANAGEMENT PLAN
(e) Transportation (Auckland International Airport Ltd. , 2020)
https://www.aucklandairport.co.nz/information/terminal-services-and-
facilities
Part B
In any business organisation, there is an owner who invests fund
in the business of the company with an expectation to earn
sustainable returns over the investment horizon. These people in
the accounts of the company are considered as shareholders or
principal. On the other hand, for a company to operate efficiently,
it needs to be managed by a group of experts with diverse
knowledge and wisdom. These people who are managing the
affairs of the company on behalf of the owners/ principal are
considered as agent.
The relation between these two group are critical for the success
of the organisation and vision of the Auckland International
Airport to be the best in the field and catering to a large group
and section of the commuters. In the concerned case, the needs
of the principal isare to earn a steady return on the investment
made over the investment horizon. On the other hand, the agent
shall be required to manage the affairs of the company in a
manner that take care of both the shareholder and stakeholder.
Principal is shareholder of Auckland airport and the agent is the
board of directors and discuss the relationship.
5
FINANCIAL MANAGEMENT PLAN
The two relevant stakeholders of the company are mentioned
here in below:
1. Government: The interest of the government lies in the
collection of taxes from the Auckland Airport, helps in easy
connectivity of the people round the world, also helps in
attracting tourism and many other benefits.
2. Shareholder: The shareholders can raise question for their
Board and can make comments about the company’s
operation and performance and the main interest lies in the
profit maximisation.
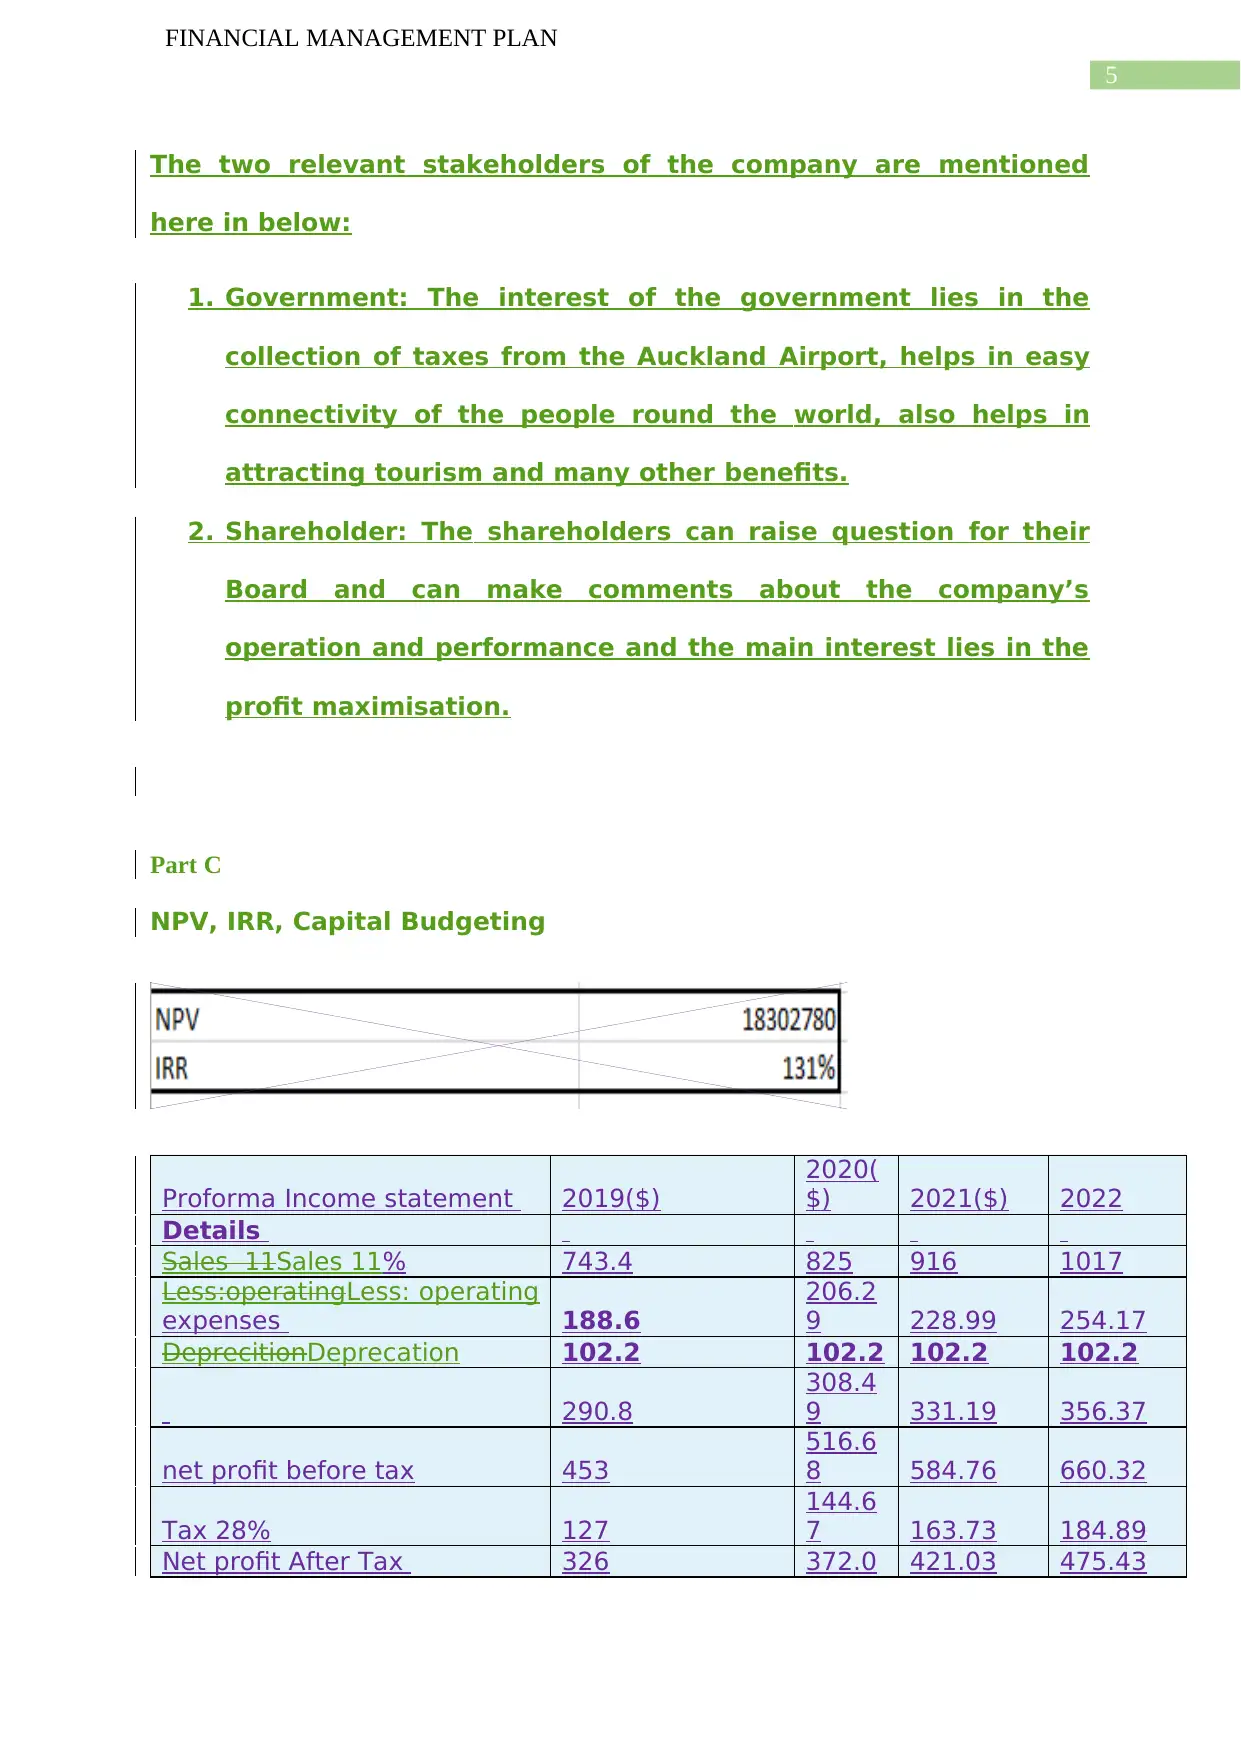
Part C
NPV, IRR, Capital Budgeting
Proforma Income statement 2019($)
2020(
$) 2021($) 2022
Details
Sales 11Sales 11% 743.4 825 916 1017
Less:operatingLess: operating
expenses 188.6
206.2
9 228.99 254.17
DeprecitionDeprecation 102.2 102.2 102.2 102.2
290.8
308.4
9 331.19 356.37
net profit before tax 453
516.6
8 584.76 660.32
Tax 28% 127
144.6
7 163.73 184.89
Net profit After Tax 326 372.0 421.03 475.43
FINANCIAL MANAGEMENT PLAN
The two relevant stakeholders of the company are mentioned
here in below:
1. Government: The interest of the government lies in the
collection of taxes from the Auckland Airport, helps in easy
connectivity of the people round the world, also helps in
attracting tourism and many other benefits.
2. Shareholder: The shareholders can raise question for their
Board and can make comments about the company’s
operation and performance and the main interest lies in the
profit maximisation.
Part C
NPV, IRR, Capital Budgeting
Proforma Income statement 2019($)
2020(
$) 2021($) 2022
Details
Sales 11Sales 11% 743.4 825 916 1017
Less:operatingLess: operating
expenses 188.6
206.2
9 228.99 254.17
DeprecitionDeprecation 102.2 102.2 102.2 102.2
290.8
308.4
9 331.19 356.37
net profit before tax 453
516.6
8 584.76 660.32
Tax 28% 127
144.6
7 163.73 184.89
Net profit After Tax 326 372.0 421.03 475.43
⊘ This is a preview!⊘
Do you want full access?
Subscribe today to unlock all pages.
Trusted by 1+ million students worldwide
6
FINANCIAL MANAGEMENT PLAN
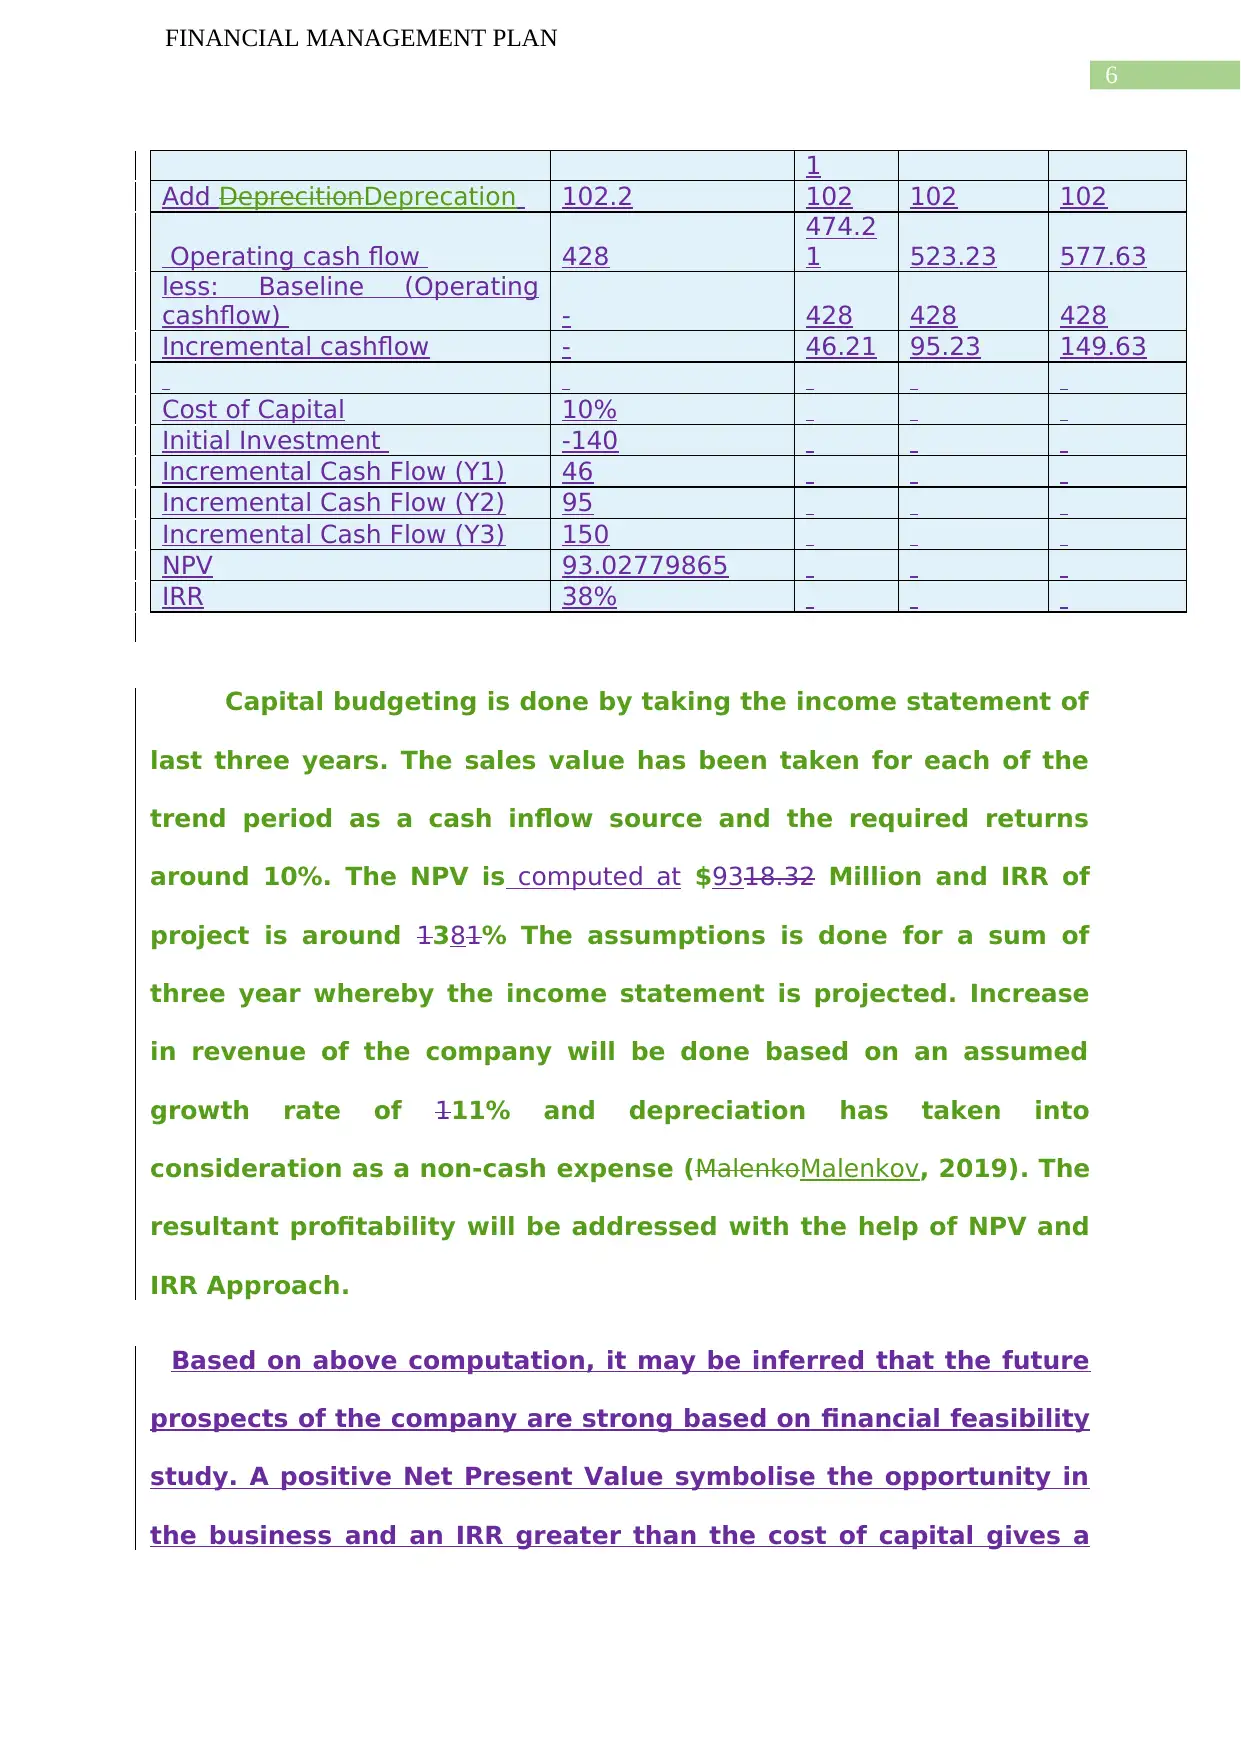
1
Add DeprecitionDeprecation 102.2 102 102 102
Operating cash flow 428
474.2
1 523.23 577.63
less: Baseline (Operating
cashflow) - 428 428 428
Incremental cashflow - 46.21 95.23 149.63
Cost of Capital 10%
Initial Investment -140
Incremental Cash Flow (Y1) 46
Incremental Cash Flow (Y2) 95
Incremental Cash Flow (Y3) 150
NPV 93.02779865
IRR 38%
Capital budgeting is done by taking the income statement of
last three years. The sales value has been taken for each of the
trend period as a cash inflow source and the required returns
around 10%. The NPV is computed at $9318.32 Million and IRR of
project is around 1381% The assumptions is done for a sum of
three year whereby the income statement is projected. Increase
in revenue of the company will be done based on an assumed
growth rate of 111% and depreciation has taken into
consideration as a non-cash expense (MalenkoMalenkov, 2019). The
resultant profitability will be addressed with the help of NPV and
IRR Approach.
Based on above computation, it may be inferred that the future
prospects of the company are strong based on financial feasibility
study. A positive Net Present Value symbolise the opportunity in
the business and an IRR greater than the cost of capital gives a
FINANCIAL MANAGEMENT PLAN
1
Add DeprecitionDeprecation 102.2 102 102 102
Operating cash flow 428
474.2
1 523.23 577.63
less: Baseline (Operating
cashflow) - 428 428 428
Incremental cashflow - 46.21 95.23 149.63
Cost of Capital 10%
Initial Investment -140
Incremental Cash Flow (Y1) 46
Incremental Cash Flow (Y2) 95
Incremental Cash Flow (Y3) 150
NPV 93.02779865
IRR 38%
Capital budgeting is done by taking the income statement of
last three years. The sales value has been taken for each of the
trend period as a cash inflow source and the required returns
around 10%. The NPV is computed at $9318.32 Million and IRR of
project is around 1381% The assumptions is done for a sum of
three year whereby the income statement is projected. Increase
in revenue of the company will be done based on an assumed
growth rate of 111% and depreciation has taken into
consideration as a non-cash expense (MalenkoMalenkov, 2019). The
resultant profitability will be addressed with the help of NPV and
IRR Approach.
Based on above computation, it may be inferred that the future
prospects of the company are strong based on financial feasibility
study. A positive Net Present Value symbolise the opportunity in
the business and an IRR greater than the cost of capital gives a
Paraphrase This Document
Need a fresh take? Get an instant paraphrase of this document with our AI Paraphraser
7
FINANCIAL MANAGEMENT PLAN
green signal to further investment in the project. In the current
case, since the IRR and NPV of the project are good, investment
in Auckland International Airport from an investor point of view is
a good opportunity.
Suggestion: Based on above deliberation it may be inferred that
investment in Auckland International Airport is a feasible option
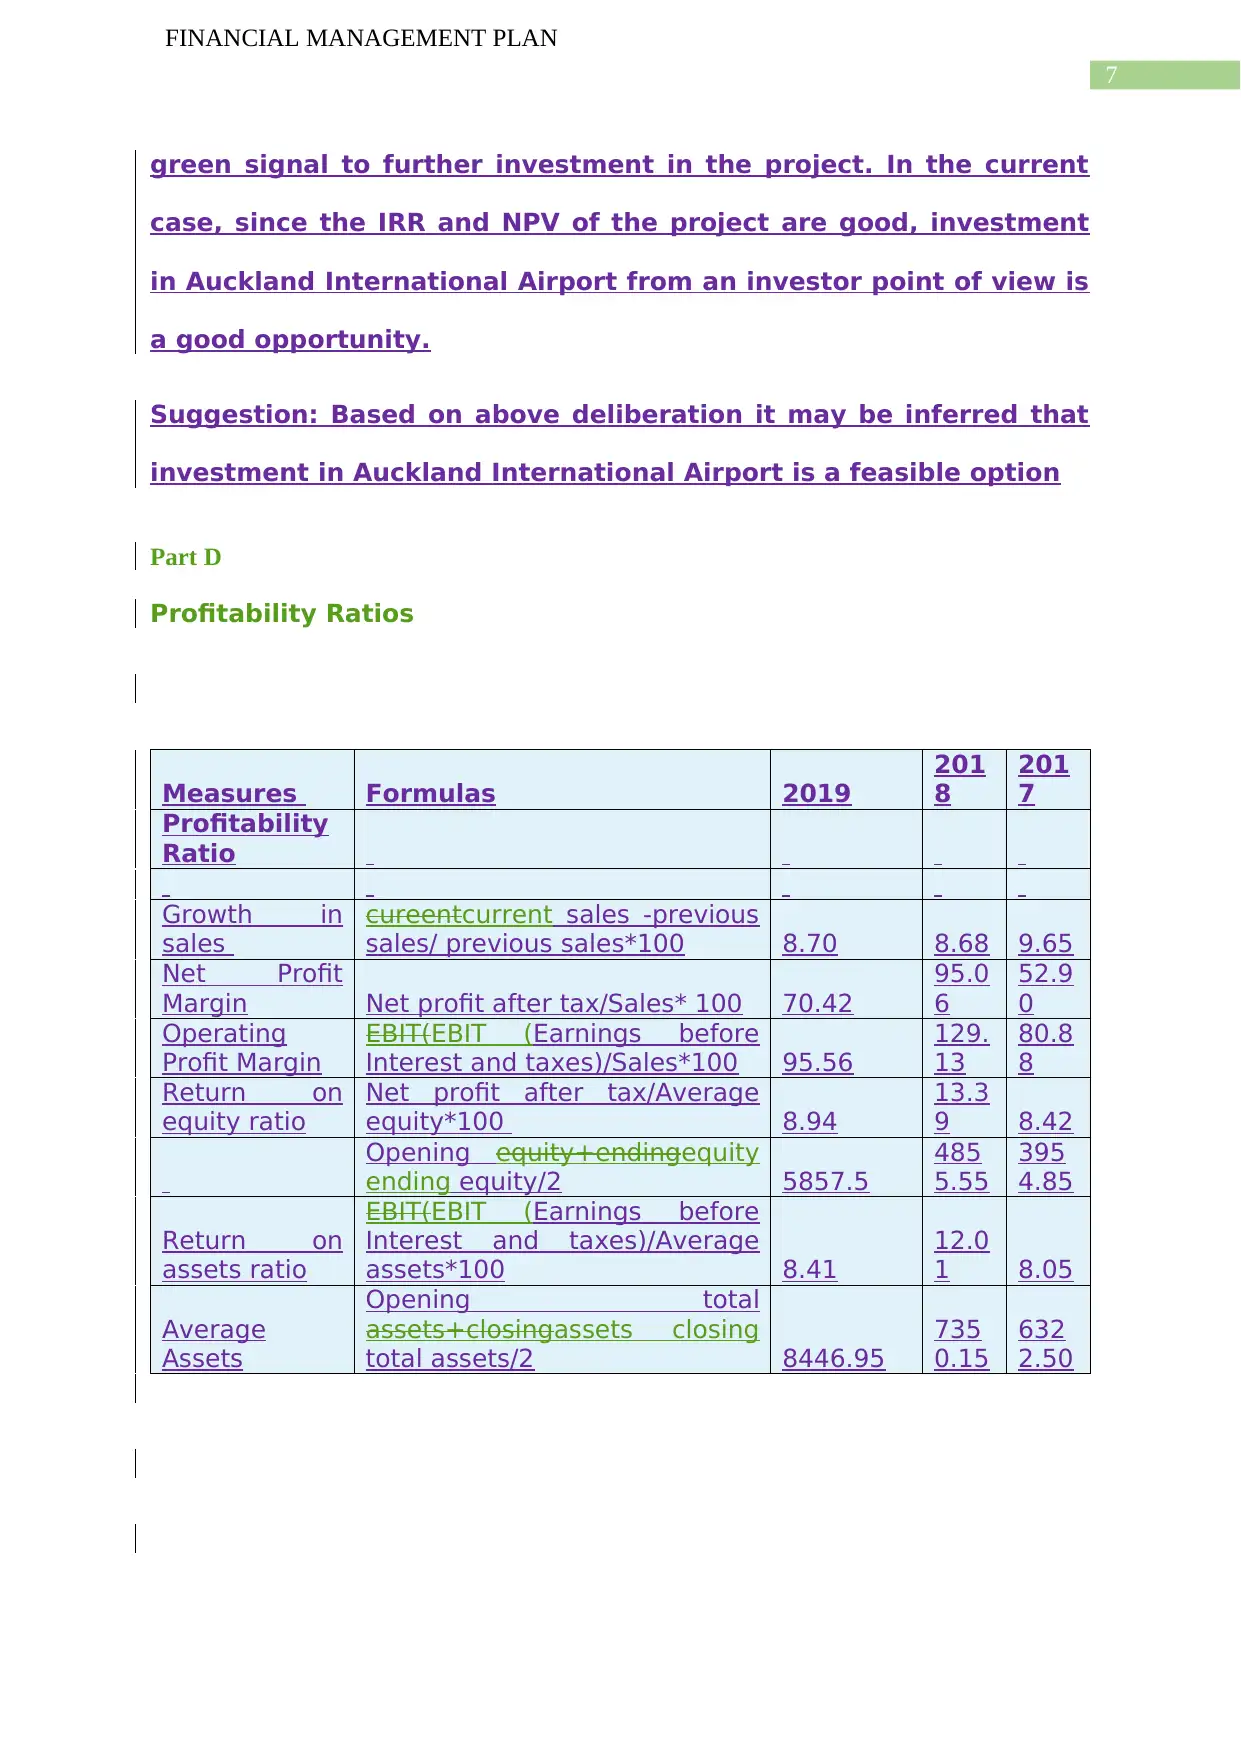
Part D
Profitability Ratios
Measures Formulas 2019
201
8
201
7
Profitability
Ratio
Growth in
sales
cureentcurrent sales -previous
sales/ previous sales*100 8.70 8.68 9.65
Net Profit
Margin Net profit after tax/Sales* 100 70.42
95.0
6
52.9
0
Operating
Profit Margin
EBIT(EBIT (Earnings before
Interest and taxes)/Sales*100 95.56
129.
13
80.8
8
Return on
equity ratio
Net profit after tax/Average
equity*100 8.94
13.3
9 8.42
Opening equity+endingequity
ending equity/2 5857.5
485
5.55
395
4.85
Return on
assets ratio
EBIT(EBIT (Earnings before
Interest and taxes)/Average
assets*100 8.41
12.0
1 8.05
Average
Assets
Opening total
assets+closingassets closing
total assets/2 8446.95
735
0.15
632
2.50
FINANCIAL MANAGEMENT PLAN
green signal to further investment in the project. In the current
case, since the IRR and NPV of the project are good, investment
in Auckland International Airport from an investor point of view is
a good opportunity.
Suggestion: Based on above deliberation it may be inferred that
investment in Auckland International Airport is a feasible option
Part D
Profitability Ratios
Measures Formulas 2019
201
8
201
7
Profitability
Ratio
Growth in
sales
cureentcurrent sales -previous
sales/ previous sales*100 8.70 8.68 9.65
Net Profit
Margin Net profit after tax/Sales* 100 70.42
95.0
6
52.9
0
Operating
Profit Margin
EBIT(EBIT (Earnings before
Interest and taxes)/Sales*100 95.56
129.
13
80.8
8
Return on
equity ratio
Net profit after tax/Average
equity*100 8.94
13.3
9 8.42
Opening equity+endingequity
ending equity/2 5857.5
485
5.55
395
4.85
Return on
assets ratio
EBIT(EBIT (Earnings before
Interest and taxes)/Average
assets*100 8.41
12.0
1 8.05
Average
Assets
Opening total
assets+closingassets closing
total assets/2 8446.95
735
0.15
632
2.50
8
FINANCIAL MANAGEMENT PLAN
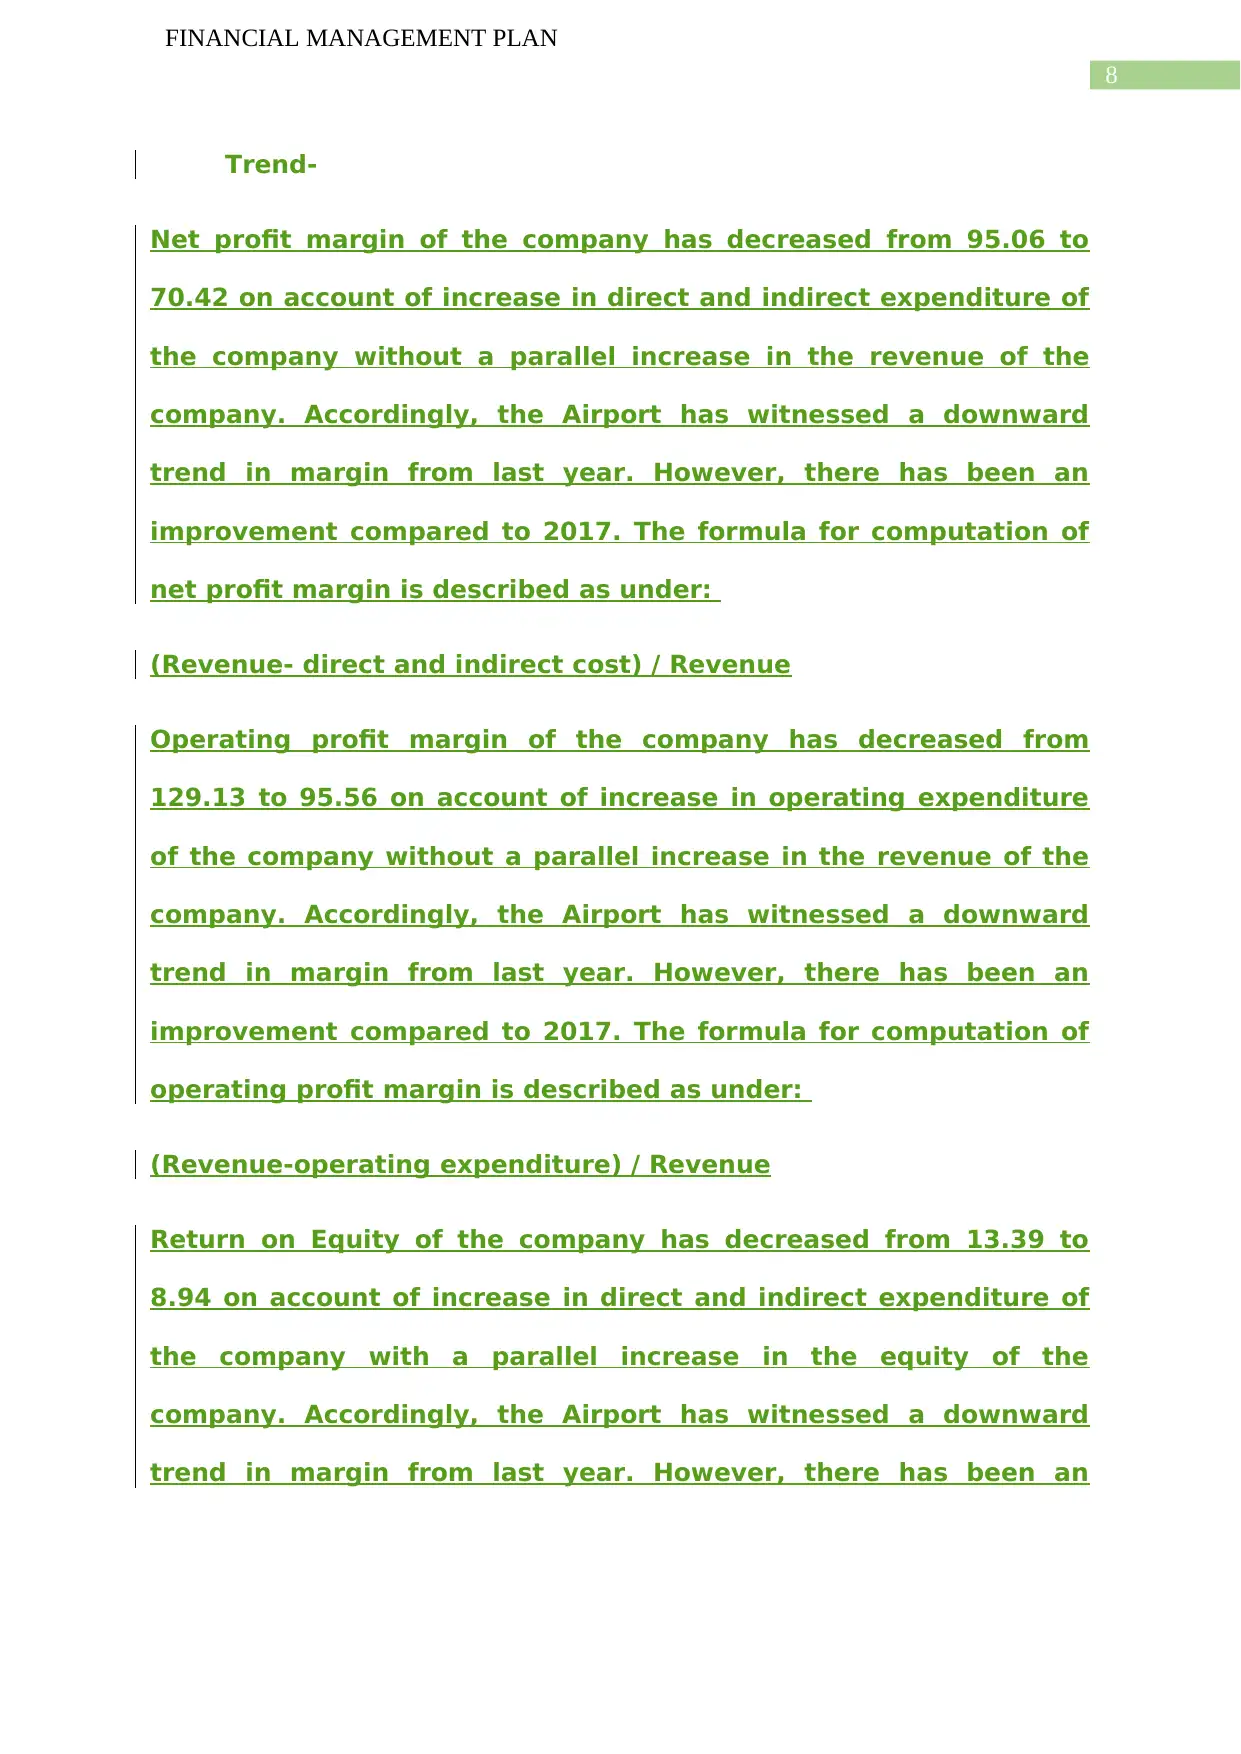
Trend-
Net profit margin of the company has decreased from 95.06 to
70.42 on account of increase in direct and indirect expenditure of
the company without a parallel increase in the revenue of the
company. Accordingly, the Airport has witnessed a downward
trend in margin from last year. However, there has been an
improvement compared to 2017. The formula for computation of
net profit margin is described as under:
(Revenue- direct and indirect cost) / Revenue
Operating profit margin of the company has decreased from
129.13 to 95.56 on account of increase in operating expenditure
of the company without a parallel increase in the revenue of the
company. Accordingly, the Airport has witnessed a downward
trend in margin from last year. However, there has been an
improvement compared to 2017. The formula for computation of
operating profit margin is described as under:
(Revenue-operating expenditure) / Revenue
Return on Equity of the company has decreased from 13.39 to
8.94 on account of increase in direct and indirect expenditure of
the company with a parallel increase in the equity of the
company. Accordingly, the Airport has witnessed a downward
trend in margin from last year. However, there has been an
FINANCIAL MANAGEMENT PLAN
Trend-
Net profit margin of the company has decreased from 95.06 to
70.42 on account of increase in direct and indirect expenditure of
the company without a parallel increase in the revenue of the
company. Accordingly, the Airport has witnessed a downward
trend in margin from last year. However, there has been an
improvement compared to 2017. The formula for computation of
net profit margin is described as under:
(Revenue- direct and indirect cost) / Revenue
Operating profit margin of the company has decreased from
129.13 to 95.56 on account of increase in operating expenditure
of the company without a parallel increase in the revenue of the
company. Accordingly, the Airport has witnessed a downward
trend in margin from last year. However, there has been an
improvement compared to 2017. The formula for computation of
operating profit margin is described as under:
(Revenue-operating expenditure) / Revenue
Return on Equity of the company has decreased from 13.39 to
8.94 on account of increase in direct and indirect expenditure of
the company with a parallel increase in the equity of the
company. Accordingly, the Airport has witnessed a downward
trend in margin from last year. However, there has been an
⊘ This is a preview!⊘
Do you want full access?
Subscribe today to unlock all pages.
Trusted by 1+ million students worldwide
9
FINANCIAL MANAGEMENT PLAN
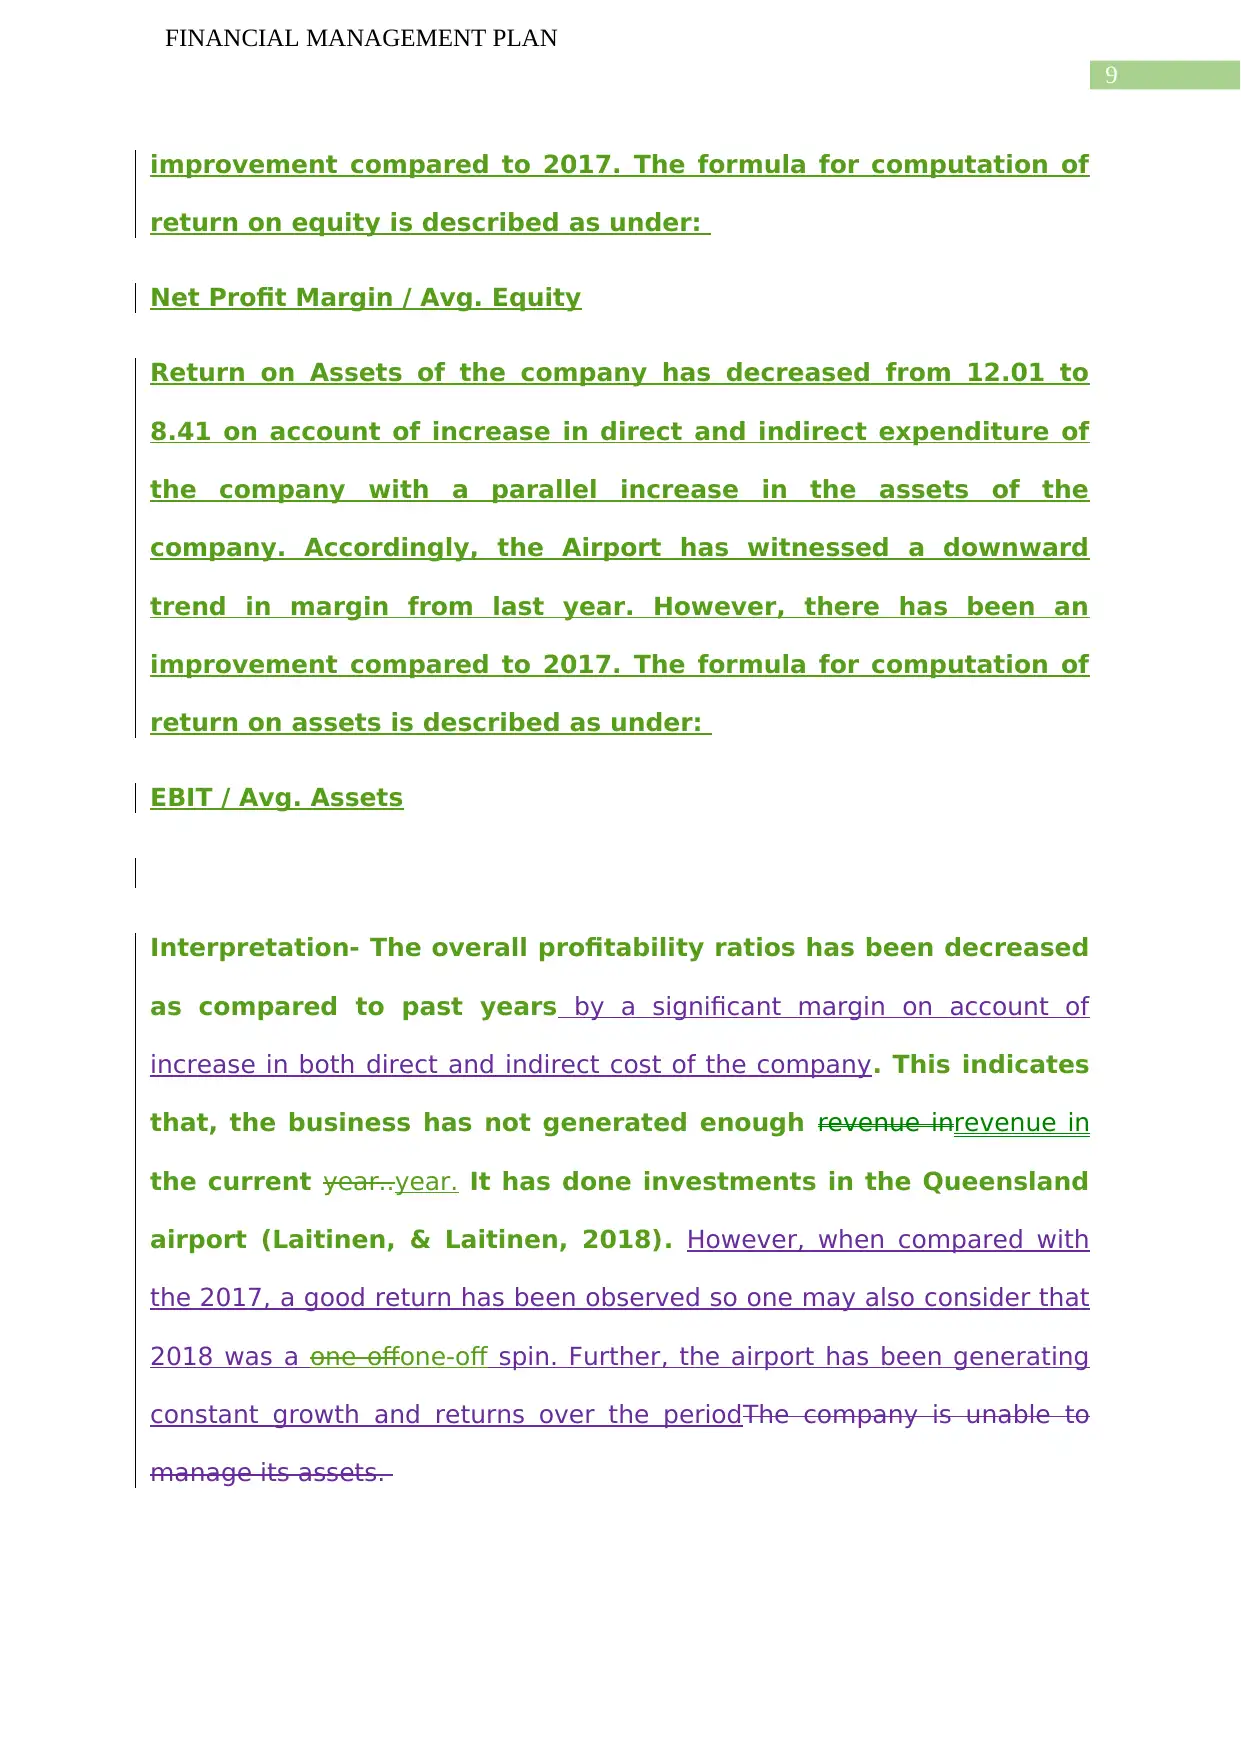
improvement compared to 2017. The formula for computation of
return on equity is described as under:
Net Profit Margin / Avg. Equity
Return on Assets of the company has decreased from 12.01 to
8.41 on account of increase in direct and indirect expenditure of
the company with a parallel increase in the assets of the
company. Accordingly, the Airport has witnessed a downward
trend in margin from last year. However, there has been an
improvement compared to 2017. The formula for computation of
return on assets is described as under:
EBIT / Avg. Assets
Interpretation- The overall profitability ratios has been decreased
as compared to past years by a significant margin on account of
increase in both direct and indirect cost of the company. This indicates
that, the business has not generated enough revenue inrevenue in
the current year..year. It has done investments in the Queensland
airport (Laitinen, & Laitinen, 2018). However, when compared with
the 2017, a good return has been observed so one may also consider that
2018 was a one offone-off spin. Further, the airport has been generating
constant growth and returns over the periodThe company is unable to
manage its assets.
FINANCIAL MANAGEMENT PLAN
improvement compared to 2017. The formula for computation of
return on equity is described as under:
Net Profit Margin / Avg. Equity
Return on Assets of the company has decreased from 12.01 to
8.41 on account of increase in direct and indirect expenditure of
the company with a parallel increase in the assets of the
company. Accordingly, the Airport has witnessed a downward
trend in margin from last year. However, there has been an
improvement compared to 2017. The formula for computation of
return on assets is described as under:
EBIT / Avg. Assets
Interpretation- The overall profitability ratios has been decreased
as compared to past years by a significant margin on account of
increase in both direct and indirect cost of the company. This indicates
that, the business has not generated enough revenue inrevenue in
the current year..year. It has done investments in the Queensland
airport (Laitinen, & Laitinen, 2018). However, when compared with
the 2017, a good return has been observed so one may also consider that
2018 was a one offone-off spin. Further, the airport has been generating
constant growth and returns over the periodThe company is unable to
manage its assets.
Paraphrase This Document
Need a fresh take? Get an instant paraphrase of this document with our AI Paraphraser
10
FINANCIAL MANAGEMENT PLAN
Suggestions- Auckland International airport should continue
doing investments for increasing the business profitability and
properly manage their assets.
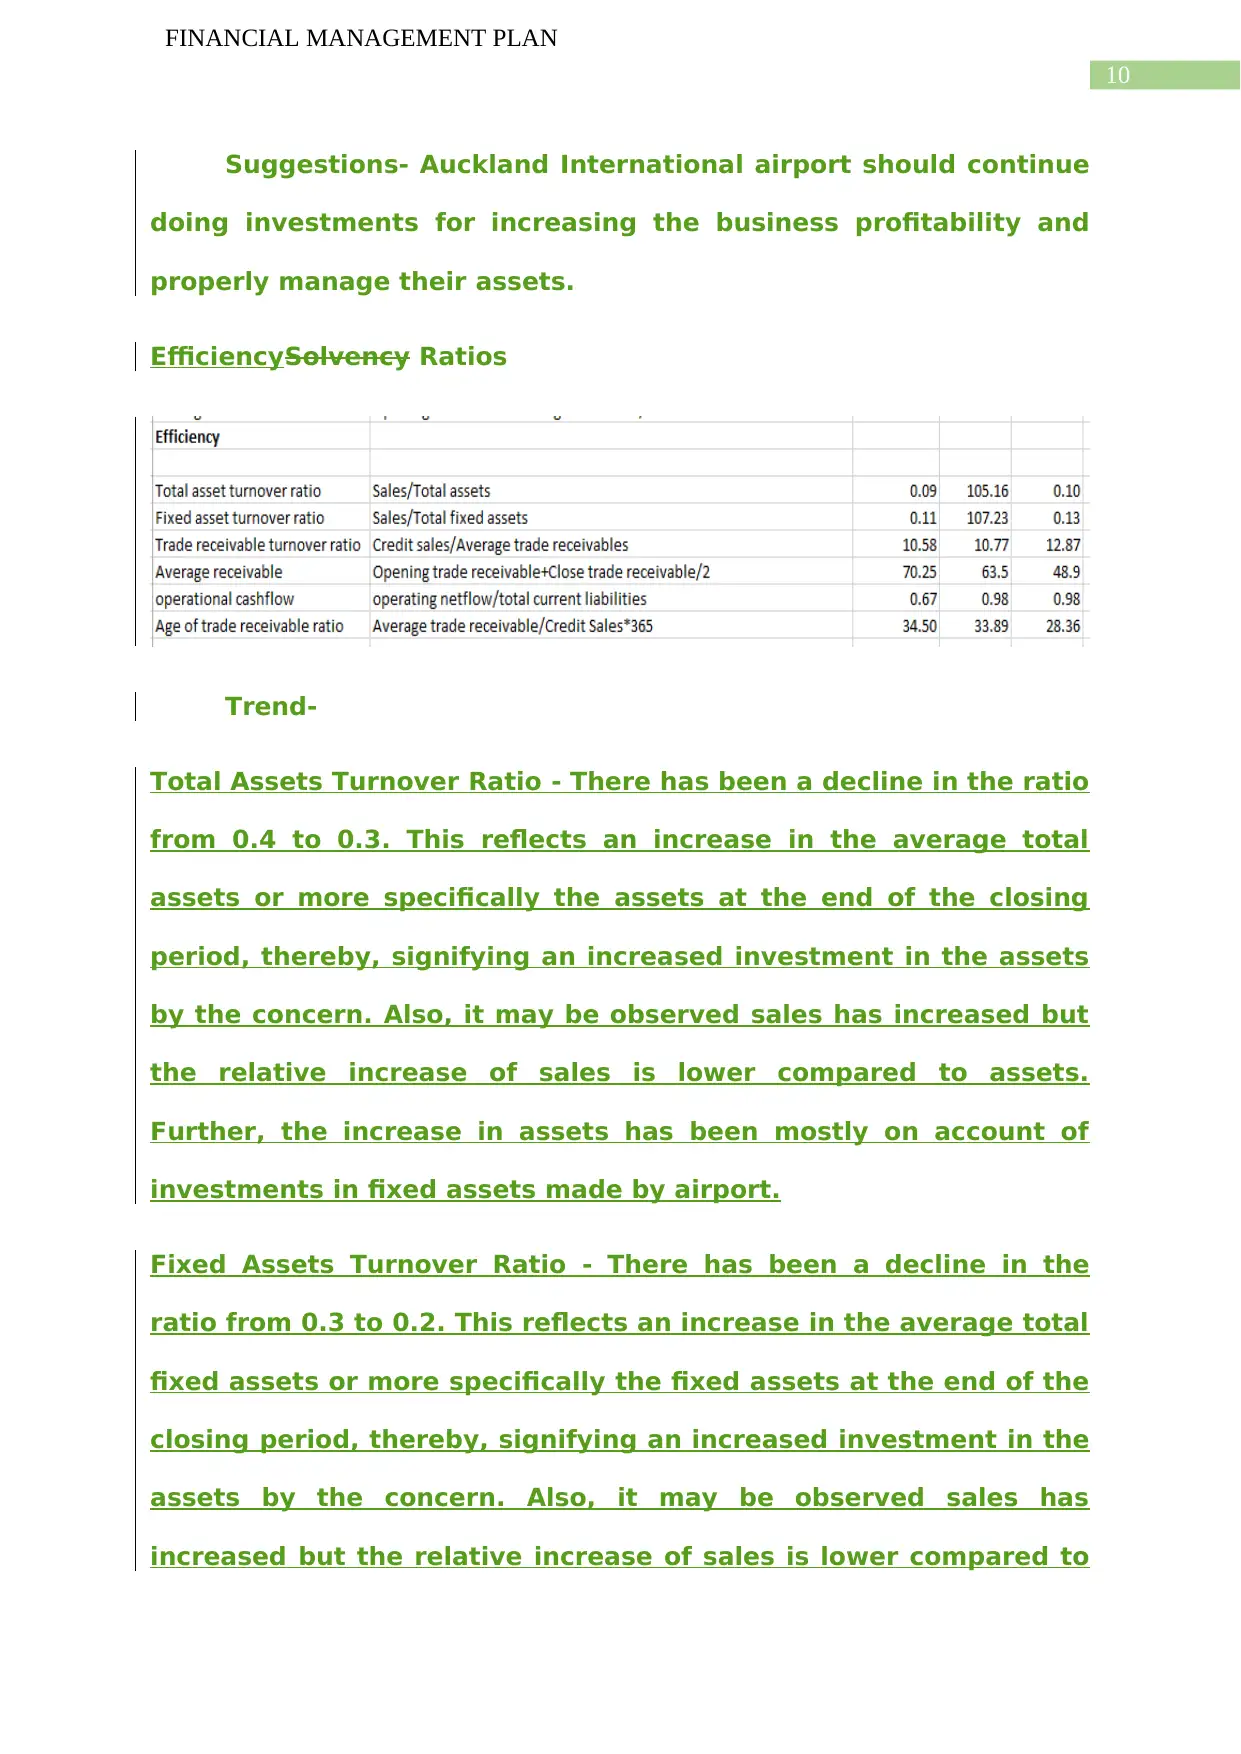
EfficiencySolvency Ratios
Trend-
Total Assets Turnover Ratio - There has been a decline in the ratio
from 0.4 to 0.3. This reflects an increase in the average total
assets or more specifically the assets at the end of the closing
period, thereby, signifying an increased investment in the assets
by the concern. Also, it may be observed sales has increased but
the relative increase of sales is lower compared to assets.
Further, the increase in assets has been mostly on account of
investments in fixed assets made by airport.
Fixed Assets Turnover Ratio - There has been a decline in the
ratio from 0.3 to 0.2. This reflects an increase in the average total
fixed assets or more specifically the fixed assets at the end of the
closing period, thereby, signifying an increased investment in the
assets by the concern. Also, it may be observed sales has
increased but the relative increase of sales is lower compared to
FINANCIAL MANAGEMENT PLAN
Suggestions- Auckland International airport should continue
doing investments for increasing the business profitability and
properly manage their assets.
EfficiencySolvency Ratios
Trend-
Total Assets Turnover Ratio - There has been a decline in the ratio
from 0.4 to 0.3. This reflects an increase in the average total
assets or more specifically the assets at the end of the closing
period, thereby, signifying an increased investment in the assets
by the concern. Also, it may be observed sales has increased but
the relative increase of sales is lower compared to assets.
Further, the increase in assets has been mostly on account of
investments in fixed assets made by airport.
Fixed Assets Turnover Ratio - There has been a decline in the
ratio from 0.3 to 0.2. This reflects an increase in the average total
fixed assets or more specifically the fixed assets at the end of the
closing period, thereby, signifying an increased investment in the
assets by the concern. Also, it may be observed sales has
increased but the relative increase of sales is lower compared to
11
FINANCIAL MANAGEMENT PLAN
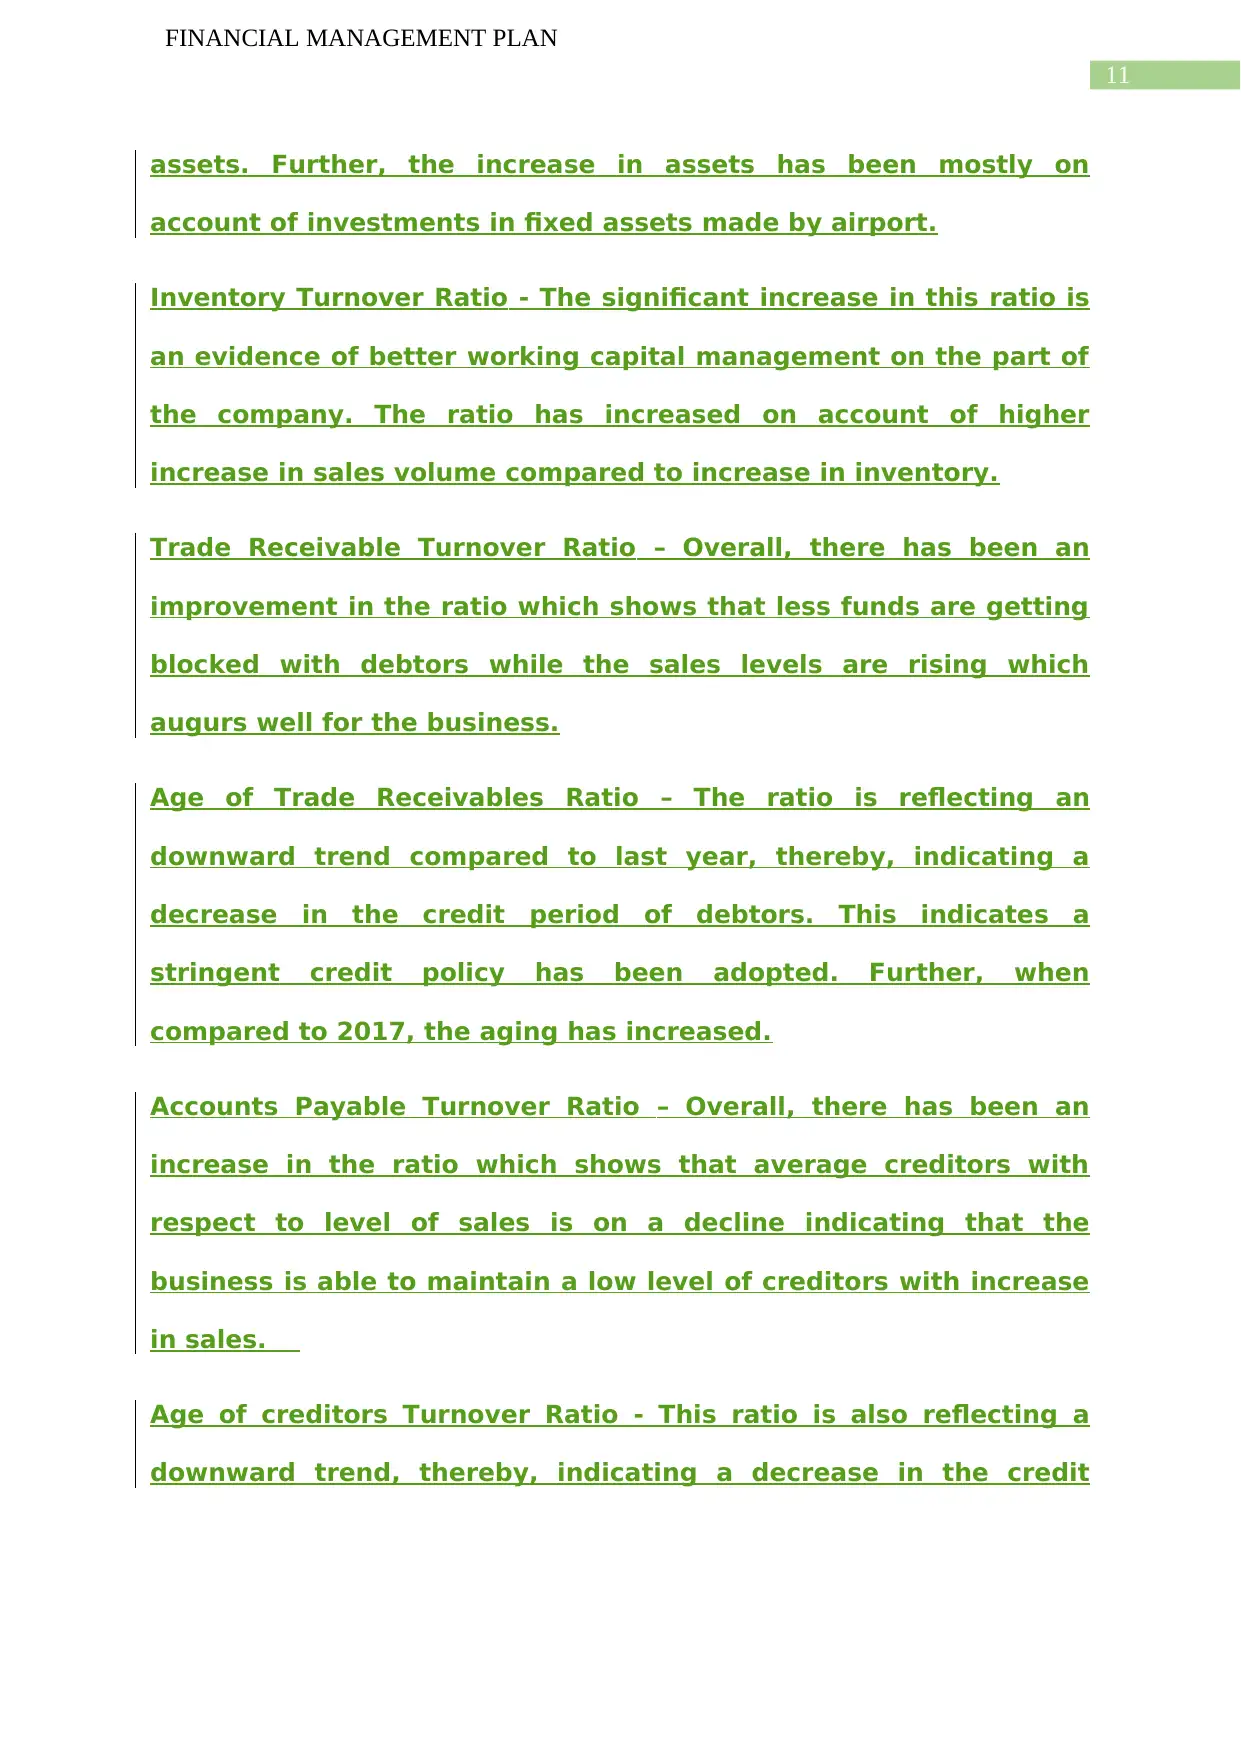
assets. Further, the increase in assets has been mostly on
account of investments in fixed assets made by airport.
Inventory Turnover Ratio - The significant increase in this ratio is
an evidence of better working capital management on the part of
the company. The ratio has increased on account of higher
increase in sales volume compared to increase in inventory.
Trade Receivable Turnover Ratio – Overall, there has been an
improvement in the ratio which shows that less funds are getting
blocked with debtors while the sales levels are rising which
augurs well for the business.
Age of Trade Receivables Ratio – The ratio is reflecting an
downward trend compared to last year, thereby, indicating a
decrease in the credit period of debtors. This indicates a
stringent credit policy has been adopted. Further, when
compared to 2017, the aging has increased.
Accounts Payable Turnover Ratio – Overall, there has been an
increase in the ratio which shows that average creditors with
respect to level of sales is on a decline indicating that the
business is able to maintain a low level of creditors with increase
in sales.
Age of creditors Turnover Ratio - This ratio is also reflecting a
downward trend, thereby, indicating a decrease in the credit
FINANCIAL MANAGEMENT PLAN
assets. Further, the increase in assets has been mostly on
account of investments in fixed assets made by airport.
Inventory Turnover Ratio - The significant increase in this ratio is
an evidence of better working capital management on the part of
the company. The ratio has increased on account of higher
increase in sales volume compared to increase in inventory.
Trade Receivable Turnover Ratio – Overall, there has been an
improvement in the ratio which shows that less funds are getting
blocked with debtors while the sales levels are rising which
augurs well for the business.
Age of Trade Receivables Ratio – The ratio is reflecting an
downward trend compared to last year, thereby, indicating a
decrease in the credit period of debtors. This indicates a
stringent credit policy has been adopted. Further, when
compared to 2017, the aging has increased.
Accounts Payable Turnover Ratio – Overall, there has been an
increase in the ratio which shows that average creditors with
respect to level of sales is on a decline indicating that the
business is able to maintain a low level of creditors with increase
in sales.
Age of creditors Turnover Ratio - This ratio is also reflecting a
downward trend, thereby, indicating a decrease in the credit
⊘ This is a preview!⊘
Do you want full access?
Subscribe today to unlock all pages.
Trusted by 1+ million students worldwide
1 out of 29
Related Documents


Your All-in-One AI-Powered Toolkit for Academic Success.
+13062052269
info@desklib.com
Available 24*7 on WhatsApp / Email
![[object Object]](/_next/static/media/star-bottom.7253800d.svg)
Unlock your academic potential
Copyright © 2020–2026 A2Z Services. All Rights Reserved. Developed and managed by ZUCOL.