Audit, Assurance and Compliance Report
VerifiedAdded on 2020/02/24
|20
|2902
|437
Report
AI Summary
This report delves into the audit, assurance, and compliance processes for Double Ink Printers Limited (DIPL). It includes a thorough analysis of financial ratios such as profitability, liquidity, efficiency, and solvency over three years. The report identifies key risk factors affecting financial reporting and discusses the implications of these risks on audit planning. It emphasizes the importance of analytical procedures in evaluating the financial health of DIPL and highlights the need for proper controls to mitigate risks associated with financial misstatements.
Running head: AUDIT, ASSURANCE AND COMPLIANCE
Audit, Assurance and Compliance
Name of the Student:
Name of the University:
Author Note:
Audit, Assurance and Compliance
Name of the Student:
Name of the University:
Author Note:
Paraphrase This Document
Need a fresh take? Get an instant paraphrase of this document with our AI Paraphraser
2AUDIT, ASSURANCE AND COMPLIANCE
Table of Contents
Question 1........................................................................................................................................2
Part A...............................................................................................................................................2
Explanation of analytical procedures that is important for preparation of financial reports of
DIPL................................................................................................................................................2
Profitability Ratio............................................................................................................................2
Gross Profit Ratio........................................................................................................................2
Net Profit ratio.............................................................................................................................4
Return on assets...........................................................................................................................5
Return on Equity..........................................................................................................................6
Liquidity ratio..................................................................................................................................7
Current ratio.................................................................................................................................7
Quick ratio...................................................................................................................................8
Efficiency ratio................................................................................................................................9
Inventory turnover ratio...............................................................................................................9
Solvency Ratio...............................................................................................................................11
Debt to Equity Ratio..................................................................................................................11
Part B.............................................................................................................................................12
Impact of analytical review on audit planning for the year ending 30th of June 2015...................12
Question 2......................................................................................................................................13
3AUDIT, ASSURANCE AND COMPLIANCE
Classification of inherent risk factors based on nature of business operations of DIPL...............13
Question 3......................................................................................................................................14
Part A.............................................................................................................................................14
Identification of key risk factors that relates to misstatement of financial reporting....................14
Part B.............................................................................................................................................15
Effect of risk factors on audit conduct...........................................................................................15
Reference List................................................................................................................................16
⊘ This is a preview!⊘
Do you want full access?
Subscribe today to unlock all pages.
Trusted by 1+ million students worldwide
4AUDIT, ASSURANCE AND COMPLIANCE
Question 1
Part A
Explanation of analytical procedures that is important for preparation of financial reports
of DIPL
Ratio analysis is the most widespread tools used by companies for analyzing a business
financial standing (William, Glover and Prawitt 2016). This analysis is very easy to understand
and compute that makes it so famous than any other accounting measurement tools. It is used by
large and small companies for comparing their financial information. This ratio does not take
into account the company size or the industry. This analysis is just a raw computation of
financial position as well as performance of any business enterprise irrespective of nature and
size of operations. In similar ways, this study uses ratio analysis measurement tool for predicting
the financial performance of Double Ink Printers Limited. The study had used four broad
categories of ratio analysis such as profitability ratio, liquidity ratio, efficiency ratio and
solvency ratio (Simnett, Carson and Vanstraelen 2016).
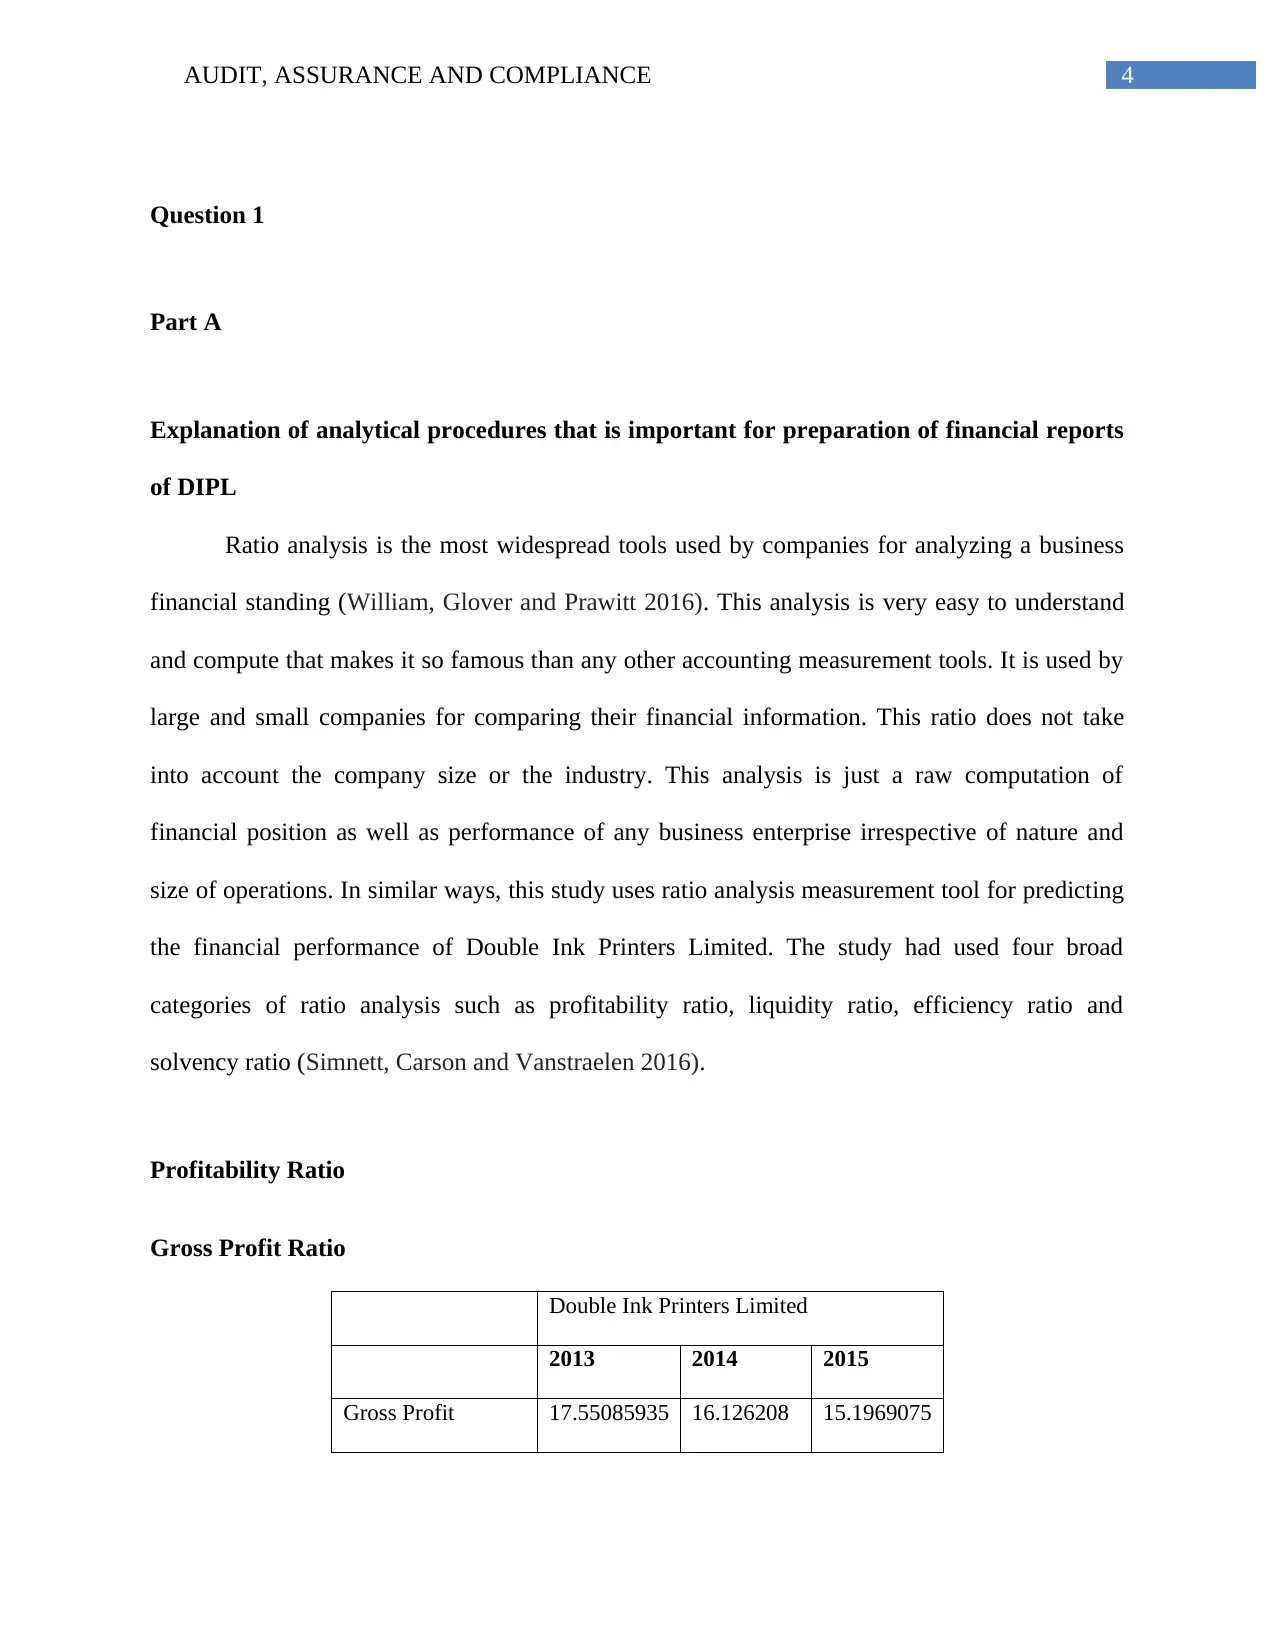
Profitability Ratio
Gross Profit Ratio
Double Ink Printers Limited
2013 2014 2015
Gross Profit 17.55085935 16.126208 15.1969075
Question 1
Part A
Explanation of analytical procedures that is important for preparation of financial reports
of DIPL
Ratio analysis is the most widespread tools used by companies for analyzing a business
financial standing (William, Glover and Prawitt 2016). This analysis is very easy to understand
and compute that makes it so famous than any other accounting measurement tools. It is used by
large and small companies for comparing their financial information. This ratio does not take
into account the company size or the industry. This analysis is just a raw computation of
financial position as well as performance of any business enterprise irrespective of nature and
size of operations. In similar ways, this study uses ratio analysis measurement tool for predicting
the financial performance of Double Ink Printers Limited. The study had used four broad
categories of ratio analysis such as profitability ratio, liquidity ratio, efficiency ratio and
solvency ratio (Simnett, Carson and Vanstraelen 2016).
Profitability Ratio
Gross Profit Ratio
Double Ink Printers Limited
2013 2014 2015
Gross Profit 17.55085935 16.126208 15.1969075
Paraphrase This Document
Need a fresh take? Get an instant paraphrase of this document with our AI Paraphraser
5AUDIT, ASSURANCE AND COMPLIANCE
6
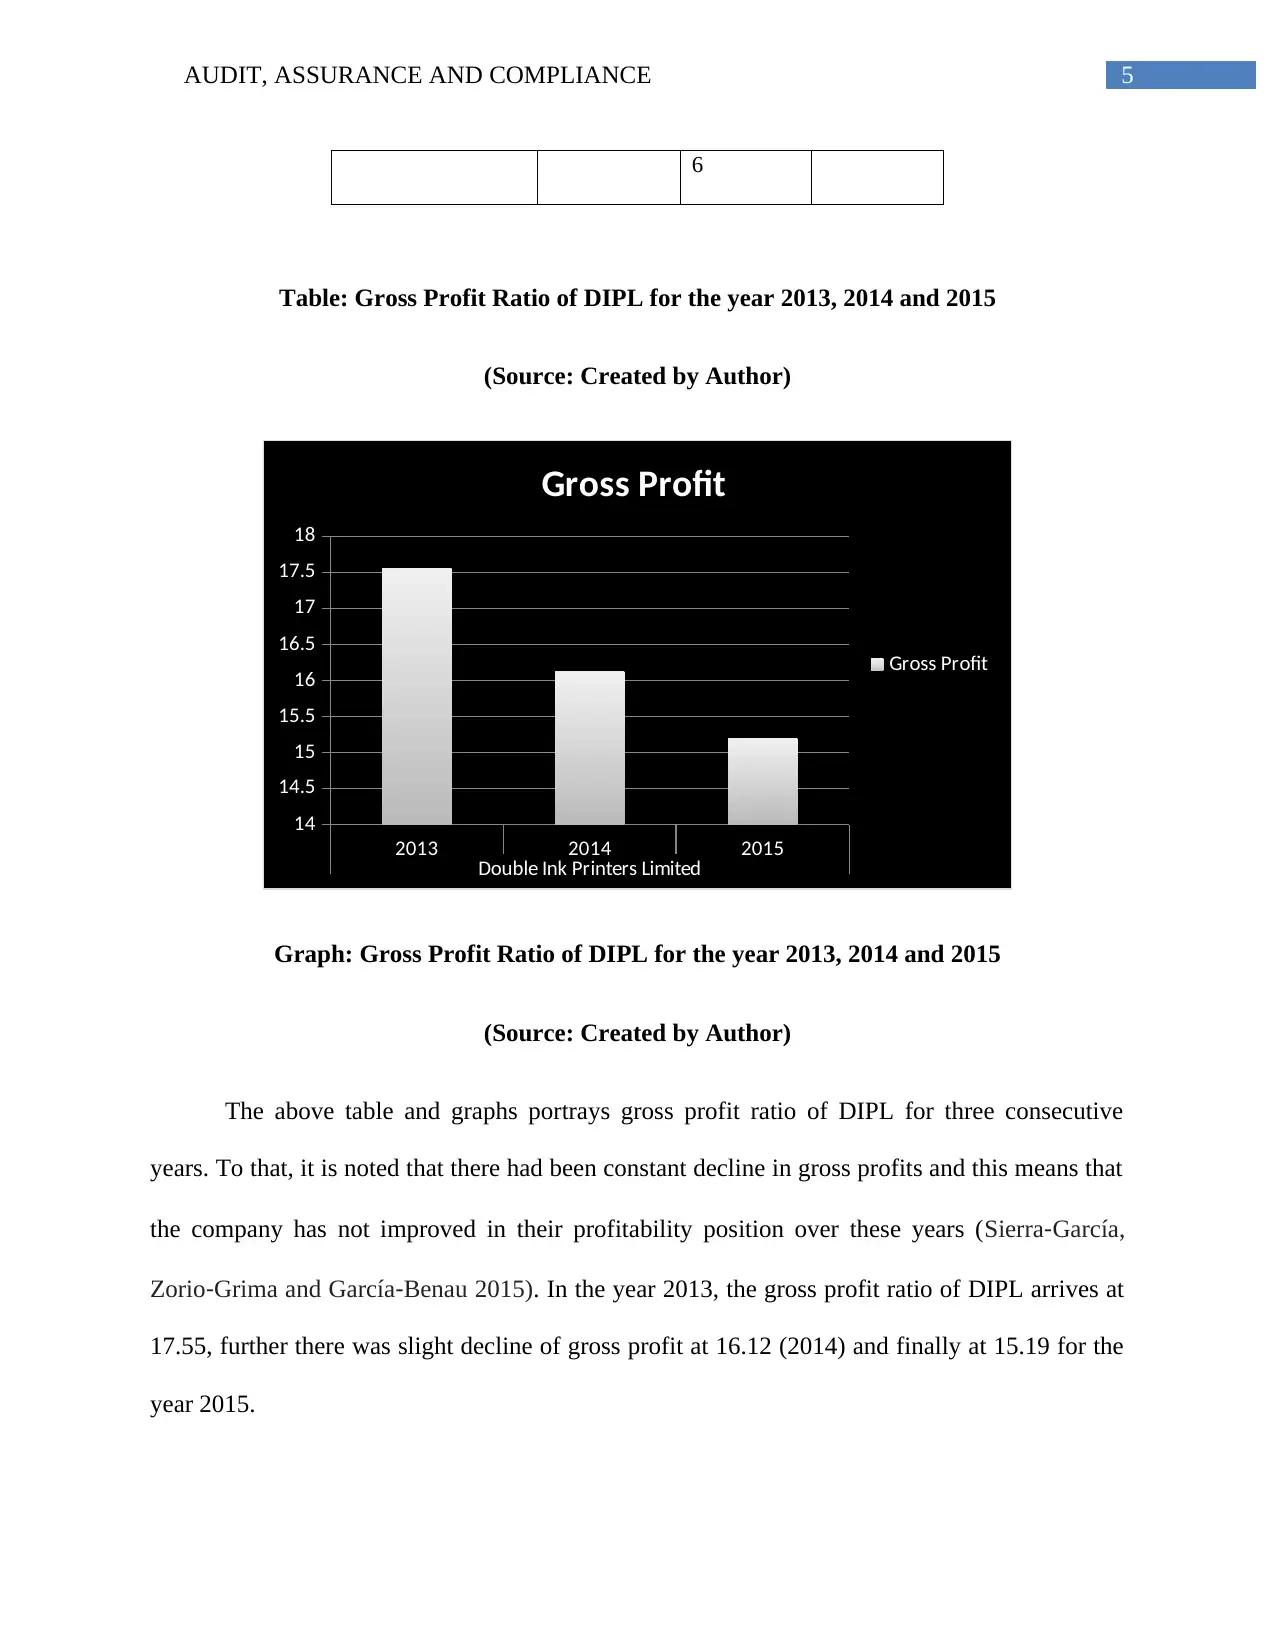
Table: Gross Profit Ratio of DIPL for the year 2013, 2014 and 2015
(Source: Created by Author)
2013 2014 2015
Double Ink Printers Limited
14
14.5
15
15.5
16
16.5
17
17.5
18
Gross Profit
Gross Profit
Graph: Gross Profit Ratio of DIPL for the year 2013, 2014 and 2015
(Source: Created by Author)
The above table and graphs portrays gross profit ratio of DIPL for three consecutive
years. To that, it is noted that there had been constant decline in gross profits and this means that
the company has not improved in their profitability position over these years (Sierra‐García,
Zorio‐Grima and García‐Benau 2015). In the year 2013, the gross profit ratio of DIPL arrives at
17.55, further there was slight decline of gross profit at 16.12 (2014) and finally at 15.19 for the
year 2015.
6
Table: Gross Profit Ratio of DIPL for the year 2013, 2014 and 2015
(Source: Created by Author)
2013 2014 2015
Double Ink Printers Limited
14
14.5
15
15.5
16
16.5
17
17.5
18
Gross Profit
Gross Profit
Graph: Gross Profit Ratio of DIPL for the year 2013, 2014 and 2015
(Source: Created by Author)
The above table and graphs portrays gross profit ratio of DIPL for three consecutive
years. To that, it is noted that there had been constant decline in gross profits and this means that
the company has not improved in their profitability position over these years (Sierra‐García,
Zorio‐Grima and García‐Benau 2015). In the year 2013, the gross profit ratio of DIPL arrives at
17.55, further there was slight decline of gross profit at 16.12 (2014) and finally at 15.19 for the
year 2015.
6AUDIT, ASSURANCE AND COMPLIANCE
Net Profit ratio
Double Ink Printers Limited
2013 2014 2015
Net Profit 6.895796796 6.0779639 6.83897192
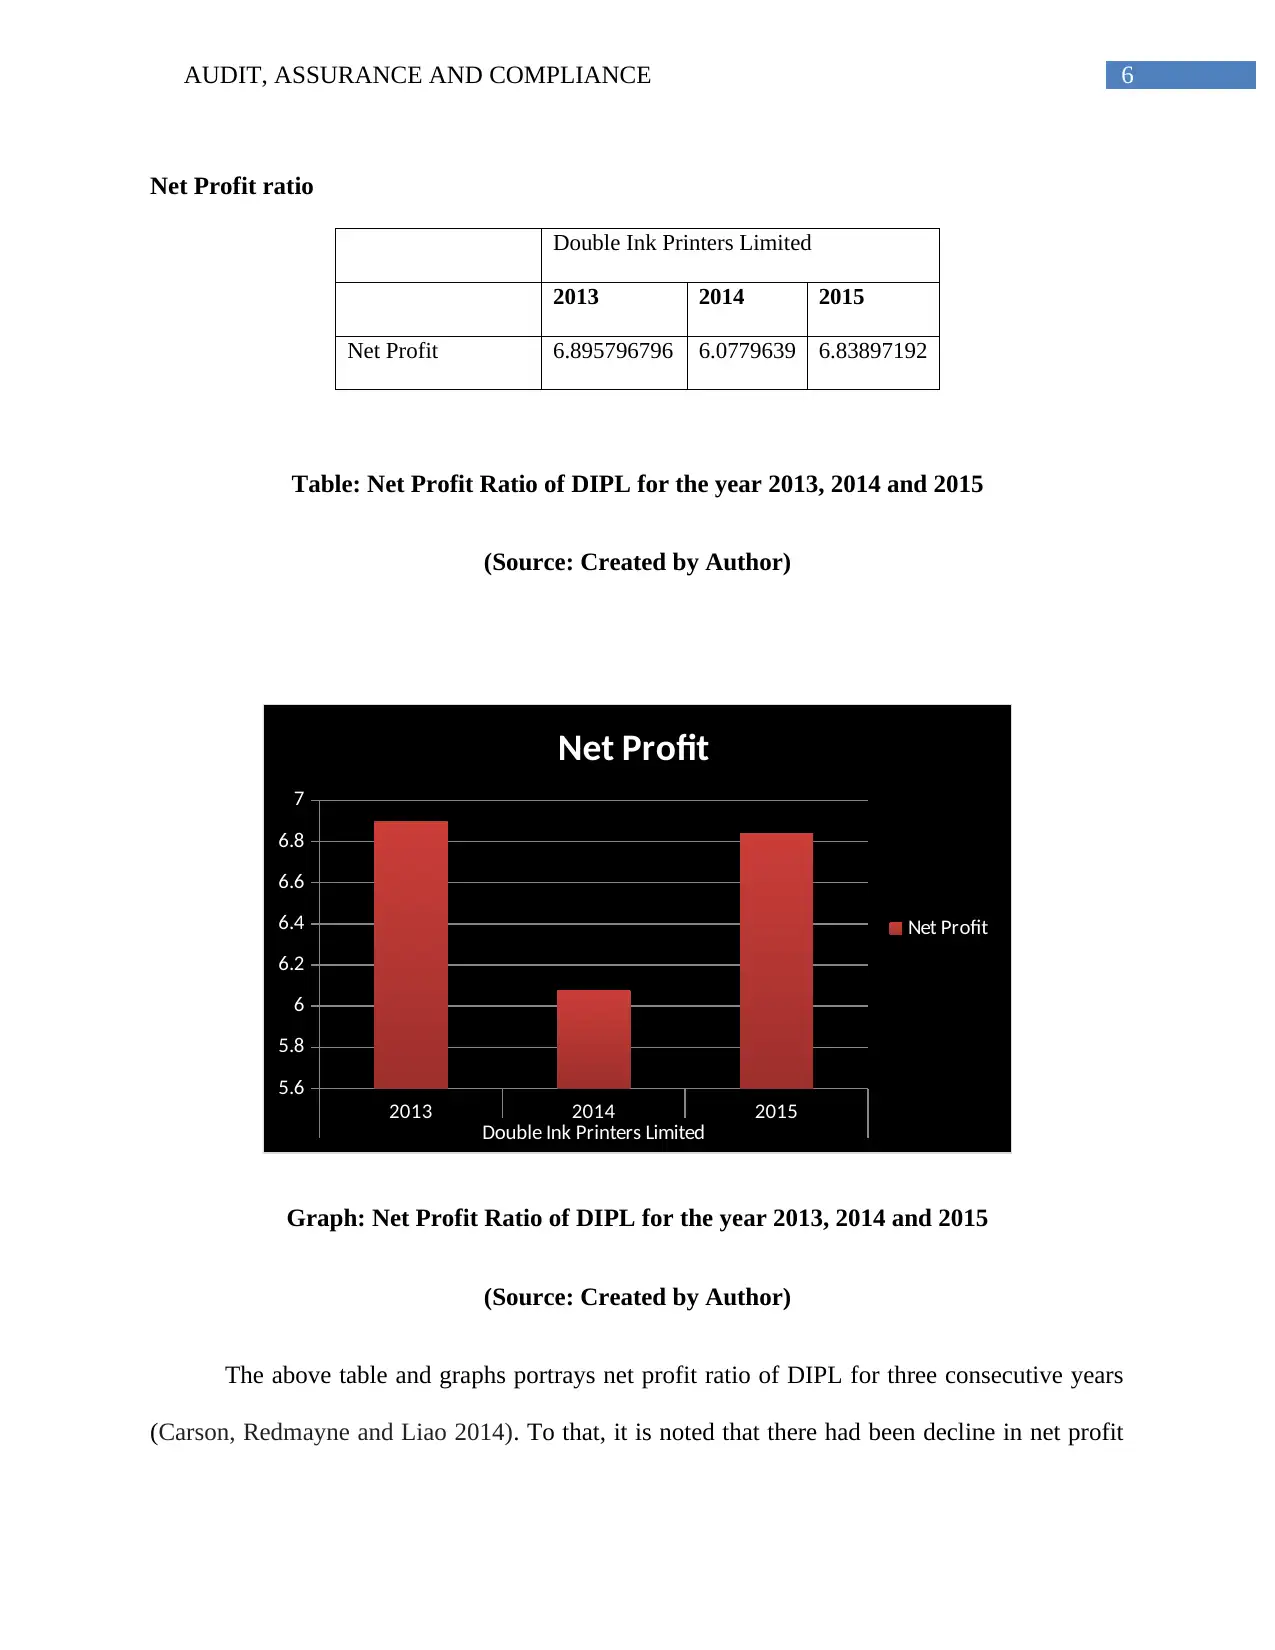
Table: Net Profit Ratio of DIPL for the year 2013, 2014 and 2015
(Source: Created by Author)
2013 2014 2015
Double Ink Printers Limited
5.6
5.8
6
6.2
6.4
6.6
6.8
7
Net Profit
Net Profit
Graph: Net Profit Ratio of DIPL for the year 2013, 2014 and 2015
(Source: Created by Author)
The above table and graphs portrays net profit ratio of DIPL for three consecutive years
(Carson, Redmayne and Liao 2014). To that, it is noted that there had been decline in net profit
Net Profit ratio
Double Ink Printers Limited
2013 2014 2015
Net Profit 6.895796796 6.0779639 6.83897192
Table: Net Profit Ratio of DIPL for the year 2013, 2014 and 2015
(Source: Created by Author)
2013 2014 2015
Double Ink Printers Limited
5.6
5.8
6
6.2
6.4
6.6
6.8
7
Net Profit
Net Profit
Graph: Net Profit Ratio of DIPL for the year 2013, 2014 and 2015
(Source: Created by Author)
The above table and graphs portrays net profit ratio of DIPL for three consecutive years
(Carson, Redmayne and Liao 2014). To that, it is noted that there had been decline in net profit
⊘ This is a preview!⊘
Do you want full access?
Subscribe today to unlock all pages.
Trusted by 1+ million students worldwide
7AUDIT, ASSURANCE AND COMPLIANCE
from 2013 to 2014 and then there was increase in net profit for the year 2015. In the year 2013,
the net profit ratio of DIPL arrives at 6.89, further there was slight decline of net profit at 6.077
(2014) and finally increase at 6.83 for the year 2015.
Return on assets
Double Ink Printers Limited
2013 2014 2015
Return on assets 18.24586234 14.407547
8
11.3667738
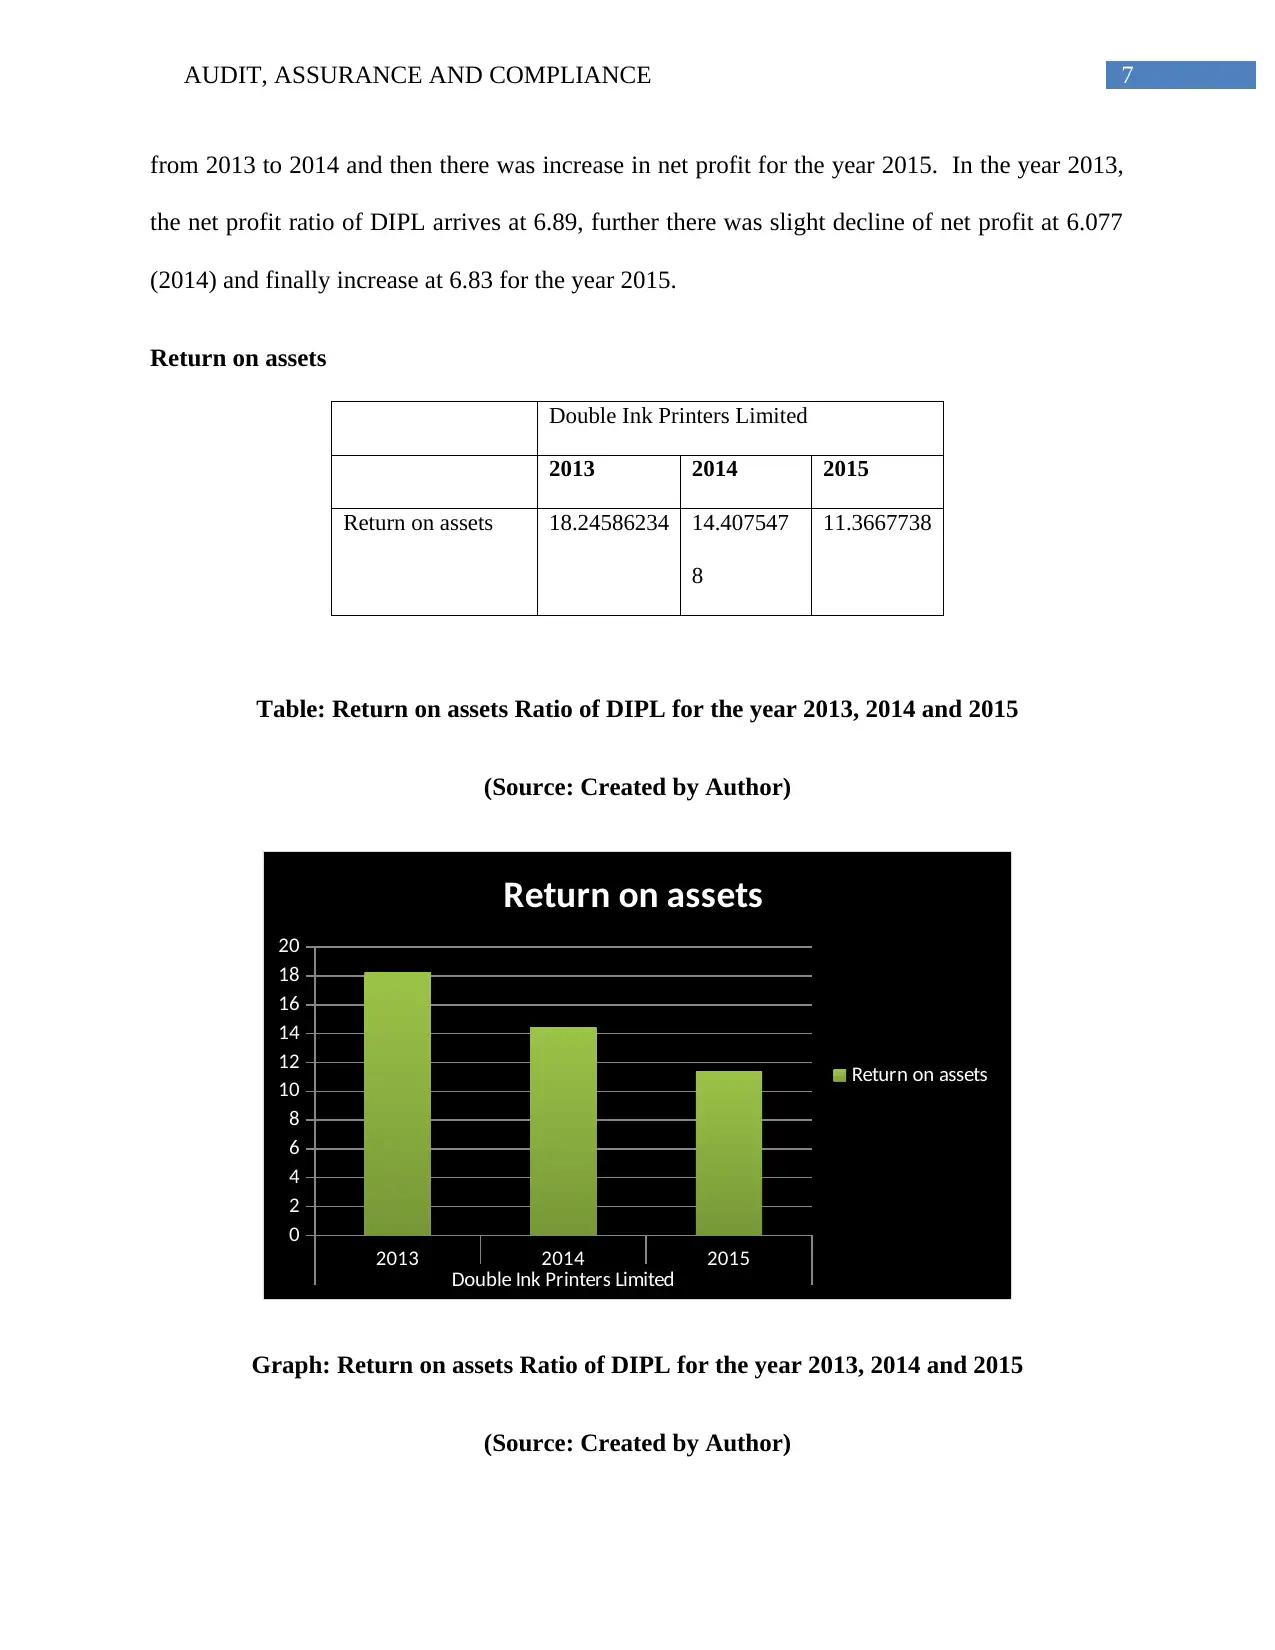
Table: Return on assets Ratio of DIPL for the year 2013, 2014 and 2015
(Source: Created by Author)
2013 2014 2015
Double Ink Printers Limited
0
2
4
6
8
10
12
14
16
18
20
Return on assets
Return on assets
Graph: Return on assets Ratio of DIPL for the year 2013, 2014 and 2015
(Source: Created by Author)
from 2013 to 2014 and then there was increase in net profit for the year 2015. In the year 2013,
the net profit ratio of DIPL arrives at 6.89, further there was slight decline of net profit at 6.077
(2014) and finally increase at 6.83 for the year 2015.
Return on assets
Double Ink Printers Limited
2013 2014 2015
Return on assets 18.24586234 14.407547
8
11.3667738
Table: Return on assets Ratio of DIPL for the year 2013, 2014 and 2015
(Source: Created by Author)
2013 2014 2015
Double Ink Printers Limited
0
2
4
6
8
10
12
14
16
18
20
Return on assets
Return on assets
Graph: Return on assets Ratio of DIPL for the year 2013, 2014 and 2015
(Source: Created by Author)
Paraphrase This Document
Need a fresh take? Get an instant paraphrase of this document with our AI Paraphraser
8AUDIT, ASSURANCE AND COMPLIANCE
The above table and graphs portrays return on assets ratio of DIPL for three consecutive
years. To that, it is noted that there had been constant decline in return on assets and this means
that the company has not improved in their profitability position over these years (Cohen and
Simnett 2014). In the year 2013, the return on assets ratio of DIPL arrives at 18.24, further there
was slight decline of return on assets at 14.40 (2014) and finally at 11.36 for the year 2015.
Return on Equity
Double Ink Printers Limited
2013 2014 2015
Return on Equity 25.78349727 21.248482
7
24.2617459
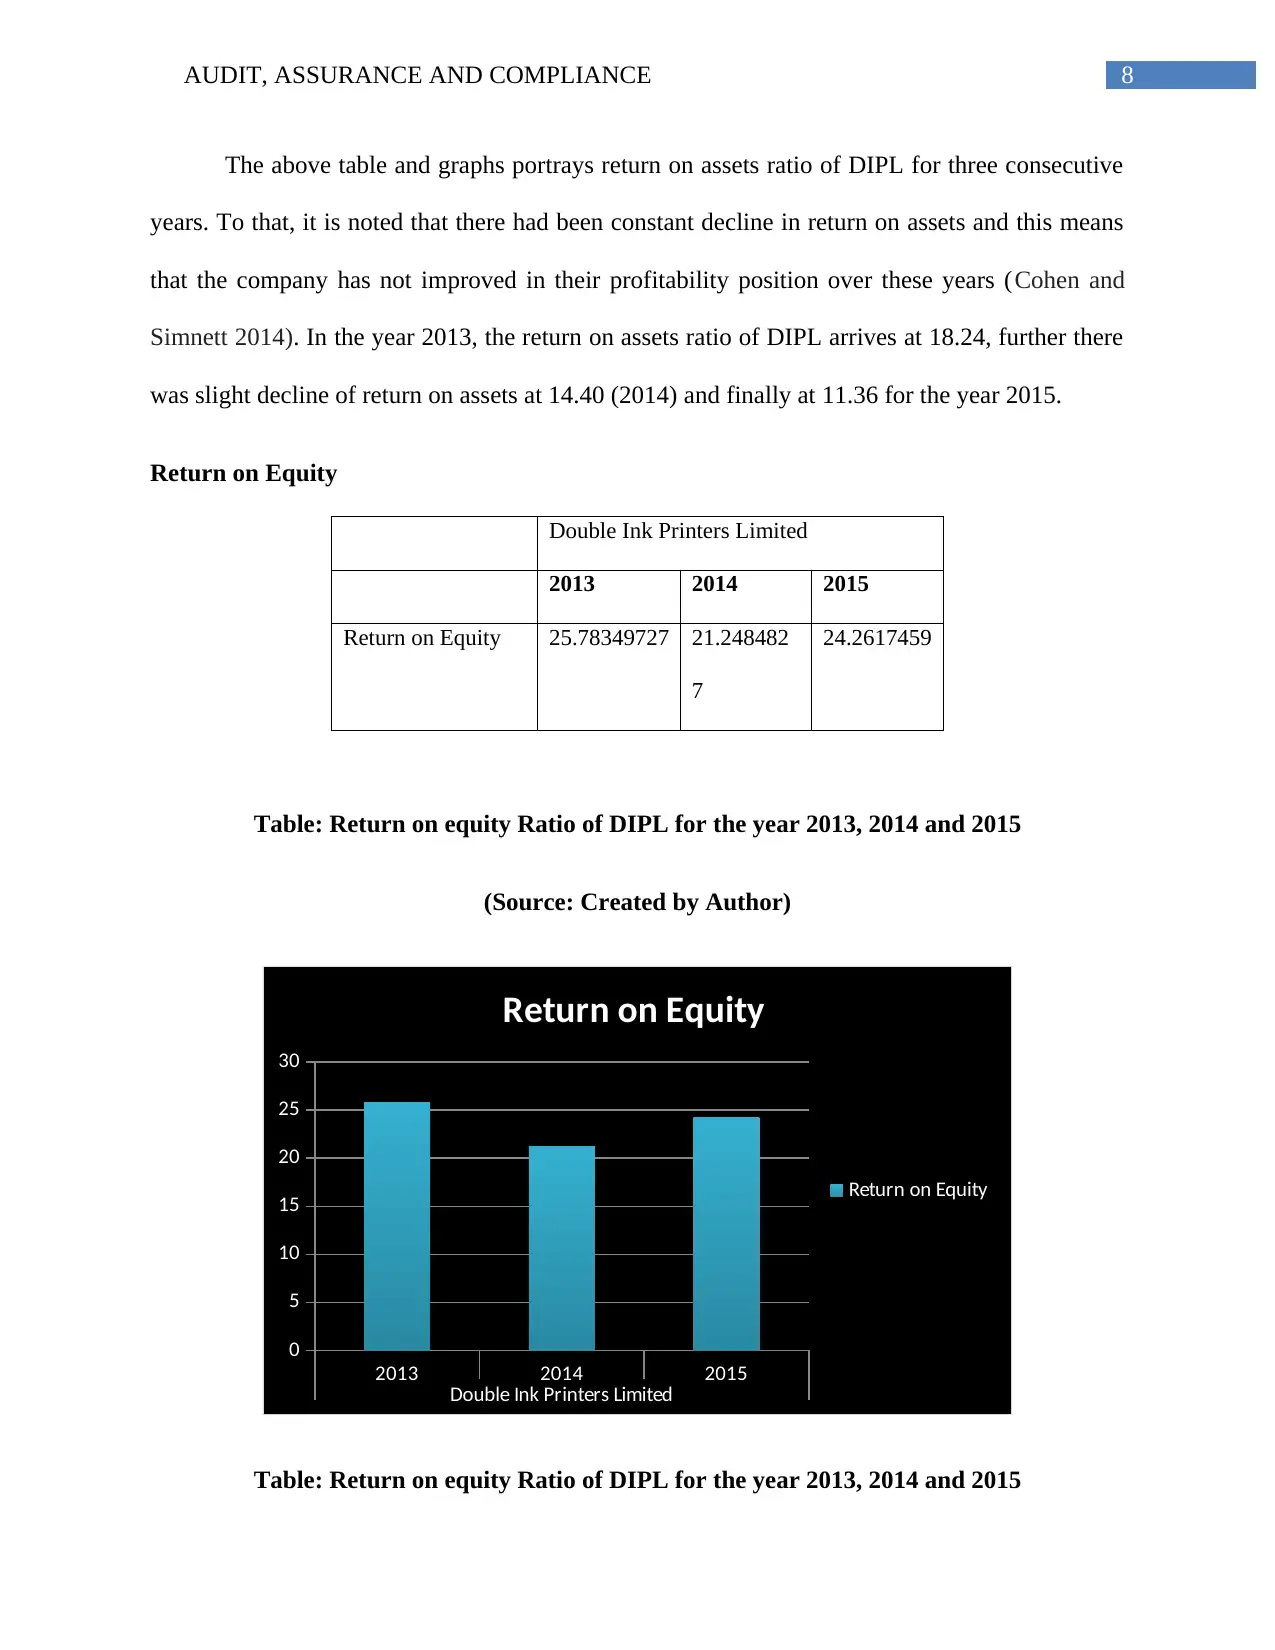
Table: Return on equity Ratio of DIPL for the year 2013, 2014 and 2015
(Source: Created by Author)
2013 2014 2015
Double Ink Printers Limited
0
5
10
15
20
25
30
Return on Equity
Return on Equity
Table: Return on equity Ratio of DIPL for the year 2013, 2014 and 2015
The above table and graphs portrays return on assets ratio of DIPL for three consecutive
years. To that, it is noted that there had been constant decline in return on assets and this means
that the company has not improved in their profitability position over these years (Cohen and
Simnett 2014). In the year 2013, the return on assets ratio of DIPL arrives at 18.24, further there
was slight decline of return on assets at 14.40 (2014) and finally at 11.36 for the year 2015.
Return on Equity
Double Ink Printers Limited
2013 2014 2015
Return on Equity 25.78349727 21.248482
7
24.2617459
Table: Return on equity Ratio of DIPL for the year 2013, 2014 and 2015
(Source: Created by Author)
2013 2014 2015
Double Ink Printers Limited
0
5
10
15
20
25
30
Return on Equity
Return on Equity
Table: Return on equity Ratio of DIPL for the year 2013, 2014 and 2015
9AUDIT, ASSURANCE AND COMPLIANCE
(Source: Created by Author)
The above table and graphs portrays return on equity ratio of DIPL for three consecutive
years. To that, it is noted that there had been decline in return on equity for the year 2013 and
2014 and then increase in return on equity for the year 2015. In the year 2013, the return on
equity ratio of DIPL arrives at 25.78, further there was slight decline of return on equity at 21.24
(2014) and finally at 24.26 for the year 2015.
Liquidity ratio
Current ratio
Double Ink Printers Limited
2013 2014 2015
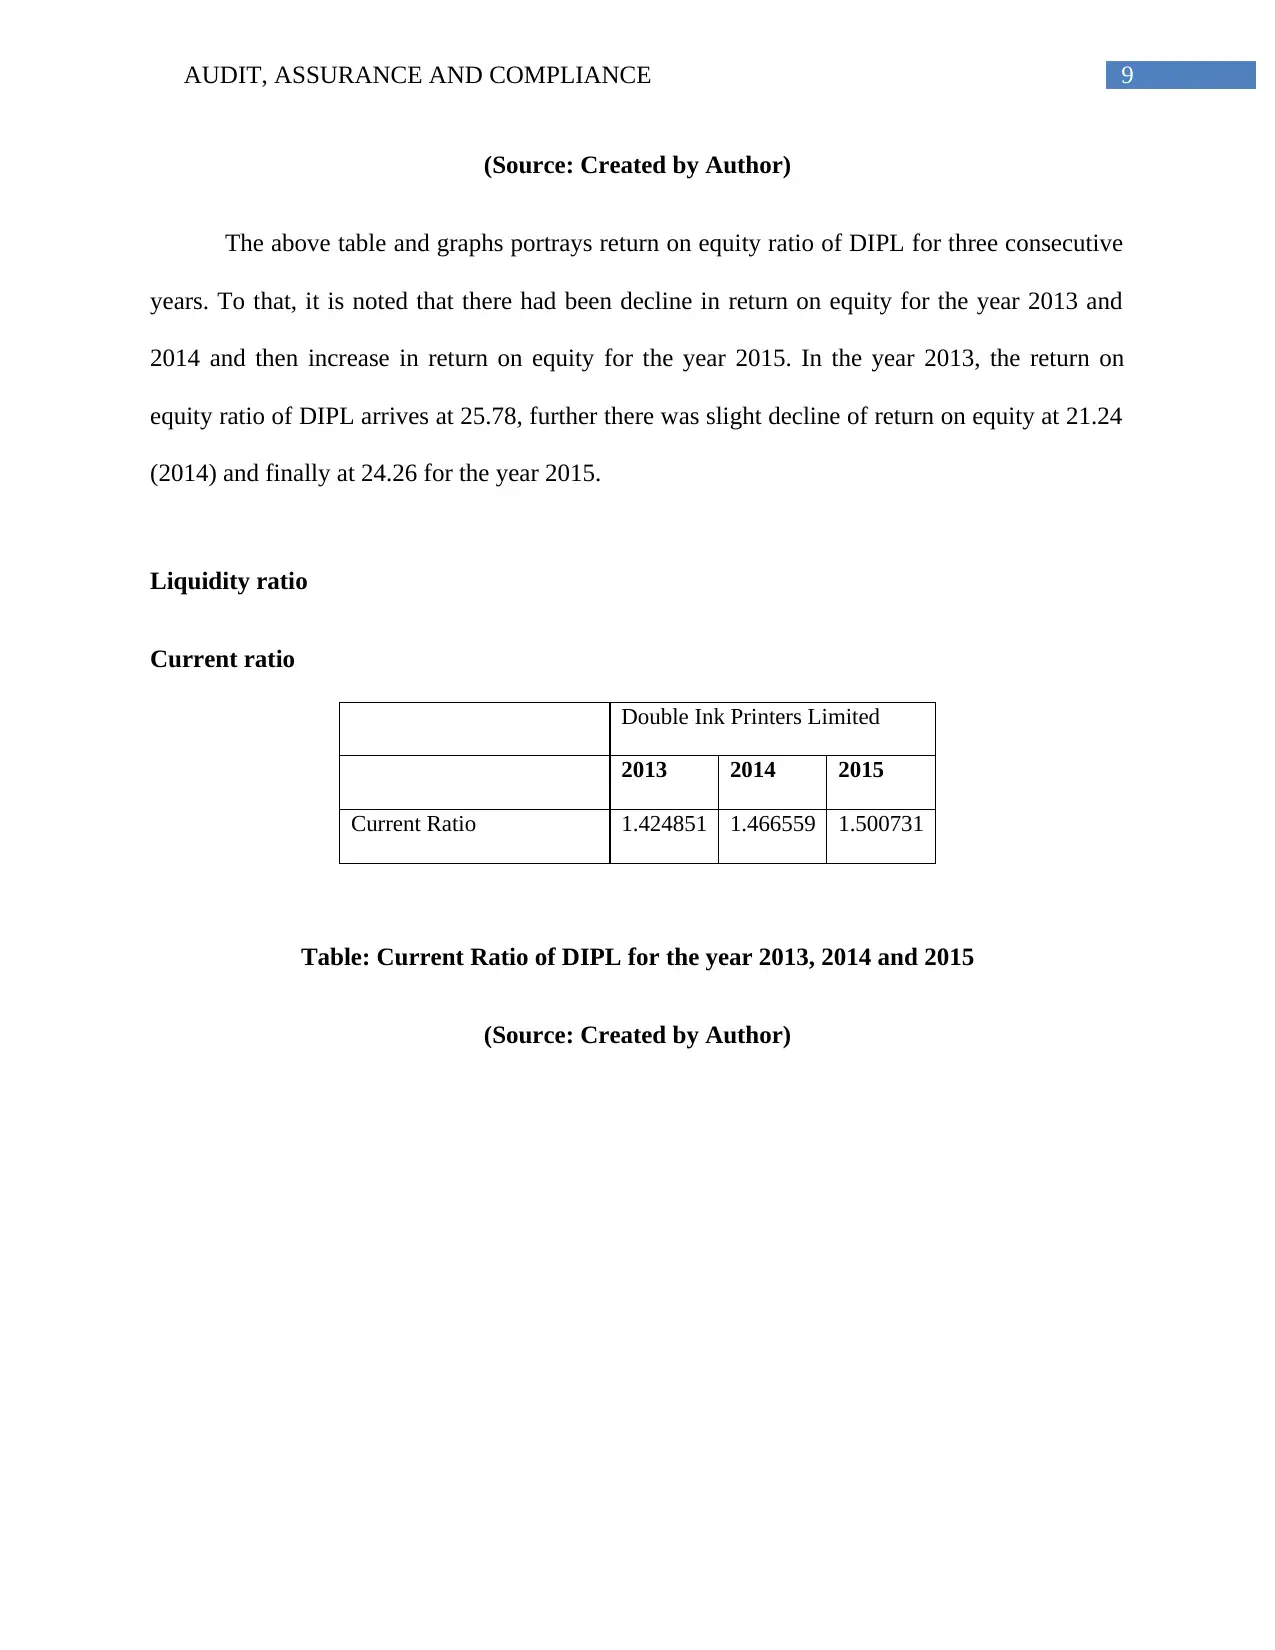
Current Ratio 1.424851 1.466559 1.500731
Table: Current Ratio of DIPL for the year 2013, 2014 and 2015
(Source: Created by Author)
(Source: Created by Author)
The above table and graphs portrays return on equity ratio of DIPL for three consecutive
years. To that, it is noted that there had been decline in return on equity for the year 2013 and
2014 and then increase in return on equity for the year 2015. In the year 2013, the return on
equity ratio of DIPL arrives at 25.78, further there was slight decline of return on equity at 21.24
(2014) and finally at 24.26 for the year 2015.
Liquidity ratio
Current ratio
Double Ink Printers Limited
2013 2014 2015
Current Ratio 1.424851 1.466559 1.500731
Table: Current Ratio of DIPL for the year 2013, 2014 and 2015
(Source: Created by Author)
⊘ This is a preview!⊘
Do you want full access?
Subscribe today to unlock all pages.
Trusted by 1+ million students worldwide
10AUDIT, ASSURANCE AND COMPLIANCE
2013 2014 2015
Double Ink Printers Limited
1.38
1.4
1.42
1.44
1.46
1.48
1.5
1.52
Current Ratio
Current Ratio
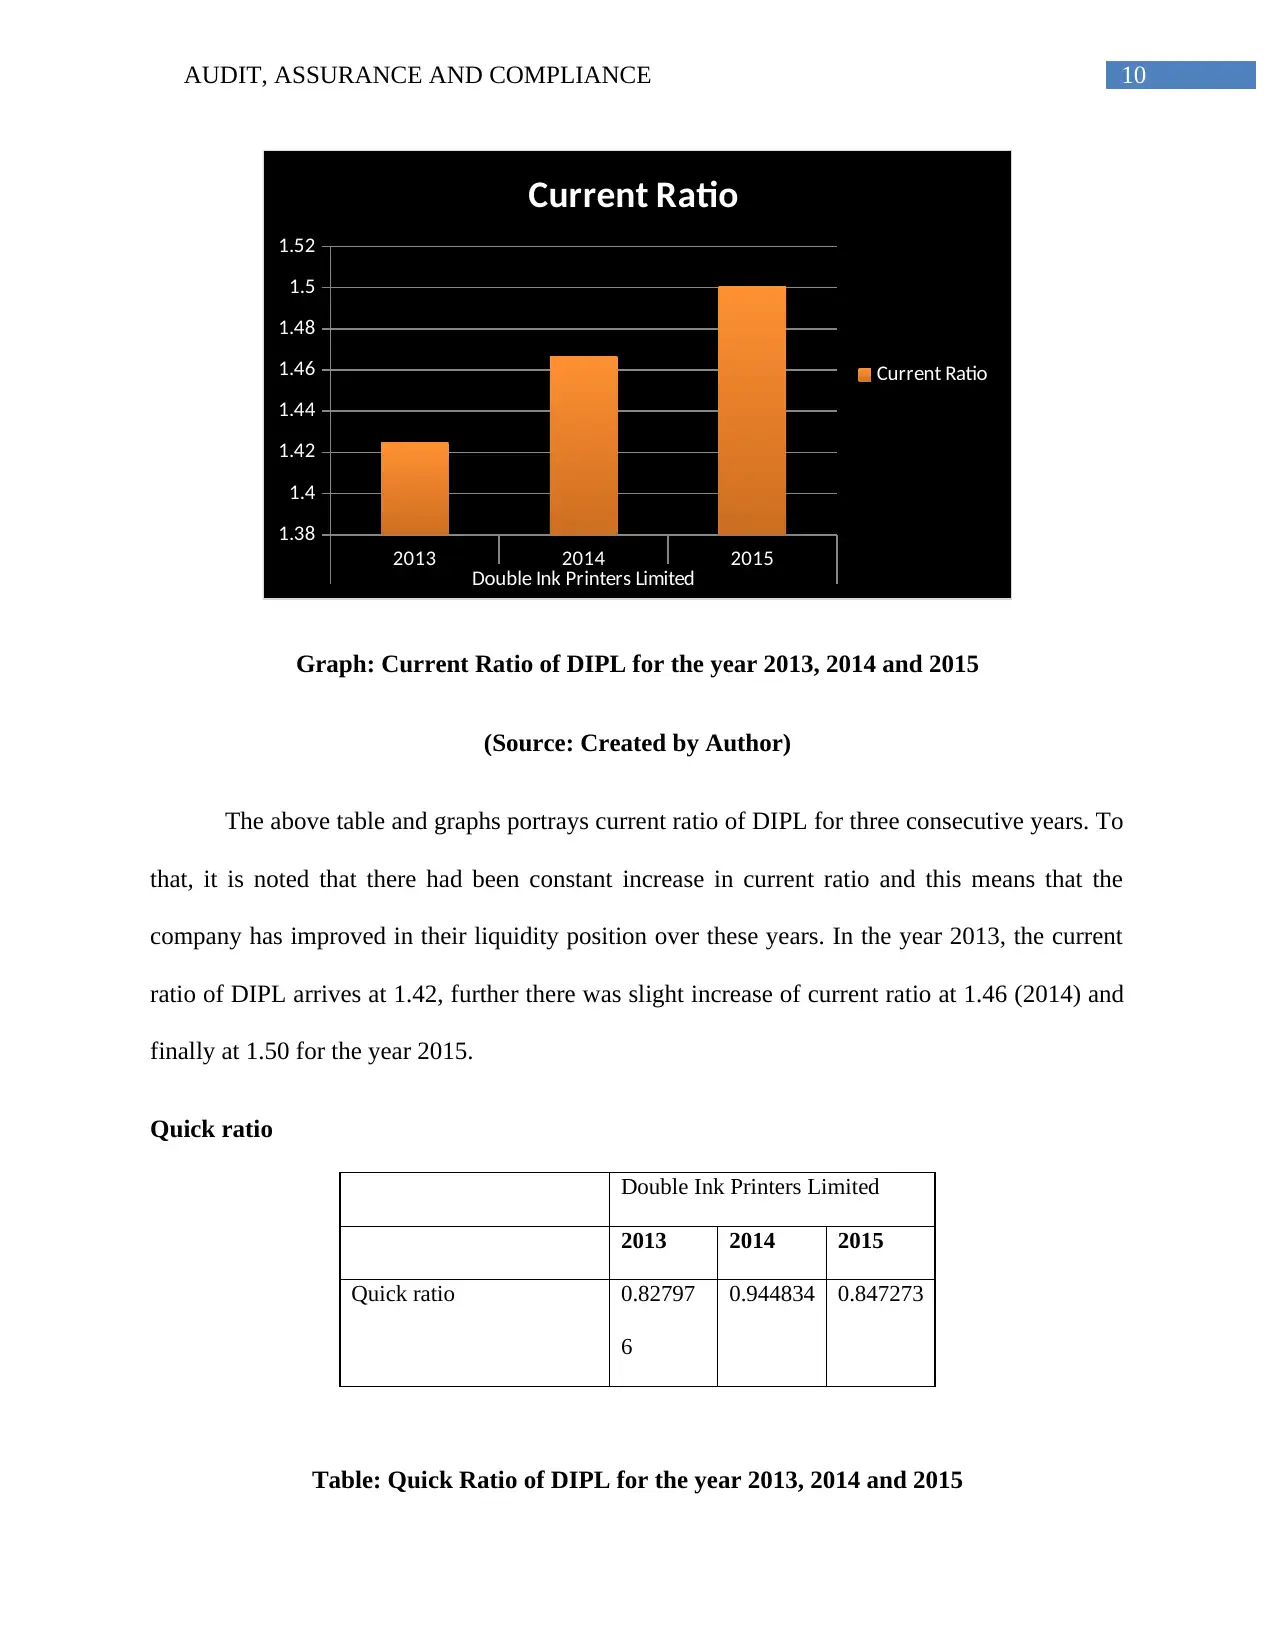
Graph: Current Ratio of DIPL for the year 2013, 2014 and 2015
(Source: Created by Author)
The above table and graphs portrays current ratio of DIPL for three consecutive years. To
that, it is noted that there had been constant increase in current ratio and this means that the
company has improved in their liquidity position over these years. In the year 2013, the current
ratio of DIPL arrives at 1.42, further there was slight increase of current ratio at 1.46 (2014) and
finally at 1.50 for the year 2015.
Quick ratio
Double Ink Printers Limited
2013 2014 2015
Quick ratio 0.82797
6
0.944834 0.847273
Table: Quick Ratio of DIPL for the year 2013, 2014 and 2015
2013 2014 2015
Double Ink Printers Limited
1.38
1.4
1.42
1.44
1.46
1.48
1.5
1.52
Current Ratio
Current Ratio
Graph: Current Ratio of DIPL for the year 2013, 2014 and 2015
(Source: Created by Author)
The above table and graphs portrays current ratio of DIPL for three consecutive years. To
that, it is noted that there had been constant increase in current ratio and this means that the
company has improved in their liquidity position over these years. In the year 2013, the current
ratio of DIPL arrives at 1.42, further there was slight increase of current ratio at 1.46 (2014) and
finally at 1.50 for the year 2015.
Quick ratio
Double Ink Printers Limited
2013 2014 2015
Quick ratio 0.82797
6
0.944834 0.847273
Table: Quick Ratio of DIPL for the year 2013, 2014 and 2015
Paraphrase This Document
Need a fresh take? Get an instant paraphrase of this document with our AI Paraphraser
11AUDIT, ASSURANCE AND COMPLIANCE
(Source: Created by Author)
2013 2014 2015
Double Ink Printers Limited
0.76
0.78
0.8
0.82
0.84
0.86
0.88
0.9
0.92
0.94
0.96
Quick ratio
Quick ratio
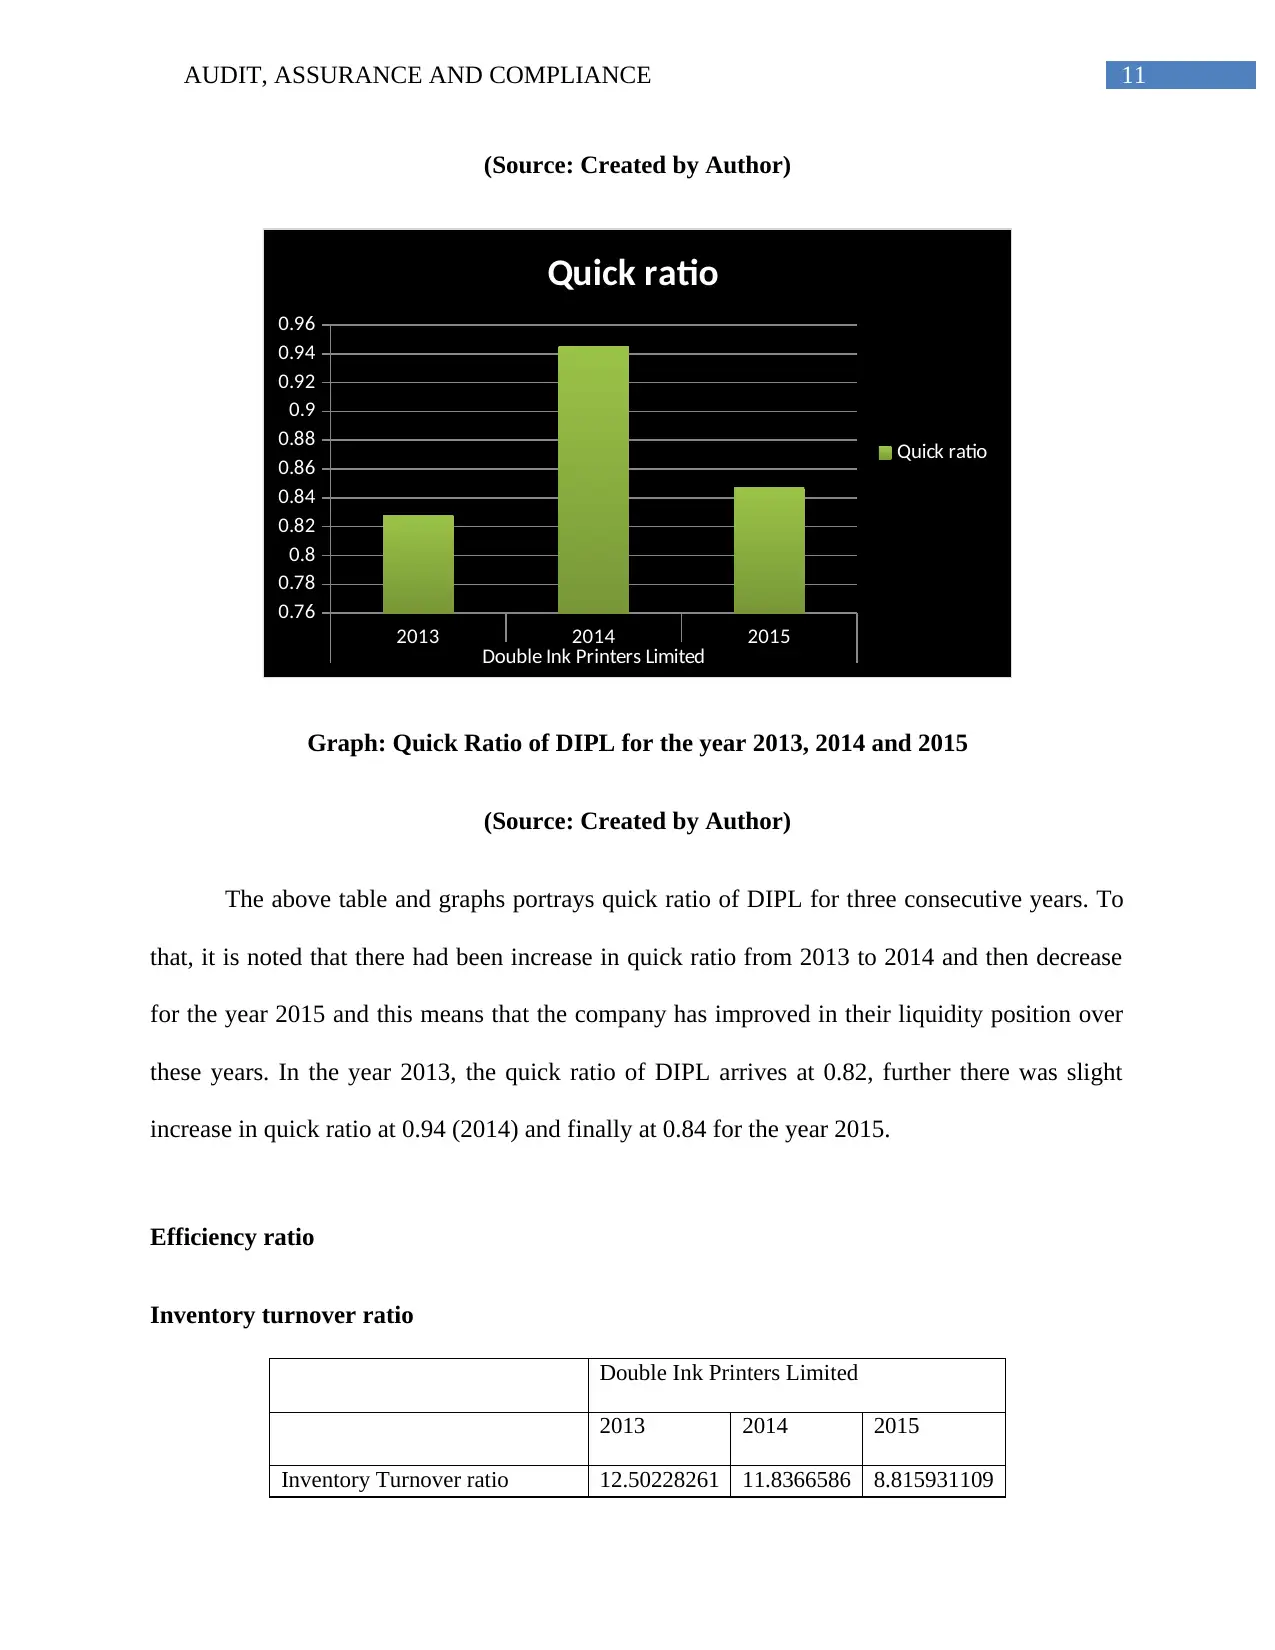
Graph: Quick Ratio of DIPL for the year 2013, 2014 and 2015
(Source: Created by Author)
The above table and graphs portrays quick ratio of DIPL for three consecutive years. To
that, it is noted that there had been increase in quick ratio from 2013 to 2014 and then decrease
for the year 2015 and this means that the company has improved in their liquidity position over
these years. In the year 2013, the quick ratio of DIPL arrives at 0.82, further there was slight
increase in quick ratio at 0.94 (2014) and finally at 0.84 for the year 2015.
Efficiency ratio
Inventory turnover ratio
Double Ink Printers Limited
2013 2014 2015
Inventory Turnover ratio 12.50228261 11.8366586 8.815931109
(Source: Created by Author)
2013 2014 2015
Double Ink Printers Limited
0.76
0.78
0.8
0.82
0.84
0.86
0.88
0.9
0.92
0.94
0.96
Quick ratio
Quick ratio
Graph: Quick Ratio of DIPL for the year 2013, 2014 and 2015
(Source: Created by Author)
The above table and graphs portrays quick ratio of DIPL for three consecutive years. To
that, it is noted that there had been increase in quick ratio from 2013 to 2014 and then decrease
for the year 2015 and this means that the company has improved in their liquidity position over
these years. In the year 2013, the quick ratio of DIPL arrives at 0.82, further there was slight
increase in quick ratio at 0.94 (2014) and finally at 0.84 for the year 2015.
Efficiency ratio
Inventory turnover ratio
Double Ink Printers Limited
2013 2014 2015
Inventory Turnover ratio 12.50228261 11.8366586 8.815931109
12AUDIT, ASSURANCE AND COMPLIANCE
Table: Inventory turnover Ratio of DIPL for the year 2013, 2014 and 2015
(Source: Created by Author)
2013 2014 2015
Double Ink Printers Limited
0
2
4
6
8
10
12
14
Inventory Turnover ratio
Inventory Turnover ratio
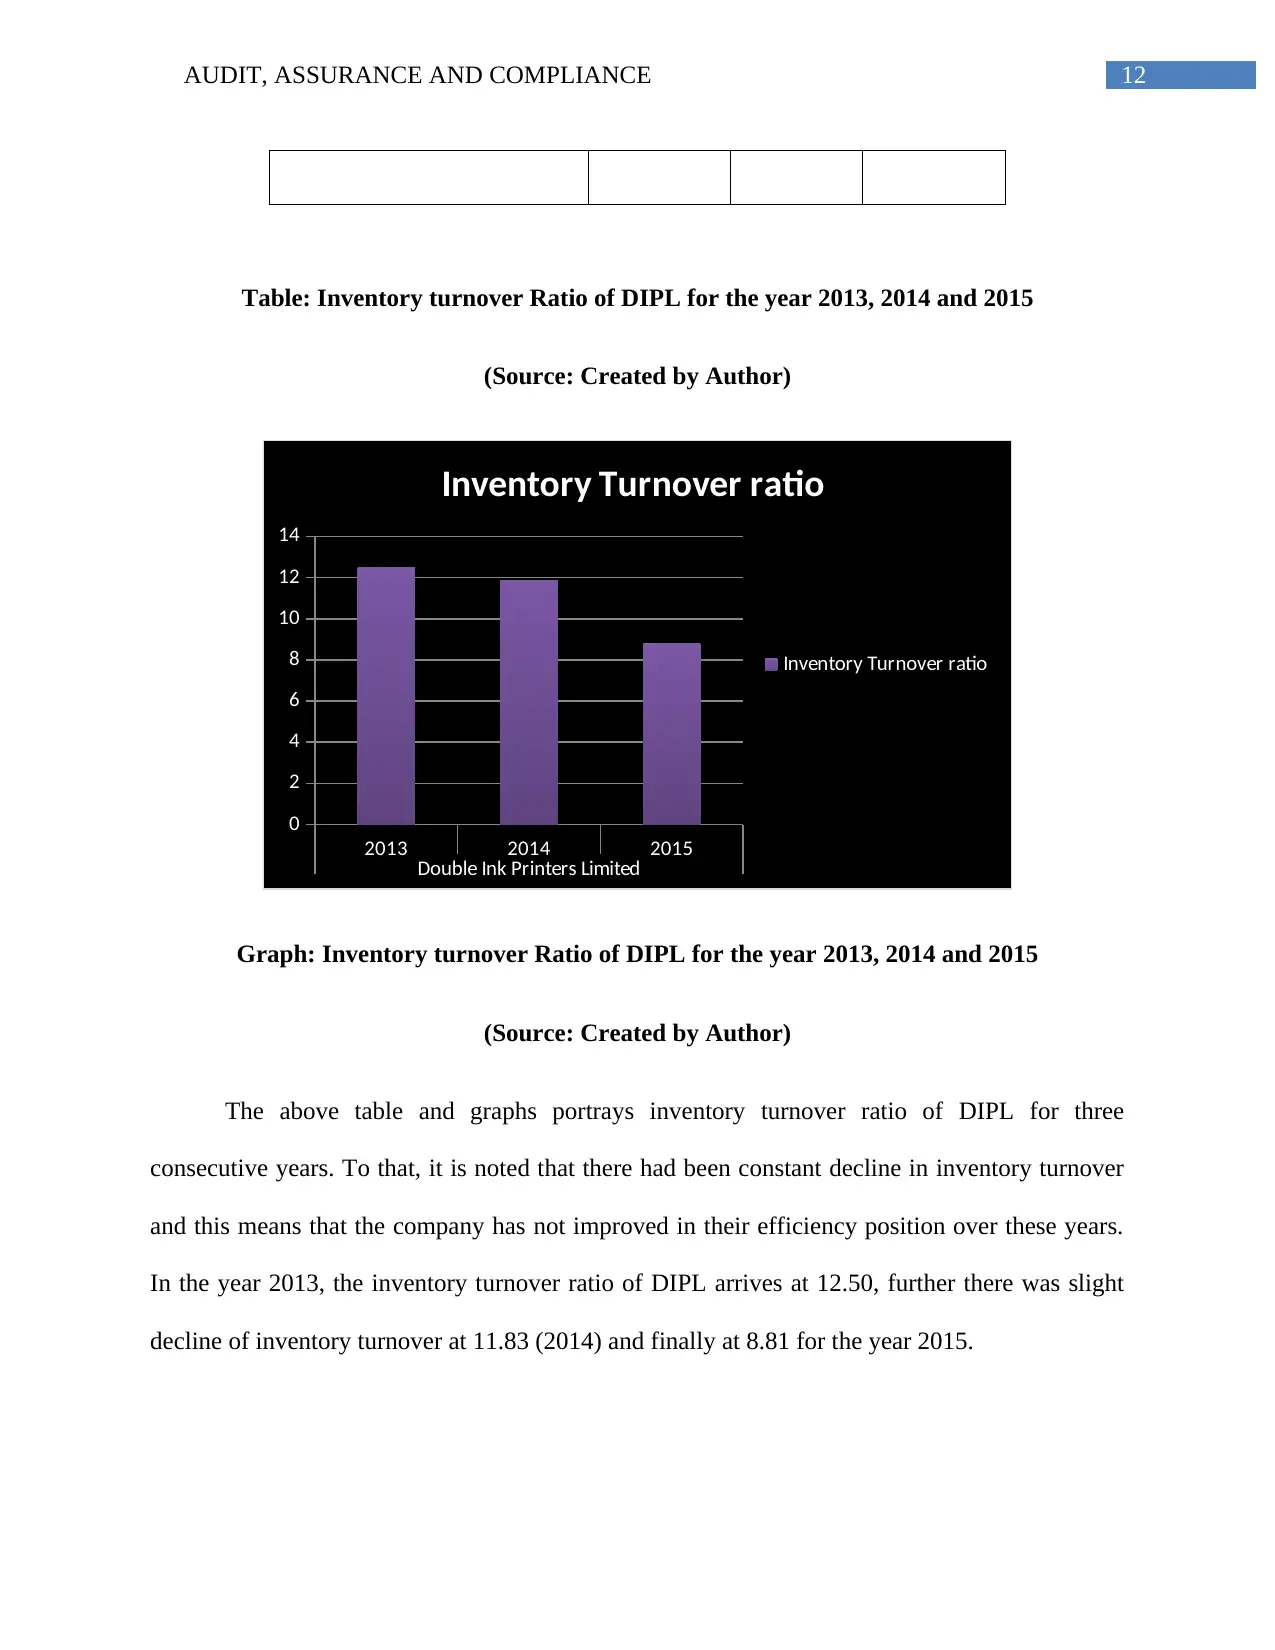
Graph: Inventory turnover Ratio of DIPL for the year 2013, 2014 and 2015
(Source: Created by Author)
The above table and graphs portrays inventory turnover ratio of DIPL for three
consecutive years. To that, it is noted that there had been constant decline in inventory turnover
and this means that the company has not improved in their efficiency position over these years.
In the year 2013, the inventory turnover ratio of DIPL arrives at 12.50, further there was slight
decline of inventory turnover at 11.83 (2014) and finally at 8.81 for the year 2015.
Table: Inventory turnover Ratio of DIPL for the year 2013, 2014 and 2015
(Source: Created by Author)
2013 2014 2015
Double Ink Printers Limited
0
2
4
6
8
10
12
14
Inventory Turnover ratio
Inventory Turnover ratio
Graph: Inventory turnover Ratio of DIPL for the year 2013, 2014 and 2015
(Source: Created by Author)
The above table and graphs portrays inventory turnover ratio of DIPL for three
consecutive years. To that, it is noted that there had been constant decline in inventory turnover
and this means that the company has not improved in their efficiency position over these years.
In the year 2013, the inventory turnover ratio of DIPL arrives at 12.50, further there was slight
decline of inventory turnover at 11.83 (2014) and finally at 8.81 for the year 2015.
⊘ This is a preview!⊘
Do you want full access?
Subscribe today to unlock all pages.
Trusted by 1+ million students worldwide
1 out of 20
Related Documents


Your All-in-One AI-Powered Toolkit for Academic Success.
+13062052269
info@desklib.com
Available 24*7 on WhatsApp / Email
![[object Object]](/_next/static/media/star-bottom.7253800d.svg)
Unlock your academic potential
Copyright © 2020–2026 A2Z Services. All Rights Reserved. Developed and managed by ZUCOL.