Auditing Report: Audit Risk Analysis of Cochlear Limited, Australia
VerifiedAdded on 2021/10/12
|18
|3743
|217
Report
AI Summary
This report presents an audit risk analysis of Cochlear Limited, an Australian company specializing in cochlear implants. The report begins with an executive summary and proceeds with applying analytical procedures, including a comparison of the income statement and balance sheet over three years, and an analysis of profitability, liquidity, efficiency, and leverage ratios. The second part analyzes the inherent risk of material misstatements at the financial report level, considering factors like management integrity and the nature of the business. The final section focuses on inherent risk at the assertion level, examining account balances at risk. The report highlights key areas for audit planning and decision-making, emphasizing the importance of understanding financial inconsistencies and industry-specific factors.

Running head: AUDITING
Auditing
Name of the Student
Name of the University
Author’s Note
Auditing
Name of the Student
Name of the University
Author’s Note
Paraphrase This Document
Need a fresh take? Get an instant paraphrase of this document with our AI Paraphraser
1AUDITING
Table of Contents
Executive Summary.....................................................................................................................................2
Analytical Procedures..................................................................................................................................3
Risk of Material Misstatements (Inherent Risk) at the Financial Report Level..........................................10
Risk of Material Misstatements (Inherent Risk) at the Assertion Level.....................................................14
References.................................................................................................................................................16
2AUDITING
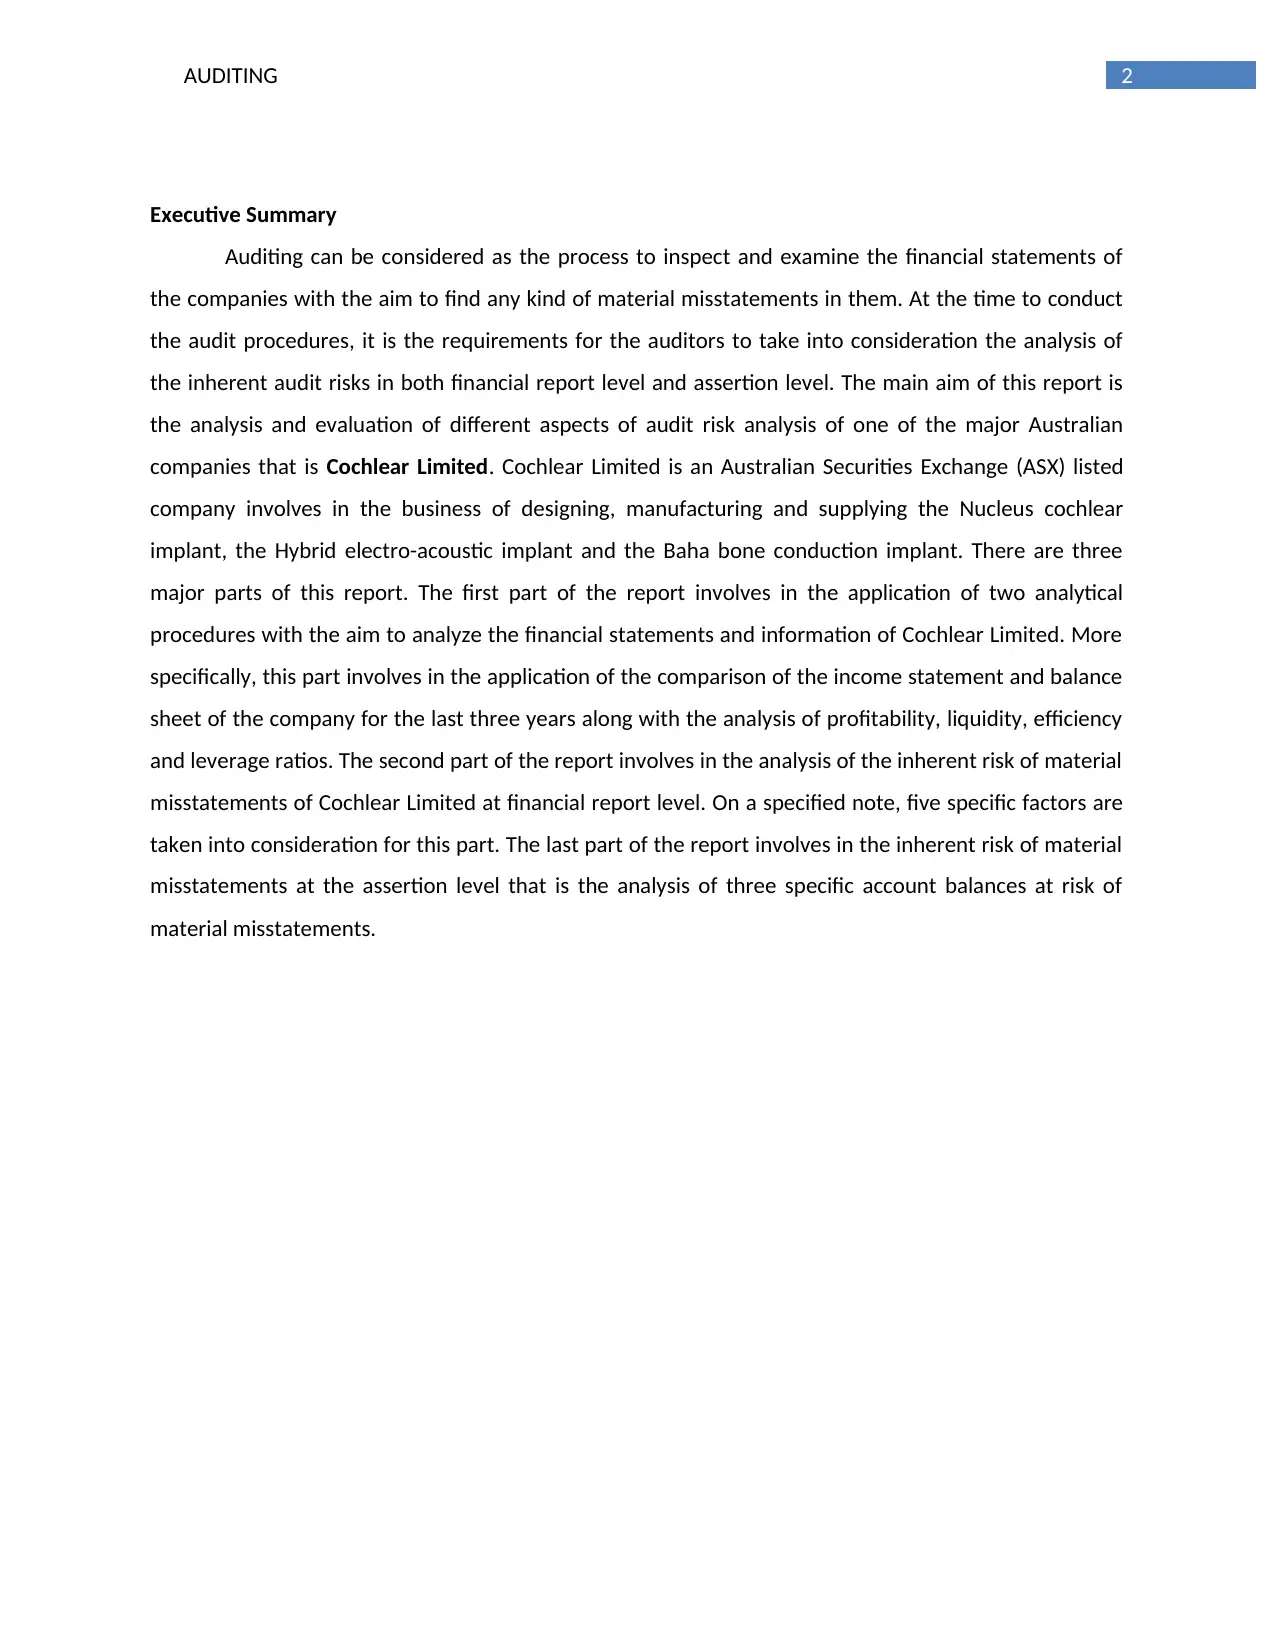
Executive Summary
Auditing can be considered as the process to inspect and examine the financial statements of
the companies with the aim to find any kind of material misstatements in them. At the time to conduct
the audit procedures, it is the requirements for the auditors to take into consideration the analysis of
the inherent audit risks in both financial report level and assertion level. The main aim of this report is
the analysis and evaluation of different aspects of audit risk analysis of one of the major Australian
companies that is Cochlear Limited. Cochlear Limited is an Australian Securities Exchange (ASX) listed
company involves in the business of designing, manufacturing and supplying the Nucleus cochlear
implant, the Hybrid electro-acoustic implant and the Baha bone conduction implant. There are three
major parts of this report. The first part of the report involves in the application of two analytical
procedures with the aim to analyze the financial statements and information of Cochlear Limited. More
specifically, this part involves in the application of the comparison of the income statement and balance
sheet of the company for the last three years along with the analysis of profitability, liquidity, efficiency
and leverage ratios. The second part of the report involves in the analysis of the inherent risk of material
misstatements of Cochlear Limited at financial report level. On a specified note, five specific factors are
taken into consideration for this part. The last part of the report involves in the inherent risk of material
misstatements at the assertion level that is the analysis of three specific account balances at risk of
material misstatements.
⊘ This is a preview!⊘
Do you want full access?
Subscribe today to unlock all pages.
Trusted by 1+ million students worldwide
3AUDITING
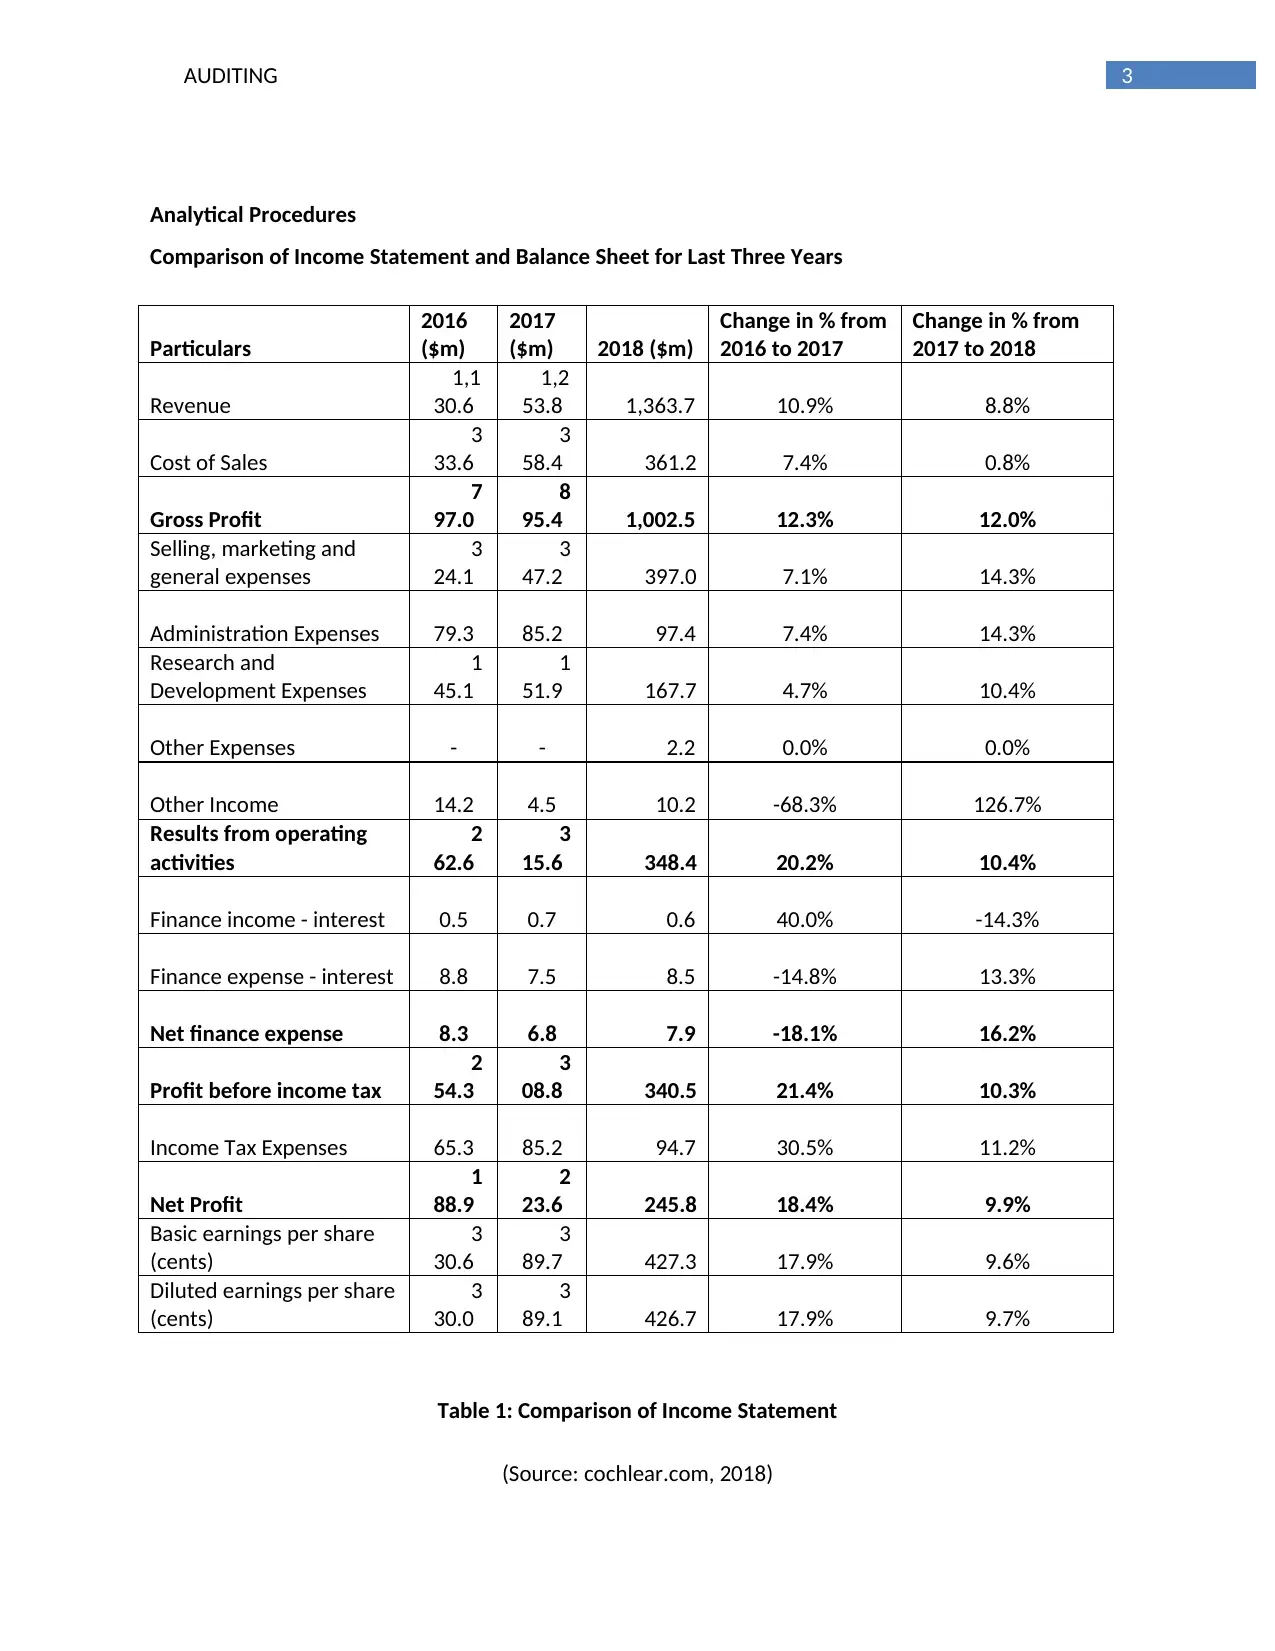
Analytical Procedures
Comparison of Income Statement and Balance Sheet for Last Three Years
Particulars
2016
($m)
2017
($m) 2018 ($m)
Change in % from
2016 to 2017
Change in % from
2017 to 2018
Revenue
1,1
30.6
1,2
53.8 1,363.7 10.9% 8.8%
Cost of Sales
3
33.6
3
58.4 361.2 7.4% 0.8%
Gross Profit
7
97.0
8
95.4 1,002.5 12.3% 12.0%
Selling, marketing and
general expenses
3
24.1
3
47.2 397.0 7.1% 14.3%
Administration Expenses 79.3 85.2 97.4 7.4% 14.3%
Research and
Development Expenses
1
45.1
1
51.9 167.7 4.7% 10.4%
Other Expenses - - 2.2 0.0% 0.0%
Other Income 14.2 4.5 10.2 -68.3% 126.7%
Results from operating
activities
2
62.6
3
15.6 348.4 20.2% 10.4%
Finance income - interest 0.5 0.7 0.6 40.0% -14.3%
Finance expense - interest 8.8 7.5 8.5 -14.8% 13.3%
Net finance expense 8.3 6.8 7.9 -18.1% 16.2%
Profit before income tax
2
54.3
3
08.8 340.5 21.4% 10.3%
Income Tax Expenses 65.3 85.2 94.7 30.5% 11.2%
Net Profit
1
88.9
2
23.6 245.8 18.4% 9.9%
Basic earnings per share
(cents)
3
30.6
3
89.7 427.3 17.9% 9.6%
Diluted earnings per share
(cents)
3
30.0
3
89.1 426.7 17.9% 9.7%
Table 1: Comparison of Income Statement
(Source: cochlear.com, 2018)
Paraphrase This Document
Need a fresh take? Get an instant paraphrase of this document with our AI Paraphraser
4AUDITING
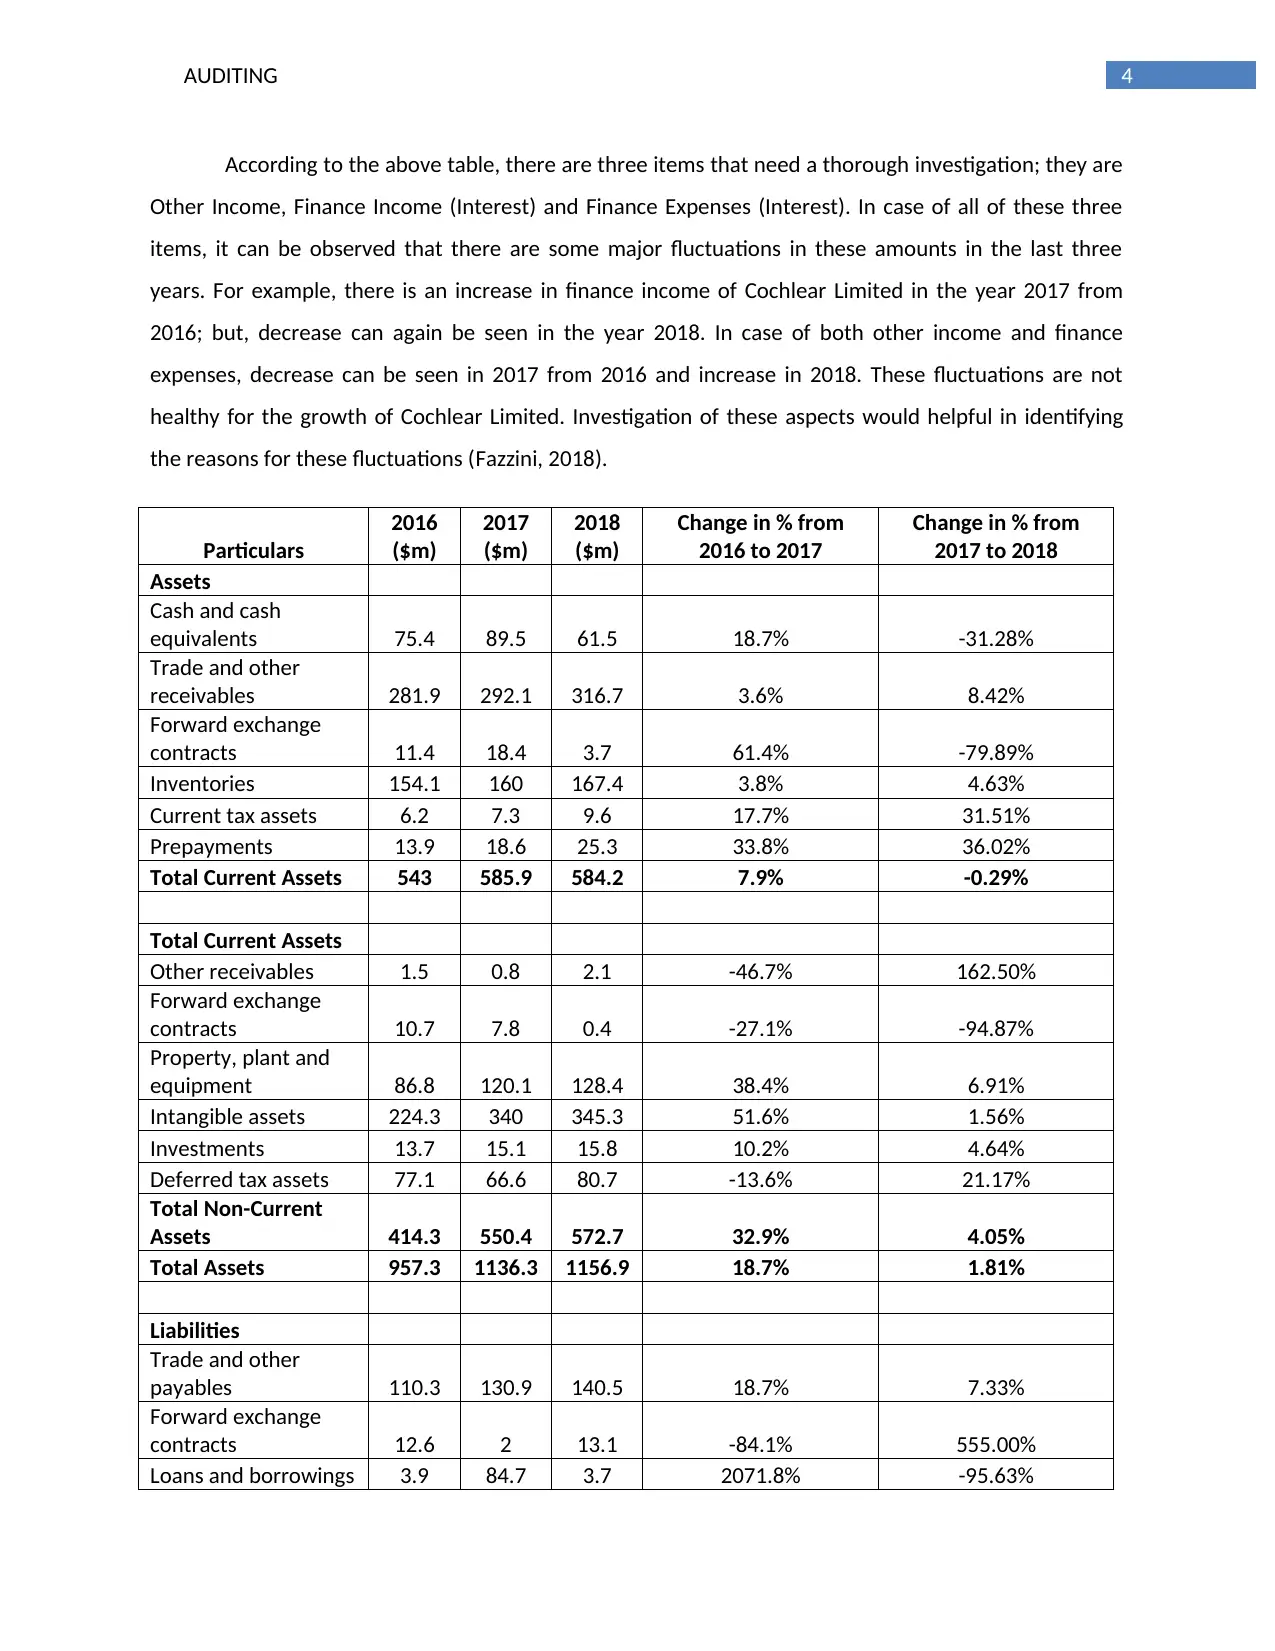
According to the above table, there are three items that need a thorough investigation; they are
Other Income, Finance Income (Interest) and Finance Expenses (Interest). In case of all of these three
items, it can be observed that there are some major fluctuations in these amounts in the last three
years. For example, there is an increase in finance income of Cochlear Limited in the year 2017 from
2016; but, decrease can again be seen in the year 2018. In case of both other income and finance
expenses, decrease can be seen in 2017 from 2016 and increase in 2018. These fluctuations are not
healthy for the growth of Cochlear Limited. Investigation of these aspects would helpful in identifying
the reasons for these fluctuations (Fazzini, 2018).
Particulars
2016
($m)
2017
($m)
2018
($m)
Change in % from
2016 to 2017
Change in % from
2017 to 2018
Assets
Cash and cash
equivalents 75.4 89.5 61.5 18.7% -31.28%
Trade and other
receivables 281.9 292.1 316.7 3.6% 8.42%
Forward exchange
contracts 11.4 18.4 3.7 61.4% -79.89%
Inventories 154.1 160 167.4 3.8% 4.63%
Current tax assets 6.2 7.3 9.6 17.7% 31.51%
Prepayments 13.9 18.6 25.3 33.8% 36.02%
Total Current Assets 543 585.9 584.2 7.9% -0.29%
Total Current Assets
Other receivables 1.5 0.8 2.1 -46.7% 162.50%
Forward exchange
contracts 10.7 7.8 0.4 -27.1% -94.87%
Property, plant and
equipment 86.8 120.1 128.4 38.4% 6.91%
Intangible assets 224.3 340 345.3 51.6% 1.56%
Investments 13.7 15.1 15.8 10.2% 4.64%
Deferred tax assets 77.1 66.6 80.7 -13.6% 21.17%
Total Non-Current
Assets 414.3 550.4 572.7 32.9% 4.05%
Total Assets 957.3 1136.3 1156.9 18.7% 1.81%
Liabilities
Trade and other
payables 110.3 130.9 140.5 18.7% 7.33%
Forward exchange
contracts 12.6 2 13.1 -84.1% 555.00%
Loans and borrowings 3.9 84.7 3.7 2071.8% -95.63%
5AUDITING
Current tax liabilities 13.7 26.3 22.1 92.0% -15.97%
Employee benefit
liabilities 45.4 52.4 57.3 15.4% 9.35%
Provisions 33.6 25 24.5 -25.6% -2.00%
Deferred revenue 31.2 25.3 26.5 -18.9% 4.74%
Total Current
Liabilities 251.1 346.6 287.7 38.0% -16.99%
Trade and other
payables 0 33.9 28.1 0.0% -17.11%
Forward exchange
contracts 3.5 3.2 9.2 -8.6% 187.50%
Loans and borrowings 189.2 134.2 144 -29.1% 7.30%
Employee benefit
liabilities 13.7 11 12 -19.7% 9.09%
Provisions 44 54.7 54.4 24.3% -0.55%
Deferred tax liabilities 7.1 5.8 8.1 -18.3% 39.66%
Deferred revenue 0 3.3 2.6 0.0% -21.21%
Total Non-Current
Liabilities 257.7 246.1 258.4 -4.5% 5.00%
Total Liabilities 508.8 592.7 546.1 16.5% -7.86%
Net Assets 448.5 543.6 610.8 21.2% 12.36%
Equity
Share Capital 158.9 169.4 173 6.6% 2.13%
Reserves 14.6 12.9 33.8 -11.6% 162.02%
Retained Earnings 304.2 387.1 471.6 27.3% 21.83%
Total Equity 448.5 543.6 610.8 21.2% 12.36%
Table 2: Comparison of Balance Sheet
(Source: cochlear.com, 2018)
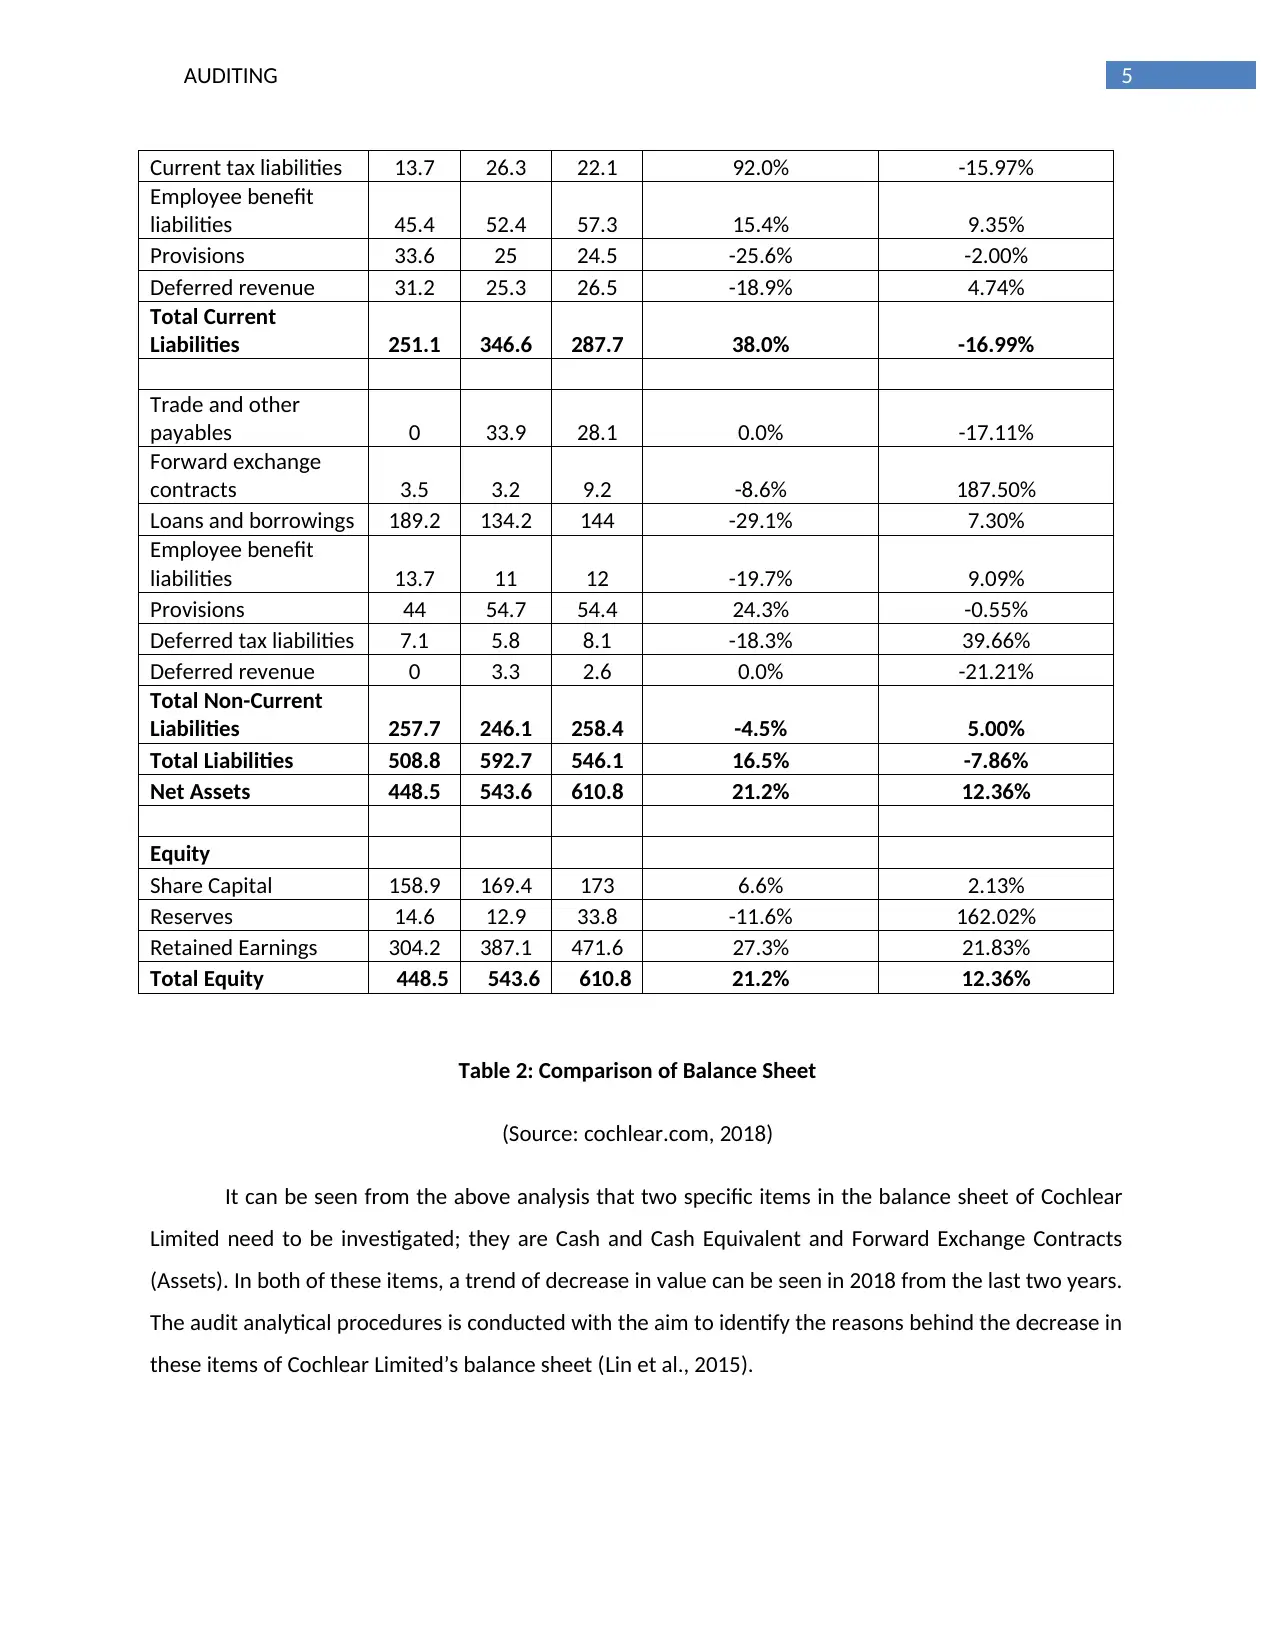
It can be seen from the above analysis that two specific items in the balance sheet of Cochlear
Limited need to be investigated; they are Cash and Cash Equivalent and Forward Exchange Contracts
(Assets). In both of these items, a trend of decrease in value can be seen in 2018 from the last two years.
The audit analytical procedures is conducted with the aim to identify the reasons behind the decrease in
these items of Cochlear Limited’s balance sheet (Lin et al., 2015).
Current tax liabilities 13.7 26.3 22.1 92.0% -15.97%
Employee benefit
liabilities 45.4 52.4 57.3 15.4% 9.35%
Provisions 33.6 25 24.5 -25.6% -2.00%
Deferred revenue 31.2 25.3 26.5 -18.9% 4.74%
Total Current
Liabilities 251.1 346.6 287.7 38.0% -16.99%
Trade and other
payables 0 33.9 28.1 0.0% -17.11%
Forward exchange
contracts 3.5 3.2 9.2 -8.6% 187.50%
Loans and borrowings 189.2 134.2 144 -29.1% 7.30%
Employee benefit
liabilities 13.7 11 12 -19.7% 9.09%
Provisions 44 54.7 54.4 24.3% -0.55%
Deferred tax liabilities 7.1 5.8 8.1 -18.3% 39.66%
Deferred revenue 0 3.3 2.6 0.0% -21.21%
Total Non-Current
Liabilities 257.7 246.1 258.4 -4.5% 5.00%
Total Liabilities 508.8 592.7 546.1 16.5% -7.86%
Net Assets 448.5 543.6 610.8 21.2% 12.36%
Equity
Share Capital 158.9 169.4 173 6.6% 2.13%
Reserves 14.6 12.9 33.8 -11.6% 162.02%
Retained Earnings 304.2 387.1 471.6 27.3% 21.83%
Total Equity 448.5 543.6 610.8 21.2% 12.36%
Table 2: Comparison of Balance Sheet
(Source: cochlear.com, 2018)
It can be seen from the above analysis that two specific items in the balance sheet of Cochlear
Limited need to be investigated; they are Cash and Cash Equivalent and Forward Exchange Contracts
(Assets). In both of these items, a trend of decrease in value can be seen in 2018 from the last two years.
The audit analytical procedures is conducted with the aim to identify the reasons behind the decrease in
these items of Cochlear Limited’s balance sheet (Lin et al., 2015).
⊘ This is a preview!⊘
Do you want full access?
Subscribe today to unlock all pages.
Trusted by 1+ million students worldwide
6AUDITING
Analysis of Ratios for Last Three Years
Profitability Ratios
Particulars Formula
2016
($m)
2017
($m)
2018
($m)
Change
in %
from
2016 to
2017
Change in %
from 2017 to
2018
Industry
Average
Sales
1130.
6
1253.
8
1363.
7
Net Profit 188.9 223.6 245.8
Average
Total Assets
916.3
5
1046.
8
1146.
6
Average
Shareholder'
s Equity 401.9
496.0
5 577.2
Net Profit
Ratio Net Profit/Sale
16.71
%
17.83
%
18.02
% 6.74% 1.07% 21.71
Return on
Assets
Net
Profit/Average
Total Assets
20.61
%
21.36
%
21.44
% 3.62% 0.36% 15.5
Return on
Equity
Net
Profit/Average
Shareholder's
Equity
47.00
%
45.08
%
42.58
% -4.10% -5.53% 35.85
Table 3: Profitability Ratios
(Source: cochlear.com, 2018)
Liquidity Ratios
Particula
rs Formula
2016
($m)
2017
($m)
2018
($m)
Change in
% from
2016 to
2017
Change in %
from 2017
to 2018
Industry
Average
Total
Current
Assets 543
585.
9
584.
2
Total
Current
251.1 346.
6
287.
7
Paraphrase This Document
Need a fresh take? Get an instant paraphrase of this document with our AI Paraphraser
7AUDITING
Liabilitie
s
Inventori
es 154.1 160
167.
4
Prepaid
Expense
s 13.9 18.6 25.3
Current
Ratio
Current
Assets/Current
Liabilities 2.16 1.69 2.03 -21.83% 20.12%
2.76
Quick
Ratio
Current Assets-
Inventories-Prepaid
Expenses/Current
Liabilities 1.49 1.18 1.36 -21.31% 15.80% 1.68
Table 4: Liquidity Ratios
(Source: cochlear.com, 2018)
Efficiency Ratios
Particulars Formula
2016
($m)
2017
($m)
2018
($m)
Change in
% from
2016 to
2017
Change in %
from 2017 to
2018
Industry
Average
Sales
1130.
6
1253.
8
1363.
7
Average
Total Assets
916.3
5
1046.
8
1146.
6
Total Non-
Current
Assets 414.3 550.4 572.7
Asset
Turnover
Ratio
Sales/
Average
Total Assets 1.23 1.20 1.19 -2.92% -0.70% 0.56
Fixed Assets
Turnover
Ratio
Sales/Total
Non-
Current
Assets 2.73 2.28 2.38 -16.53% 4.53%
0.58
Table 5: Efficiency Ratios
8AUDITING
(Source: cochlear.com, 2018)
Leverage Ratios
Particulars Formula
2016
($m)
2017
($m)
2018
($m)
Change in %
from 2016
to 2017
Change in %
from 2017 to
2018
Industry
Average
Total
Equity 448.5 543.6 610.8
Total
Assets 957.3
1136.
3
1156.
9
Total
Liabilities 508.8 592.7 546.1
EBIT 262.6 315.6 348.4
Interest
Expenses 8.8 7.5 8.5
Equity
Ratio
Total
Equity/Tot
al Assets 0.47 0.48 0.53 2.11% 10.36% 1.28
Debt to
Equity
Ratio
Total
Liabilities/
Total
Equity 1.13 1.09 0.89 -3.89% -18.00%
0.43
Interest
Coverage
Ratio
EBIT/
Interest
Expenses 29.84 42.08 40.99 41.01% -2.59% 22.82
Table 6: Leverage Ratios
(Source: cochlear.com, 2018)
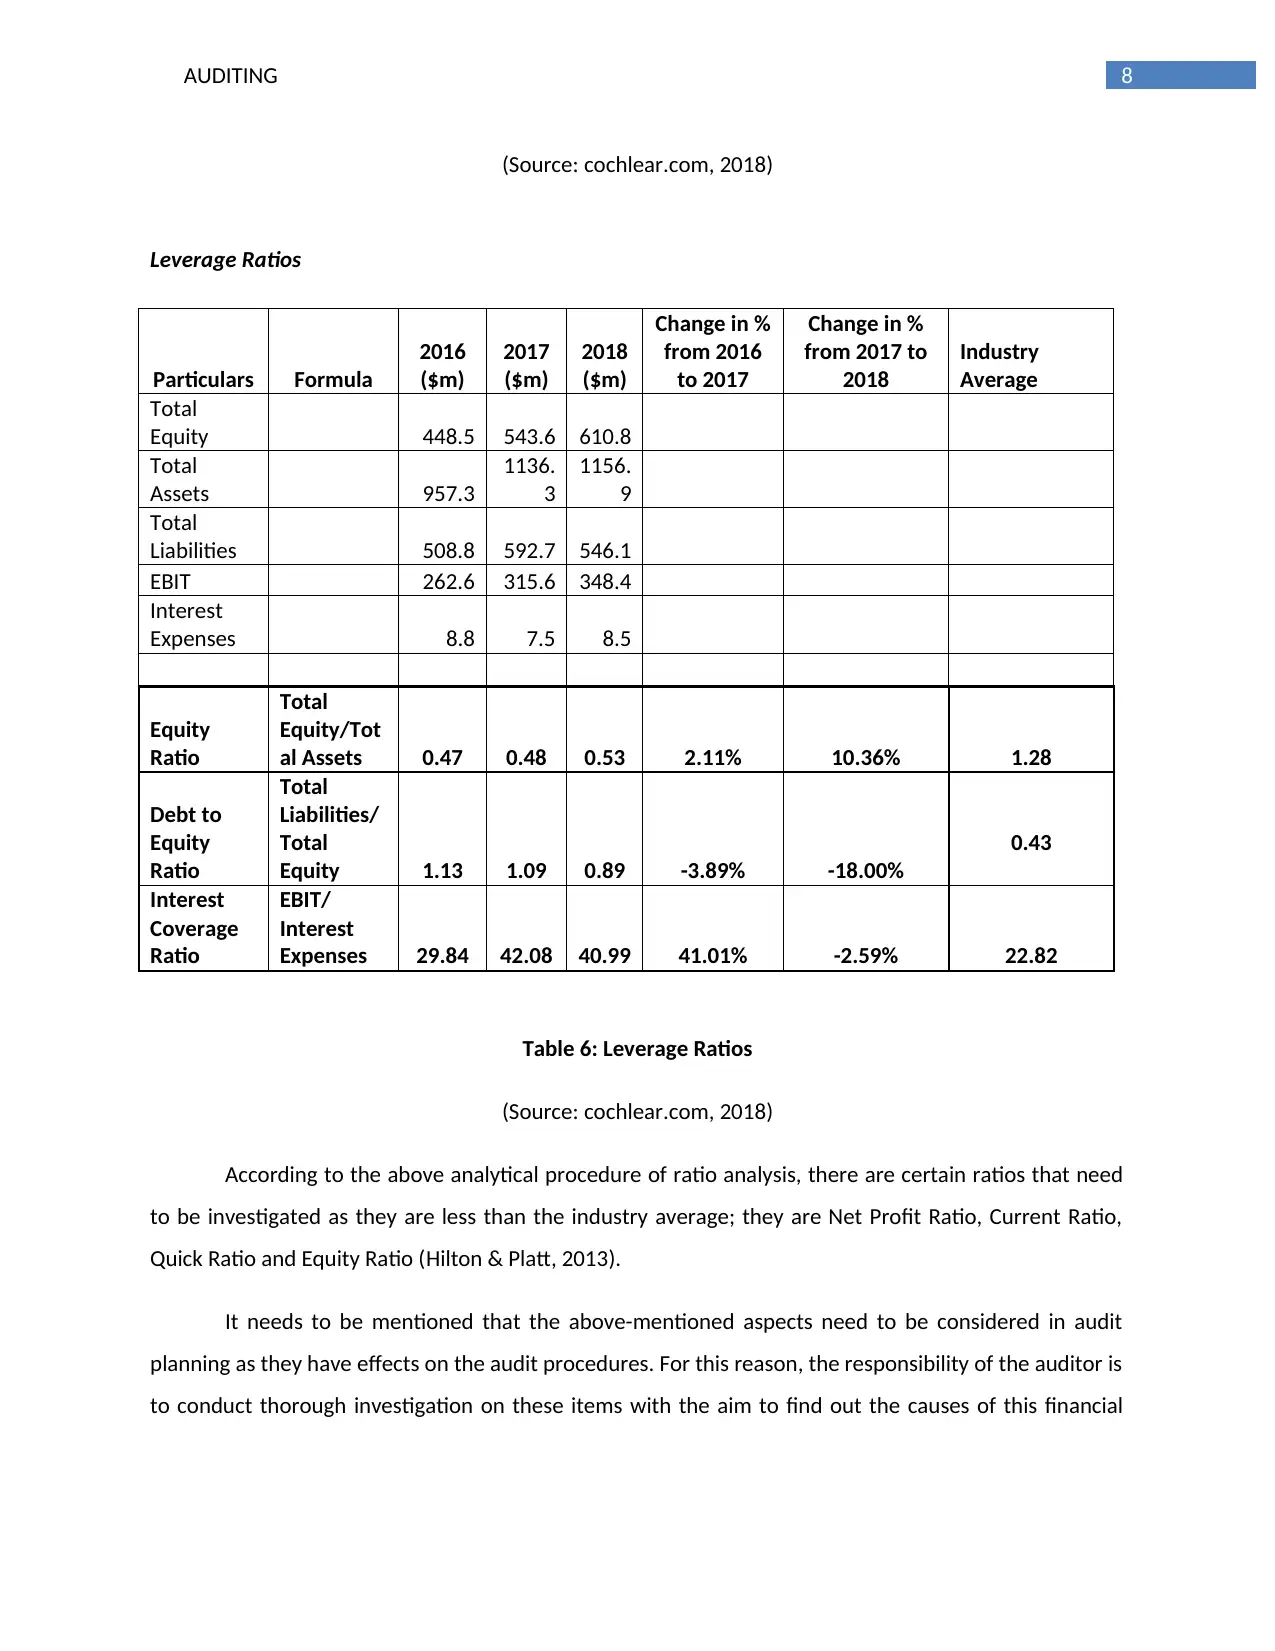
According to the above analytical procedure of ratio analysis, there are certain ratios that need
to be investigated as they are less than the industry average; they are Net Profit Ratio, Current Ratio,
Quick Ratio and Equity Ratio (Hilton & Platt, 2013).
It needs to be mentioned that the above-mentioned aspects need to be considered in audit
planning as they have effects on the audit procedures. For this reason, the responsibility of the auditor is
to conduct thorough investigation on these items with the aim to find out the causes of this financial
(Source: cochlear.com, 2018)
Leverage Ratios
Particulars Formula
2016
($m)
2017
($m)
2018
($m)
Change in %
from 2016
to 2017
Change in %
from 2017 to
2018
Industry
Average
Total
Equity 448.5 543.6 610.8
Total
Assets 957.3
1136.
3
1156.
9
Total
Liabilities 508.8 592.7 546.1
EBIT 262.6 315.6 348.4
Interest
Expenses 8.8 7.5 8.5
Equity
Ratio
Total
Equity/Tot
al Assets 0.47 0.48 0.53 2.11% 10.36% 1.28
Debt to
Equity
Ratio
Total
Liabilities/
Total
Equity 1.13 1.09 0.89 -3.89% -18.00%
0.43
Interest
Coverage
Ratio
EBIT/
Interest
Expenses 29.84 42.08 40.99 41.01% -2.59% 22.82
Table 6: Leverage Ratios
(Source: cochlear.com, 2018)
According to the above analytical procedure of ratio analysis, there are certain ratios that need
to be investigated as they are less than the industry average; they are Net Profit Ratio, Current Ratio,
Quick Ratio and Equity Ratio (Hilton & Platt, 2013).
It needs to be mentioned that the above-mentioned aspects need to be considered in audit
planning as they have effects on the audit procedures. For this reason, the responsibility of the auditor is
to conduct thorough investigation on these items with the aim to find out the causes of this financial
⊘ This is a preview!⊘
Do you want full access?
Subscribe today to unlock all pages.
Trusted by 1+ million students worldwide
9AUDITING
inconsistency. Most importantly, the auditor needs to put major emphasis on these items for the
purpose of audit planning decisions.
Conclusion
The above analytical procedures of simple comparison and ratio analysis indicate that the
auditors of Cochlear Limited is needed to take into consideration the above increase or decrease in the
values and ratios for the purpose of audit planning decision.
Paraphrase This Document
Need a fresh take? Get an instant paraphrase of this document with our AI Paraphraser
10AUDITING
Risk of Material Misstatements (Inherent Risk) at the Financial Report Level
The following discussion analyzes that inherent risk of material misstatements of Cochlear
Limited at financial report level based on five specific parameters:
a. Integrity of Management: It can be observed from the 2018 Annual Report of Cochlear Limited
that all the directors in the Board obtain high level of knowledge, experience, skill set and
goodwill in the industry. They comply with all the regulations and standards of corporate
governance with the aim to eliminate fraudulent and illegal activities in the business operations.
In addition, some independent directors are responsible for overseeing the operations of some
committees (cochlear.com, 2018). Thus, it can be said in the presence of all these aspects that
inherent risk is low in this case.
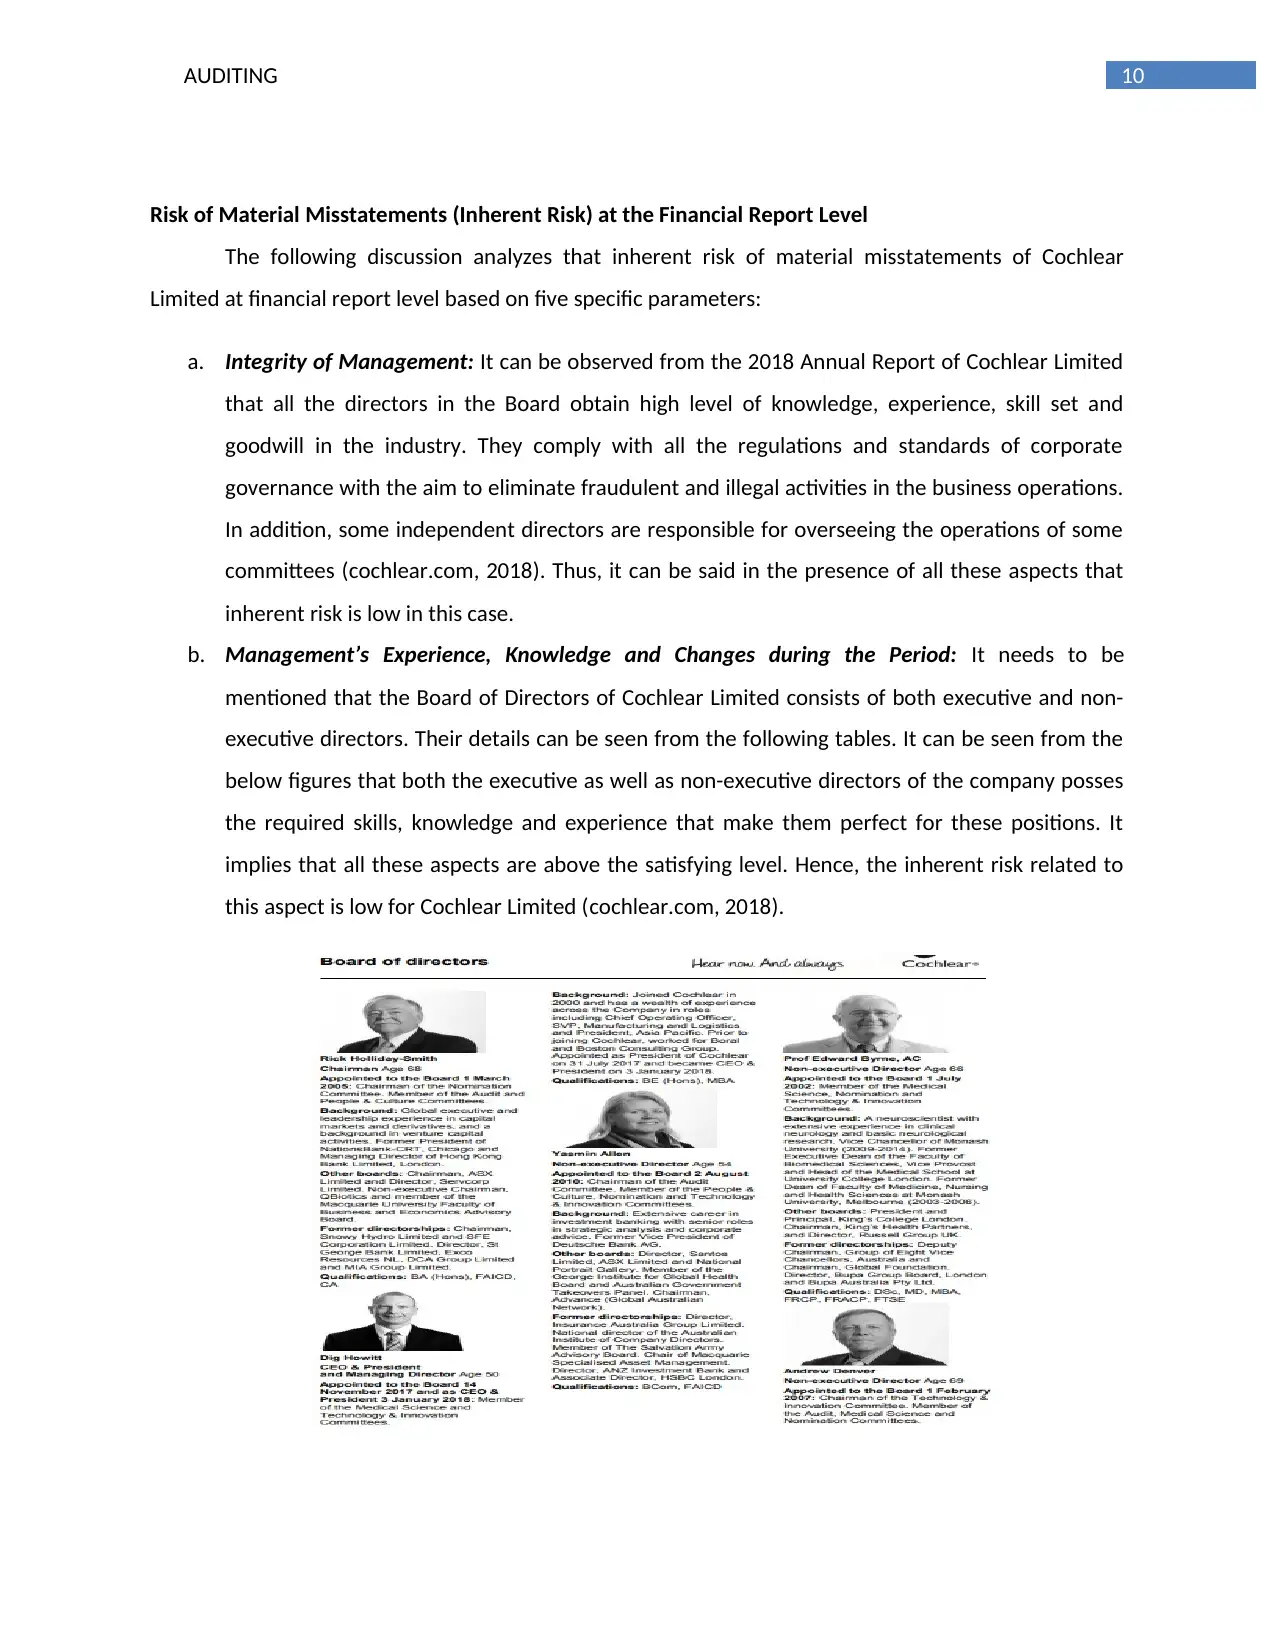
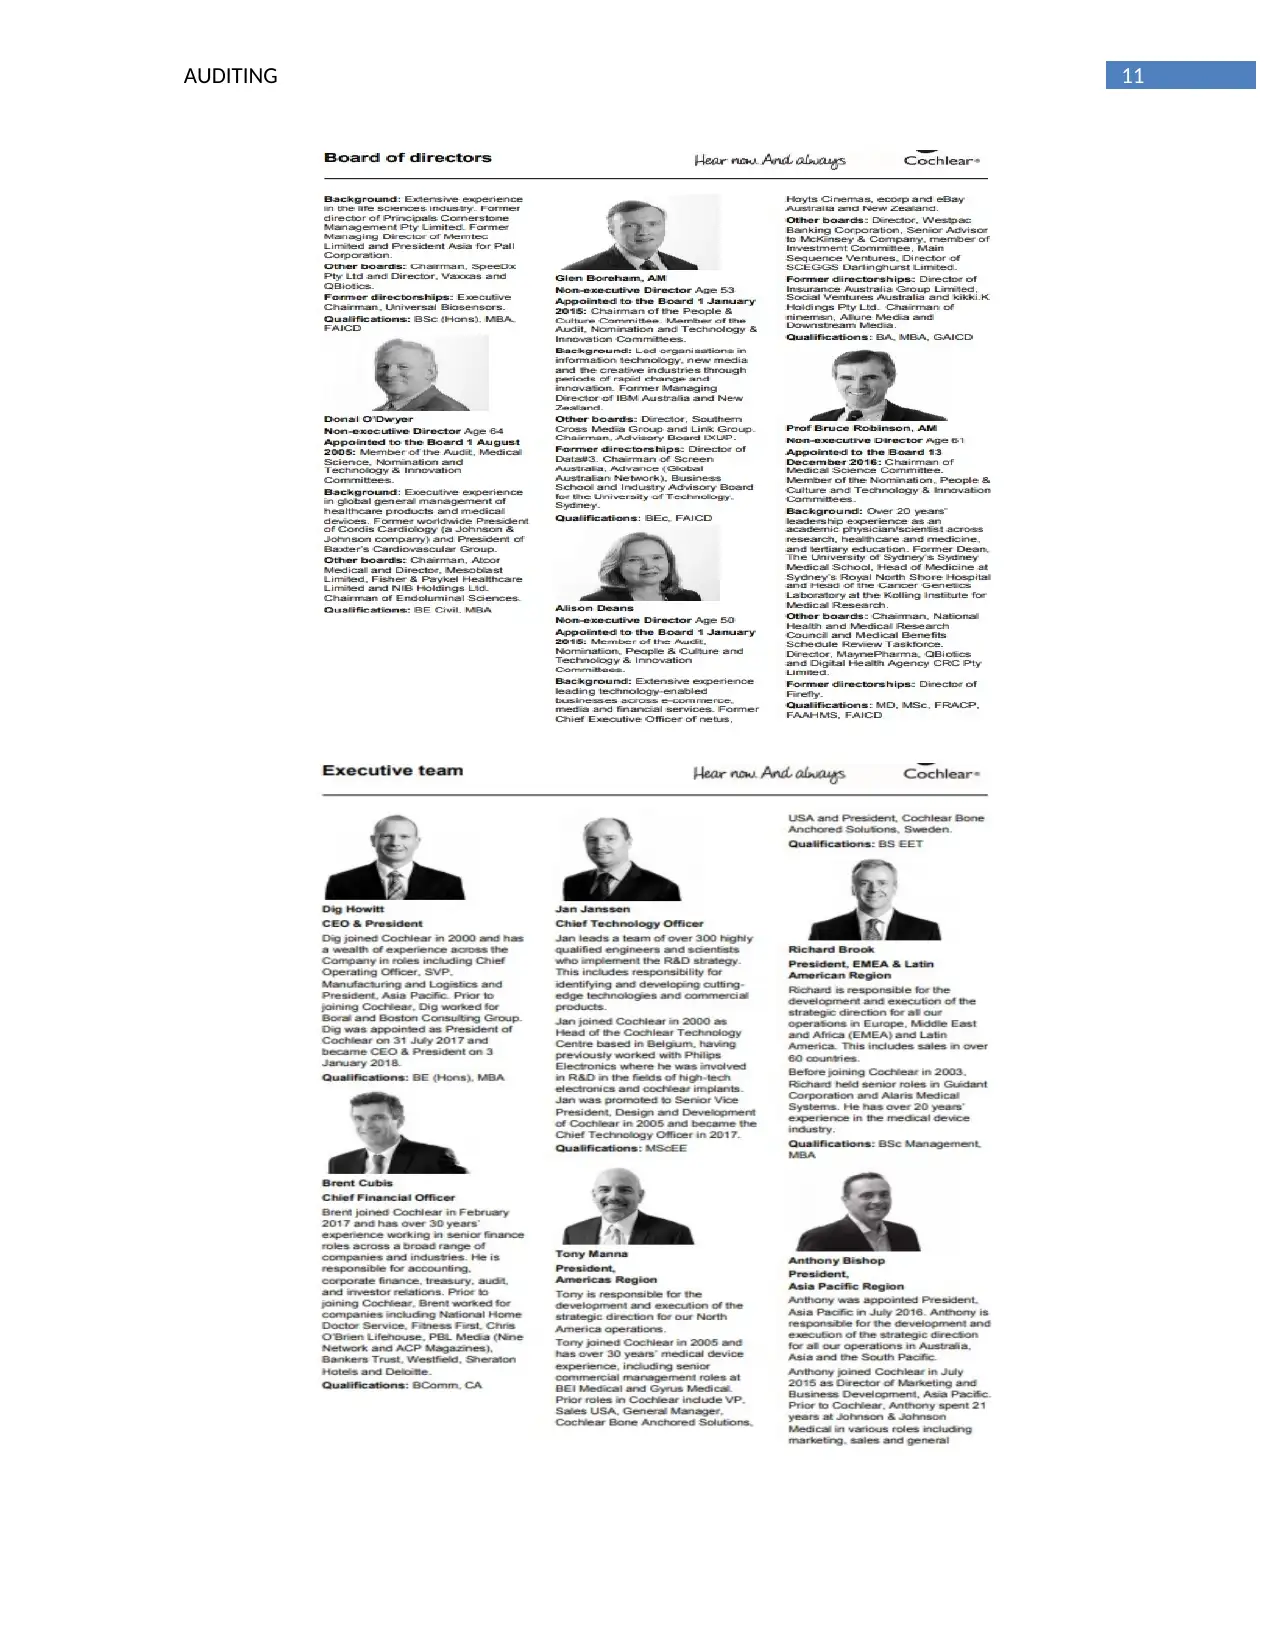
b. Management’s Experience, Knowledge and Changes during the Period: It needs to be
mentioned that the Board of Directors of Cochlear Limited consists of both executive and non-
executive directors. Their details can be seen from the following tables. It can be seen from the
below figures that both the executive as well as non-executive directors of the company posses
the required skills, knowledge and experience that make them perfect for these positions. It
implies that all these aspects are above the satisfying level. Hence, the inherent risk related to
this aspect is low for Cochlear Limited (cochlear.com, 2018).
Risk of Material Misstatements (Inherent Risk) at the Financial Report Level
The following discussion analyzes that inherent risk of material misstatements of Cochlear
Limited at financial report level based on five specific parameters:
a. Integrity of Management: It can be observed from the 2018 Annual Report of Cochlear Limited
that all the directors in the Board obtain high level of knowledge, experience, skill set and
goodwill in the industry. They comply with all the regulations and standards of corporate
governance with the aim to eliminate fraudulent and illegal activities in the business operations.
In addition, some independent directors are responsible for overseeing the operations of some
committees (cochlear.com, 2018). Thus, it can be said in the presence of all these aspects that
inherent risk is low in this case.
b. Management’s Experience, Knowledge and Changes during the Period: It needs to be
mentioned that the Board of Directors of Cochlear Limited consists of both executive and non-
executive directors. Their details can be seen from the following tables. It can be seen from the
below figures that both the executive as well as non-executive directors of the company posses
the required skills, knowledge and experience that make them perfect for these positions. It
implies that all these aspects are above the satisfying level. Hence, the inherent risk related to
this aspect is low for Cochlear Limited (cochlear.com, 2018).
11AUDITING
⊘ This is a preview!⊘
Do you want full access?
Subscribe today to unlock all pages.
Trusted by 1+ million students worldwide
1 out of 18
Related Documents


Your All-in-One AI-Powered Toolkit for Academic Success.
+13062052269
info@desklib.com
Available 24*7 on WhatsApp / Email
![[object Object]](/_next/static/media/star-bottom.7253800d.svg)
Unlock your academic potential
Copyright © 2020–2026 A2Z Services. All Rights Reserved. Developed and managed by ZUCOL.