Exploring Future Trends: Augmented Analytics and Business Reporting
VerifiedAdded on 2023/06/10
|17
|4055
|201
Report
AI Summary
This report highlights the future trends of business intelligence, focusing on Augmented Analytics and Redefined Business Reporting. Augmented analytics, also known as ‘smart data discovery,’ aids in analyzing organizational challenges and assessing business progress. Redefined business reporting, or enterprise reporting, focuses on making business and financial data public. The report details the advantages and applications of both augmented analytics, such as improved accountability and accurate business predictions, and redefined business reporting, including maintaining data quality and enhancing decision-making. It also touches upon the role of AI in business reporting and how it complements the work of managers, providing insights into both the positive and negative aspects of business performance.
Running head: TENDENCIES OF FUTURE OF BUSINESS INTELLIGENCE
Tendencies of Future of Business Intelligence
Name of the Student
Name of the University
Author Note
Tendencies of Future of Business Intelligence
Name of the Student
Name of the University
Author Note
Paraphrase This Document
Need a fresh take? Get an instant paraphrase of this document with our AI Paraphraser
1TENDENCIES OF FUTURE OF BUSINESS INTELLIGENCE
Executive Summary
In this business report, the future trends of business intelligence are highlighted. The two most
important future trends are “Augmented Analytics” and “Redefined Business Reporting”.
Augmented analytics is the concept of ‘smart data discovery’ which is used for analyzing the
ongoing challenges in the organization. This is used to assess the business data to find whether or
not the business is progressing. Another future tendency identified is redefined business
reporting which also known as enterprise reporting and is a process to make the public aware of
the business data and financial data published by a company. This report also highlights the
advantage and application of augmented analytics and redefined business reporting.
2TENDENCIES OF FUTURE OF BUSINESS INTELLIGENCE
Table of Contents
1.0 Introduction......................................................................................................................................3
2.0 Discussion........................................................................................................................................4
2.1 Augmented Analytics..................................................................................................................4
2.1.1 Advantage of augmented analytics.......................................................................................5
2.1.2 Application of Augmented Analytics...................................................................................6
2.2 Redefined Business Reporting.....................................................................................................7
2.2.1 Advantages of Business intelligence in business reporting..................................................9
2.2.2 Application of business intelligence in business reports....................................................10
2.2.3 Example of business intelligence and reporting tools........................................................12
3.0 Conclusion.....................................................................................................................................13
4.0 Reference List................................................................................................................................14
⊘ This is a preview!⊘
Do you want full access?
Subscribe today to unlock all pages.
Trusted by 1+ million students worldwide
3TENDENCIES OF FUTURE OF BUSINESS INTELLIGENCE
1.0 Introduction
Business Intelligence has become an inevitable aspect in every organization as it helps in
enhancing the productivity of the company, estimate the sales demands, keeping accurate track
of information regarding established goals, attaining better strategic awareness and transforming
data into actionable information (Chen, Chiang & Storey, 2012). This is the reason that business
people have opted for business intelligence in order to attain greater competitive advantage and
keep track for the future trends. This business report highlights two of the major tendencies for
the future of Business Intelligence- “Augmented Analytics” and “Redefined Business
Reporting”. Duan and Da Xu (2012) stated that businessperson emphasized changes in business
analytics to gain more benefits compared to other competitor organizations.
As per as the definition goes, augmented analytics is an approach that automates all the
data insight by means of machine language and natural language (Loshin, 2012). Chang (2014)
also stated that the insight of the language also automates the data preparation and allow the
system to share data. This process will help the marketers to represent effective and clear result
which will furthermore allow the users to manipulate the data accurately and quickly. Sauter
(2014) furthermore depicted that augmented analytics allow the people of IT department of an
organization to focus on strategic issues and helps them to make better decisions for earning
greater financial profitability. On the other hand, people in the managerial position spend a
significant proportion of their office time for controlling task and coordinating administrative
works (Zheng, Fader and Padmanabhan, 2012). These people are also involved with judgmental
works and suggest important business decisions for enhancing the process. Thus, incorporating
Paraphrase This Document
Need a fresh take? Get an instant paraphrase of this document with our AI Paraphraser
4TENDENCIES OF FUTURE OF BUSINESS INTELLIGENCE
of the business intelligence does not only help management people to work faster but also
accurately.
2.0 Discussion
In this section, the two major tendencies for the future of Business Intelligence is
discussed are “Augmented Analytics” and “Redefined Business Reporting”.
2.1 Augmented Analytics
Zheng, Fader and Padmanabhan (2012) stated that in recent times when all the business
needs data and store them in the database. Zhong et al. (2017) furthermore stated that company
nowadays focuses more on work automation according to their business objectives and goals and
thus utilizes the concept of business analytics for building models and integrating data. In the
year 2017, the concept of ‘smart data discovery’ has been introduced, which is used for
analyzing the ongoing challenges in the organization. The management people from the IT
department of a company can analyze the data and identify issues and patterns which will help
them to identify any discrepancy. It is highlighted that smart data discovery can also be handled
by a person, who does not have any computer programming knowledge (Linkedin, 2018). This
technology can be handled in a drag and drop interface and does not need knowledge of any
algorithm and statistical analysis (Linkedin, 2018). Utilizing this technology, Smart Data
Discovery tools allow users to share findings which will furthermore help in forecasting and
predicting results for organizational resource planning (Linkedin, 2018). Chang (2014) presented
a statement that in traditional days, in order to perform these tasks, data scientist were hired;
however, in recent times, augmented analytics works as an alternative to these skilled data
scientists. Trained employees can easily perform the data monitoring and then develop building
5TENDENCIES OF FUTURE OF BUSINESS INTELLIGENCE
models for planning actions (Duan & Da Xu, 2012). Thus, it can be said that data-based decision
can be easily taken by the management people and it is also easier for them to release whether or
not their company is progressing.
2.1.1 Advantage of augmented analytics
Focusing on strategic issues
Turban et al. (2013) highlighted that with the help of augmented analytics clear data can
be evaluated with greater efficiency which will help the data scientists for drawing the data
outcome. These outcomes are sufficient to track the progress of the company.
Improves accountability
Augmented analytics enhances the empowerment as all the progress can be tracked with
accuracy. This will help the organization to identify the drawbacks and the downturns. Chang
(2014) thus stated that a company is liable for taking effective steps for overcoming the
adversity.
Positive impact on ROI and TCO
Smart Data Discovery unlocks deeper business data and can identify the underperforming
products segments and more profitable customer group segments (Zhong et al., 2017). This
happens as Smart Data Discovery tools automatically identify the relationship among the data
like clusters and co-relations and then helps the marketers to present a better preview of the
business progress.
Accurate business predictions
Lim, Chen and Chen (2013) depicted that this tools also allows making insights and make
them accessible via visualizations like exactly what percentage of people like a particular
product and how many users belong from a similar group. Chang (2014) also portrays that this
⊘ This is a preview!⊘
Do you want full access?
Subscribe today to unlock all pages.
Trusted by 1+ million students worldwide
6TENDENCIES OF FUTURE OF BUSINESS INTELLIGENCE
data analysis will help the marketers to forecast business predictions that can be used in
developing new business plans and product development. Laursen and Thorlund (2016)
furthermore stated that not only the augmented analytics is used in identifying the business
progress but it also helps in determining the market trends. Taken for instance, if the revenue
shows a declination of 15%, the data obtained can be evaluated to assess whether the data reveals
loss in business or decrease in the market demand for that products or service.
2.1.2 Application of Augmented Analytics
Agile centralized business intelligence
Collier (2012) stated that this tool is used especially for the companies that use cloud
technology. These companies are dealing with greater data and it is important for them to know
whether or not their business is in a profitable position. Augmented analytics helps the new
generation businesspersons to enable the data analytics delivery at a faster rate while utilizing
minimal resources.
Training purpose
Training through the digital technology resulted in a greater understanding. Taken for
instance, medical training can be given by a surgeon, who is performing a severe operation and
can share the experience with other doctors outside the operation theatre through AR display
unit. Google Glass, is one such attempt (Dataversity, 2018).
Agricultural directions
AR technologies are now performing well also in agriculture. The farmers can now
access the water management systems and sensor drive that alerts them concerning the excessive
utilization of water resources (Dataversity, 2018). Some of the other application of the
Paraphrase This Document
Need a fresh take? Get an instant paraphrase of this document with our AI Paraphraser
7TENDENCIES OF FUTURE OF BUSINESS INTELLIGENCE
augmented analytics in agriculture is to monitor the water usage, moisture content and
temperature of the soil and crop status.
Head-up displays (HUD)
Head-up displays (HUD) is an application of augmented analytics that helps military
pilots to view vital information by not compromising their sight (Telegraph, 2018). HUD is a
transparent screen showing the details of location and state of the aircraft and thus allows the
pilot to not look down at their controls. Haeuslschmid et al. (2016) stated that the first
application of this concept was used during the Second World War but the application at that
time was difficult because it is difficult to locate targets depending on the verbal instructions of
the crew members.
2.2 Redefined Business Reporting
According to Laursen and Thorlund (2016), business reporting is classified into two
different ways that are present the report through summarization of the organizational output and
the second one is to use an illustration like visualization features, cross-tab reports and data
tables. In the first case, organization segregate working personnel, who is recruited for preparing
the report, enhancement of the report in collaboration with people like developers and then
preparing the reports manually. However, in the latter case, tools such as business intelligence
are used. Laursen and Thorlund (2016) highlighted that managers of different companies are
associated with work that is developing engagement with different stakeholders, implementing
strategy and innovation, coordinating and controlling administrative works and helping in
solving problems.
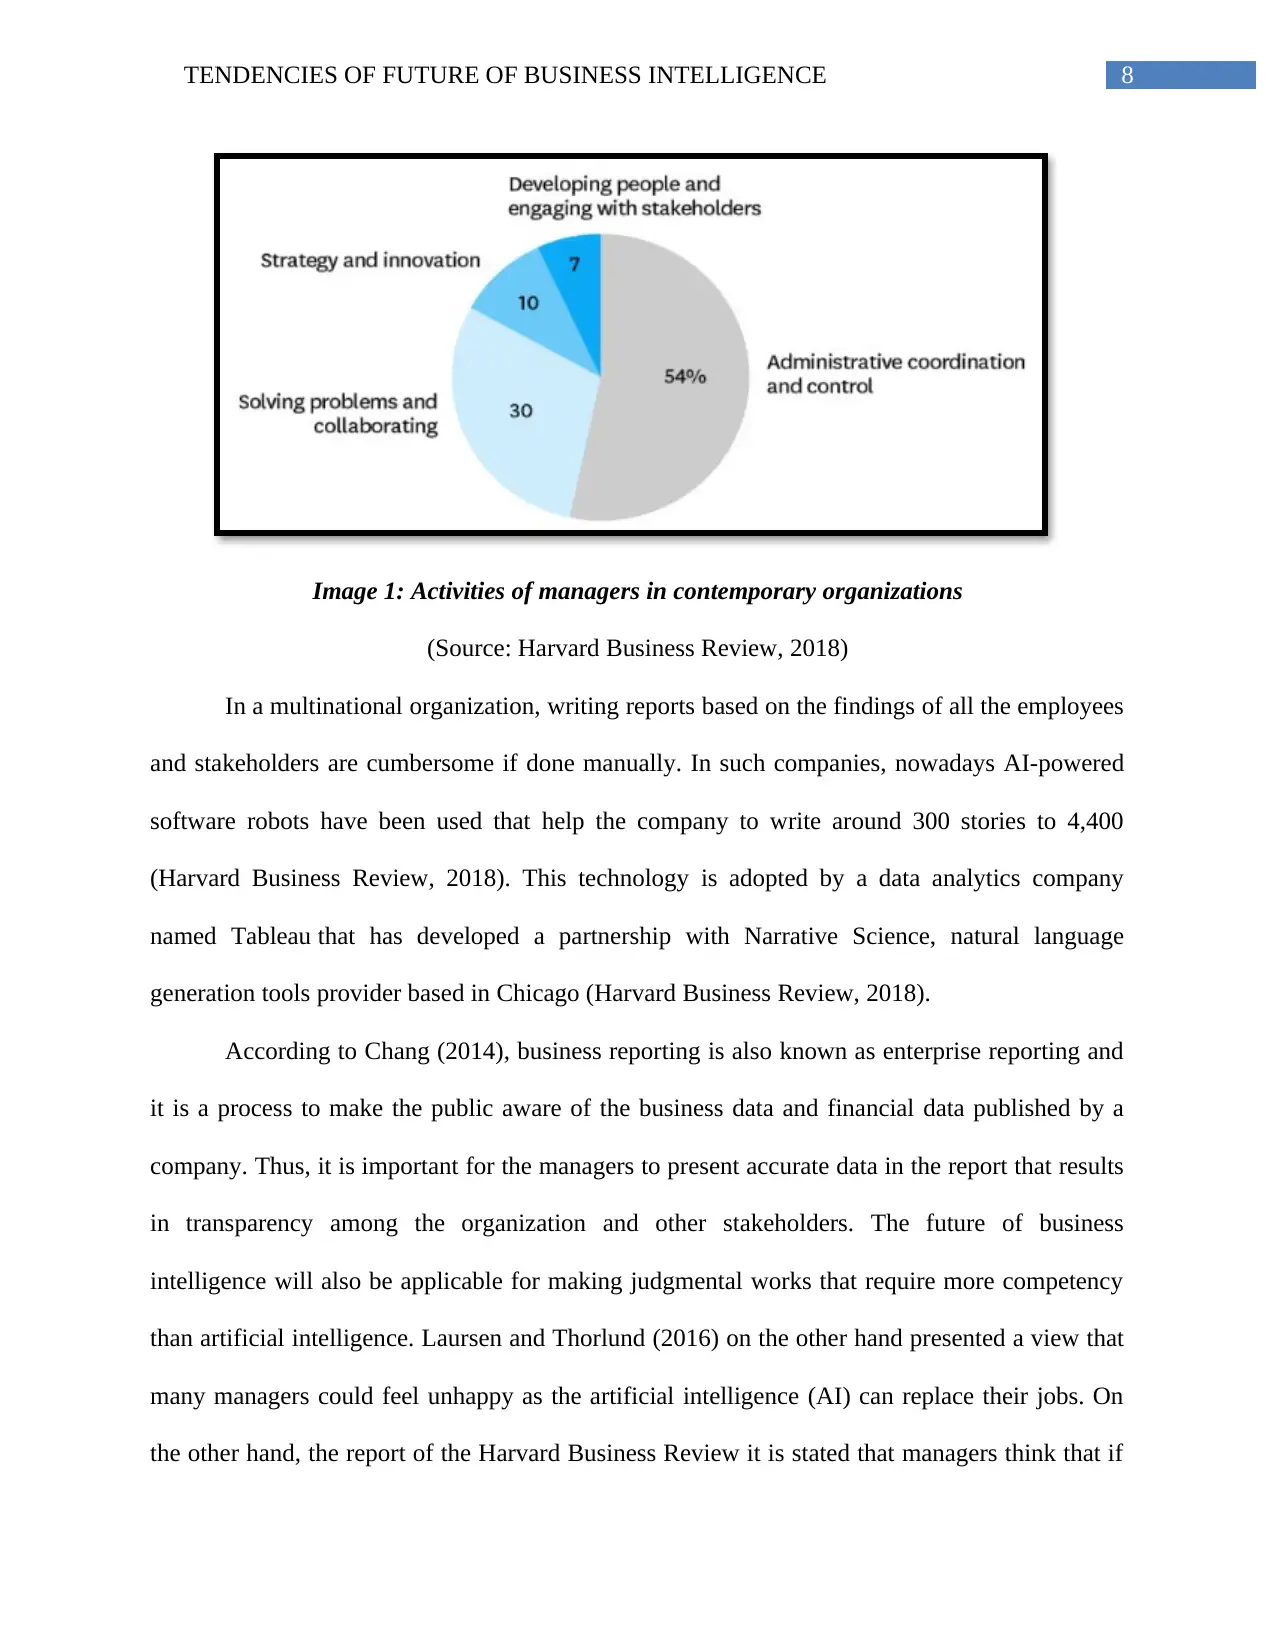
8TENDENCIES OF FUTURE OF BUSINESS INTELLIGENCE
Image 1: Activities of managers in contemporary organizations
(Source: Harvard Business Review, 2018)
In a multinational organization, writing reports based on the findings of all the employees
and stakeholders are cumbersome if done manually. In such companies, nowadays AI-powered
software robots have been used that help the company to write around 300 stories to 4,400
(Harvard Business Review, 2018). This technology is adopted by a data analytics company
named Tableau that has developed a partnership with Narrative Science, natural language
generation tools provider based in Chicago (Harvard Business Review, 2018).
According to Chang (2014), business reporting is also known as enterprise reporting and
it is a process to make the public aware of the business data and financial data published by a
company. Thus, it is important for the managers to present accurate data in the report that results
in transparency among the organization and other stakeholders. The future of business
intelligence will also be applicable for making judgmental works that require more competency
than artificial intelligence. Laursen and Thorlund (2016) on the other hand presented a view that
many managers could feel unhappy as the artificial intelligence (AI) can replace their jobs. On
the other hand, the report of the Harvard Business Review it is stated that managers think that if
⊘ This is a preview!⊘
Do you want full access?
Subscribe today to unlock all pages.
Trusted by 1+ million students worldwide
9TENDENCIES OF FUTURE OF BUSINESS INTELLIGENCE
AI can be used in making effective decisions, they should support them in suggesting new plans
for the betterment of the company rather than replacing them. The report on the other hand also
stated that AI also allows the managers to enable the interaction with intelligent machines.
Ramakrishnan, Jones and Sidorova (2012) moreover stated that one of the most important
work roles of the managers is to harness others’ creativity. The importance of the managers can
be well witnessed in bringing together the diverse ideas and integrate them for developing
workable and appealing solutions (Harvard Business Review, 2018). Thus, with the AI, these
managers will embed the design thinking for reporting the business reports. It can be also said
that the findings of the augmented data highlight all the necessary results and all the negative and
positive aspects of the business. This will help the managers to present the final outcome in
tabular or pictorial form, which is easily understandable by the other users.
2.2.1 Advantages of Business intelligence in business reporting
Maintaining the data quality of the business report
It is highlighted that since 2002 one of the major problem if the Business Intelligence
(BI) software highlighted by the managers is the quality of the data (Lim, Chen & Chen, 2013).
Thus, the outcome of the findings is that if organization’s core data cannot be trustable and
erroneous, any implications derived from the data will also be incorrect. Thus, data scientists are
aiming to bring data together from data silos. These data from different sources is then compiled
by the AI in a usable format by maintaining the validity of the original source of the data
(Clicdata, 2018).
Ease in collecting the data for the report
Turban et al. (2013) stated that with the help of the Business Intelligence, managers can
collect data not only within the organization but also from outside of the company. Zheng, Fader
Paraphrase This Document
Need a fresh take? Get an instant paraphrase of this document with our AI Paraphraser
10TENDENCIES OF FUTURE OF BUSINESS INTELLIGENCE
and Padmanabhan (2012) furthermore stated that the data found from the analysis of the inner
and outer data results are better findings of the loopholes. Thus, the managers will also able to
develop effective strategies for the betterment of the company.
Representing ready to use data
The use of business intelligence is used to find the relevant data and also track the past data for a
better finding of the progress made by the company. Wixom, Yen and Relich (2013) stated that
in present times also, BI is used to collect and present data that can be analyzed easily including
historical data. It is easier for a manager to track the similar data based on a time span and then
assess the progress.
Empowering end-users
The advanced business reporting presents all the data and underlying figures. The report
analysis made by the management people along with the developed backup actions, allow the
users to identify the link between the data and action. Thus, it empowers the users to understand
the different areas of business and proper justification of the explanation of the taken business
decisions.
2.2.2 Application of business intelligence in business reports
Performing as an analytics
Business Intelligence can discover data from different sources and shows the relationship
among them in an effective manner. Companies use this technology in order to demonstrate their
data which furthermore allow the management people to explore new business possibilities
(Sisense, 2018). Taken for instance, a supply chain service provider or an organization that has a
supply chain management unit can implement the BI for evaluating their shipping performance.
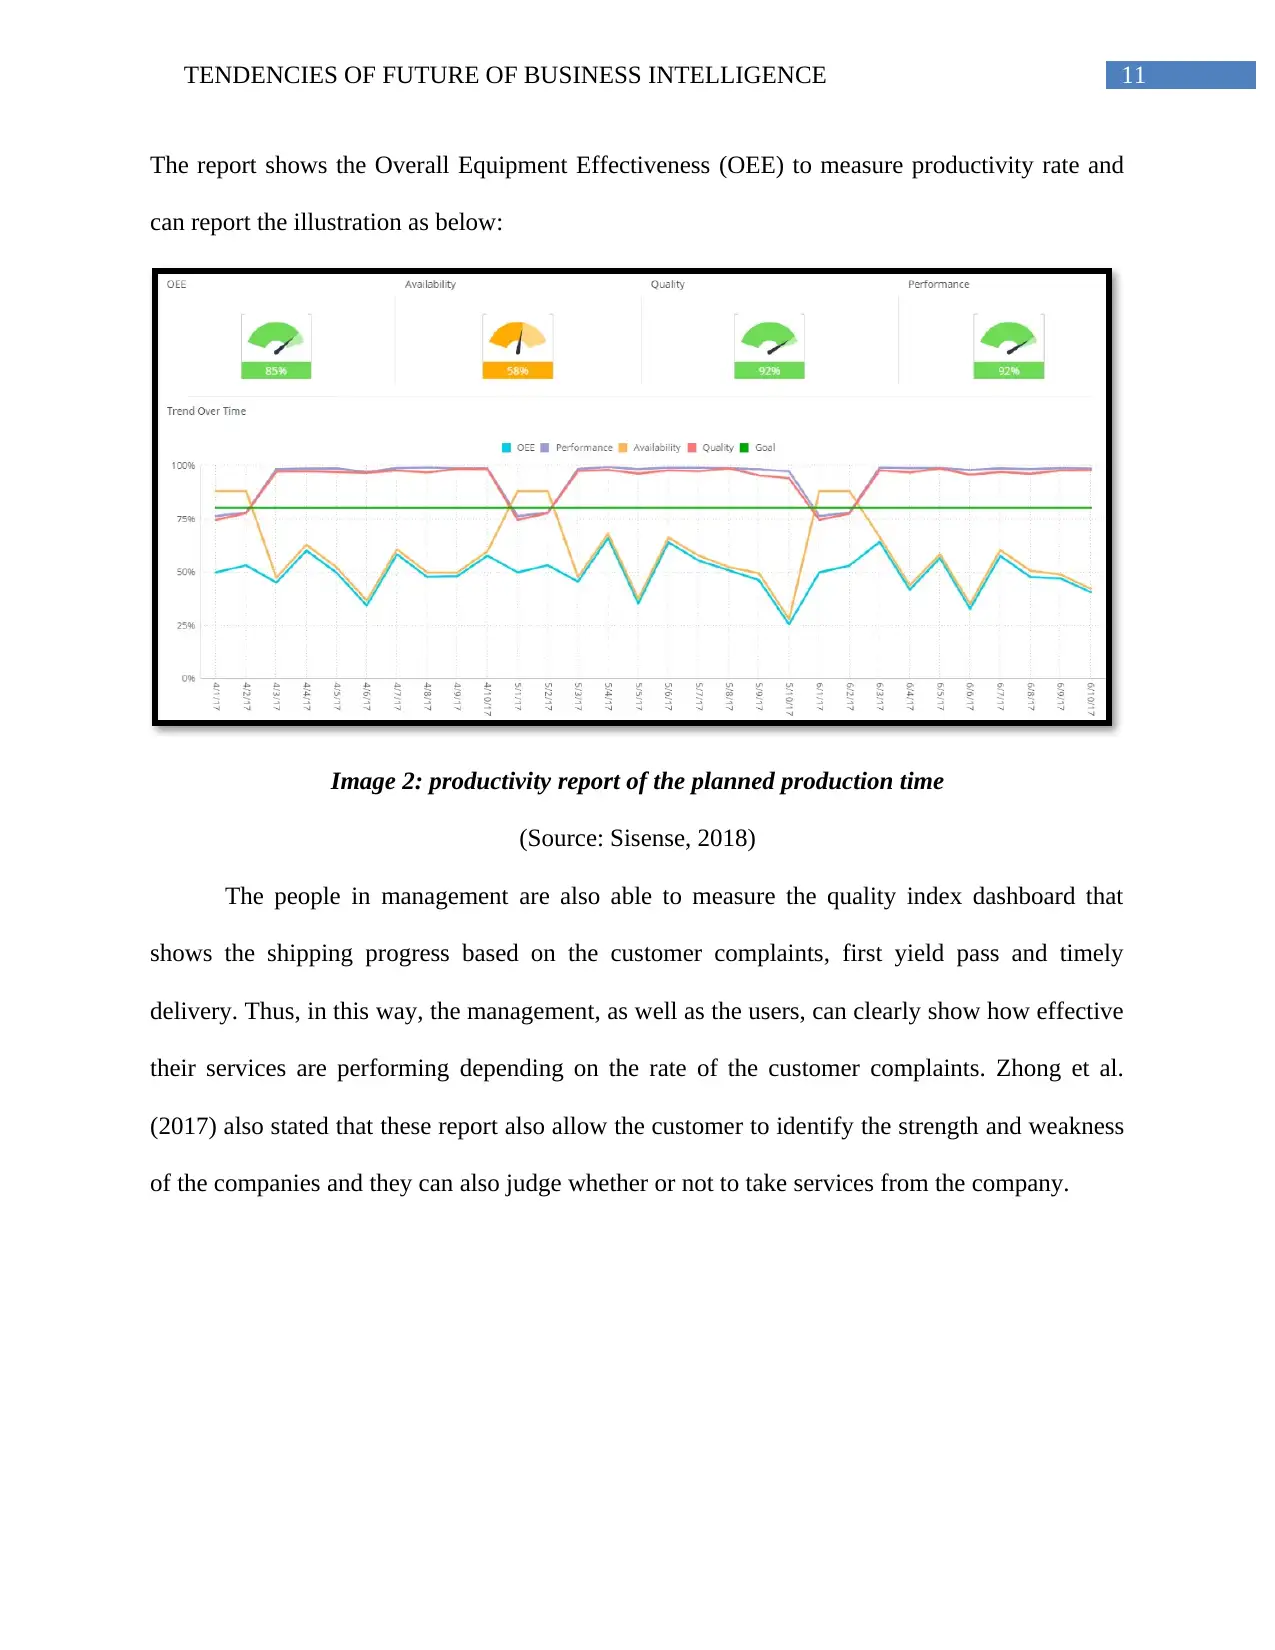
11TENDENCIES OF FUTURE OF BUSINESS INTELLIGENCE
The report shows the Overall Equipment Effectiveness (OEE) to measure productivity rate and
can report the illustration as below:
Image 2: productivity report of the planned production time
(Source: Sisense, 2018)
The people in management are also able to measure the quality index dashboard that
shows the shipping progress based on the customer complaints, first yield pass and timely
delivery. Thus, in this way, the management, as well as the users, can clearly show how effective
their services are performing depending on the rate of the customer complaints. Zhong et al.
(2017) also stated that these report also allow the customer to identify the strength and weakness
of the companies and they can also judge whether or not to take services from the company.
⊘ This is a preview!⊘
Do you want full access?
Subscribe today to unlock all pages.
Trusted by 1+ million students worldwide
1 out of 17
Related Documents


Your All-in-One AI-Powered Toolkit for Academic Success.
+13062052269
info@desklib.com
Available 24*7 on WhatsApp / Email
![[object Object]](/_next/static/media/star-bottom.7253800d.svg)
Unlock your academic potential
Copyright © 2020–2026 A2Z Services. All Rights Reserved. Developed and managed by ZUCOL.