Aurizon Holding Limited: Corporate Finance Report, MBA 610 Analysis
VerifiedAdded on 2022/08/21
|11
|845
|15
Report
AI Summary
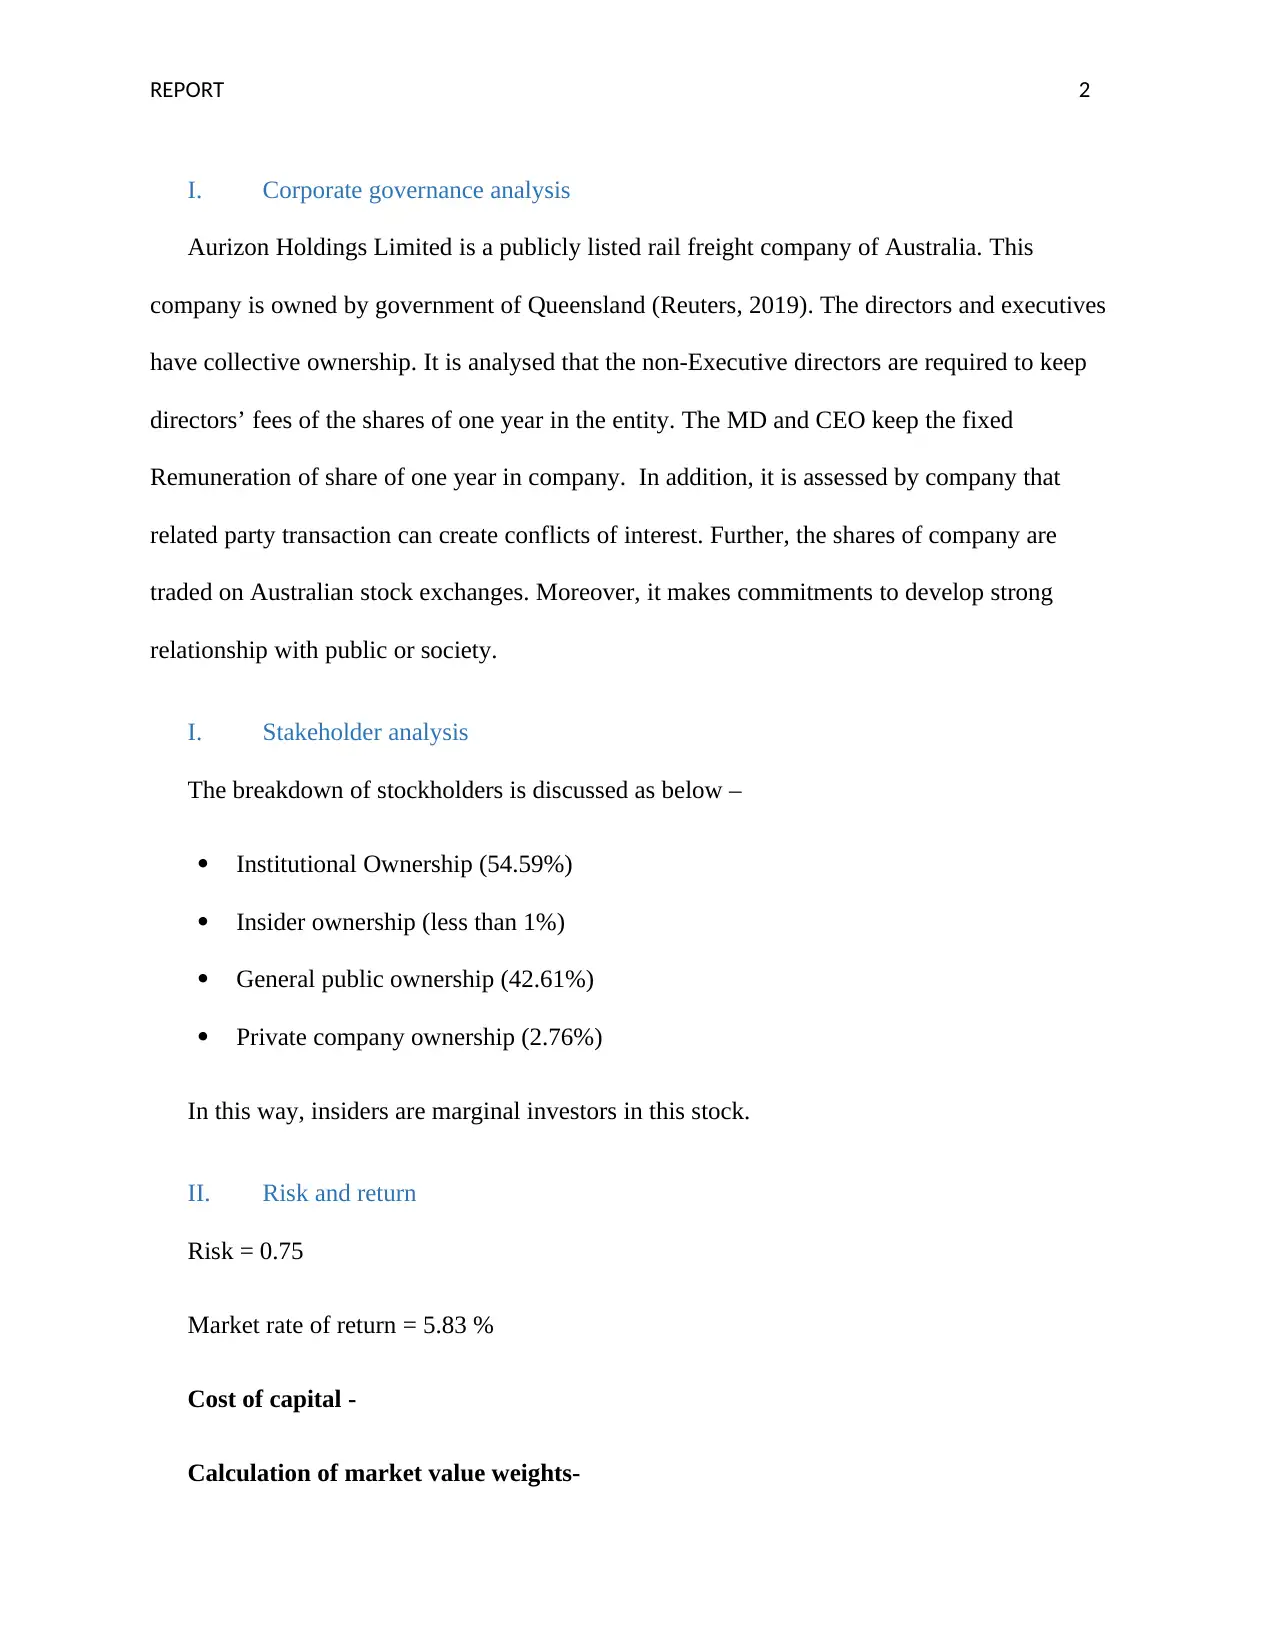
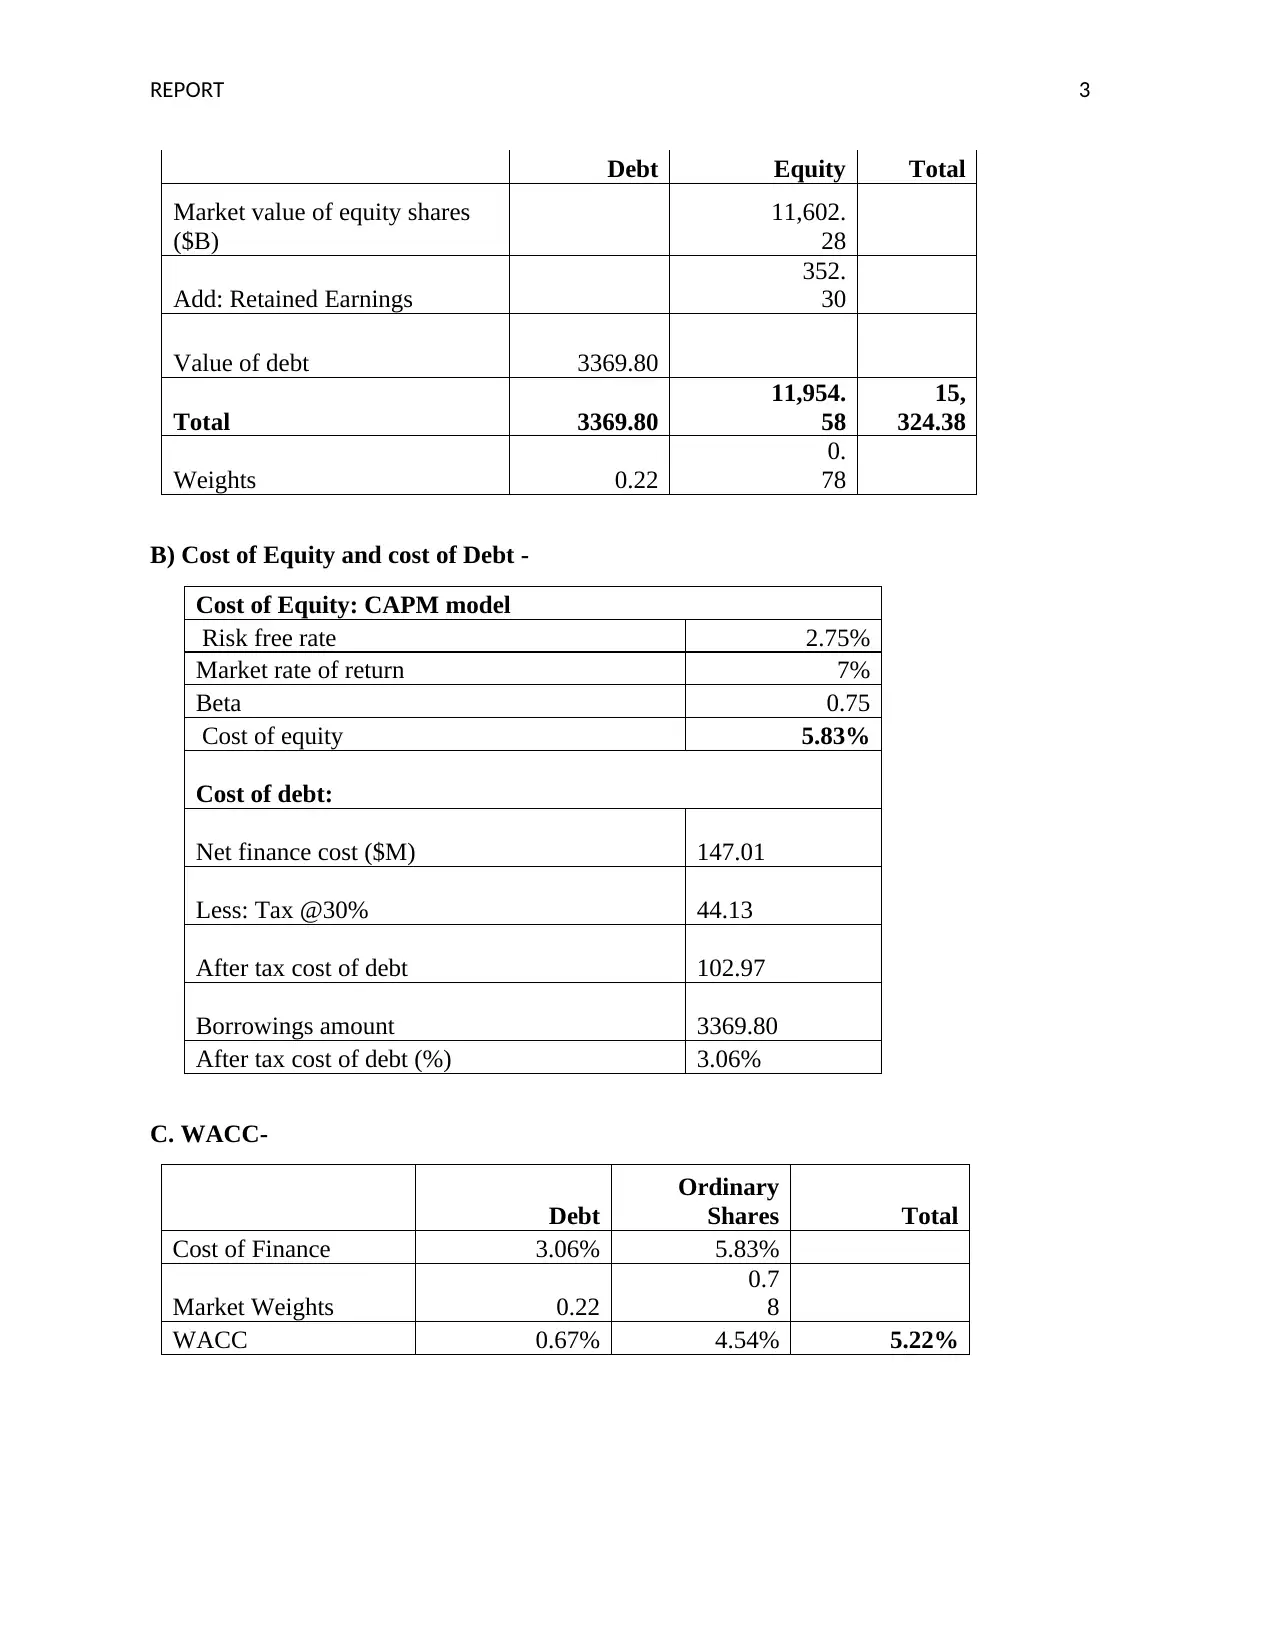
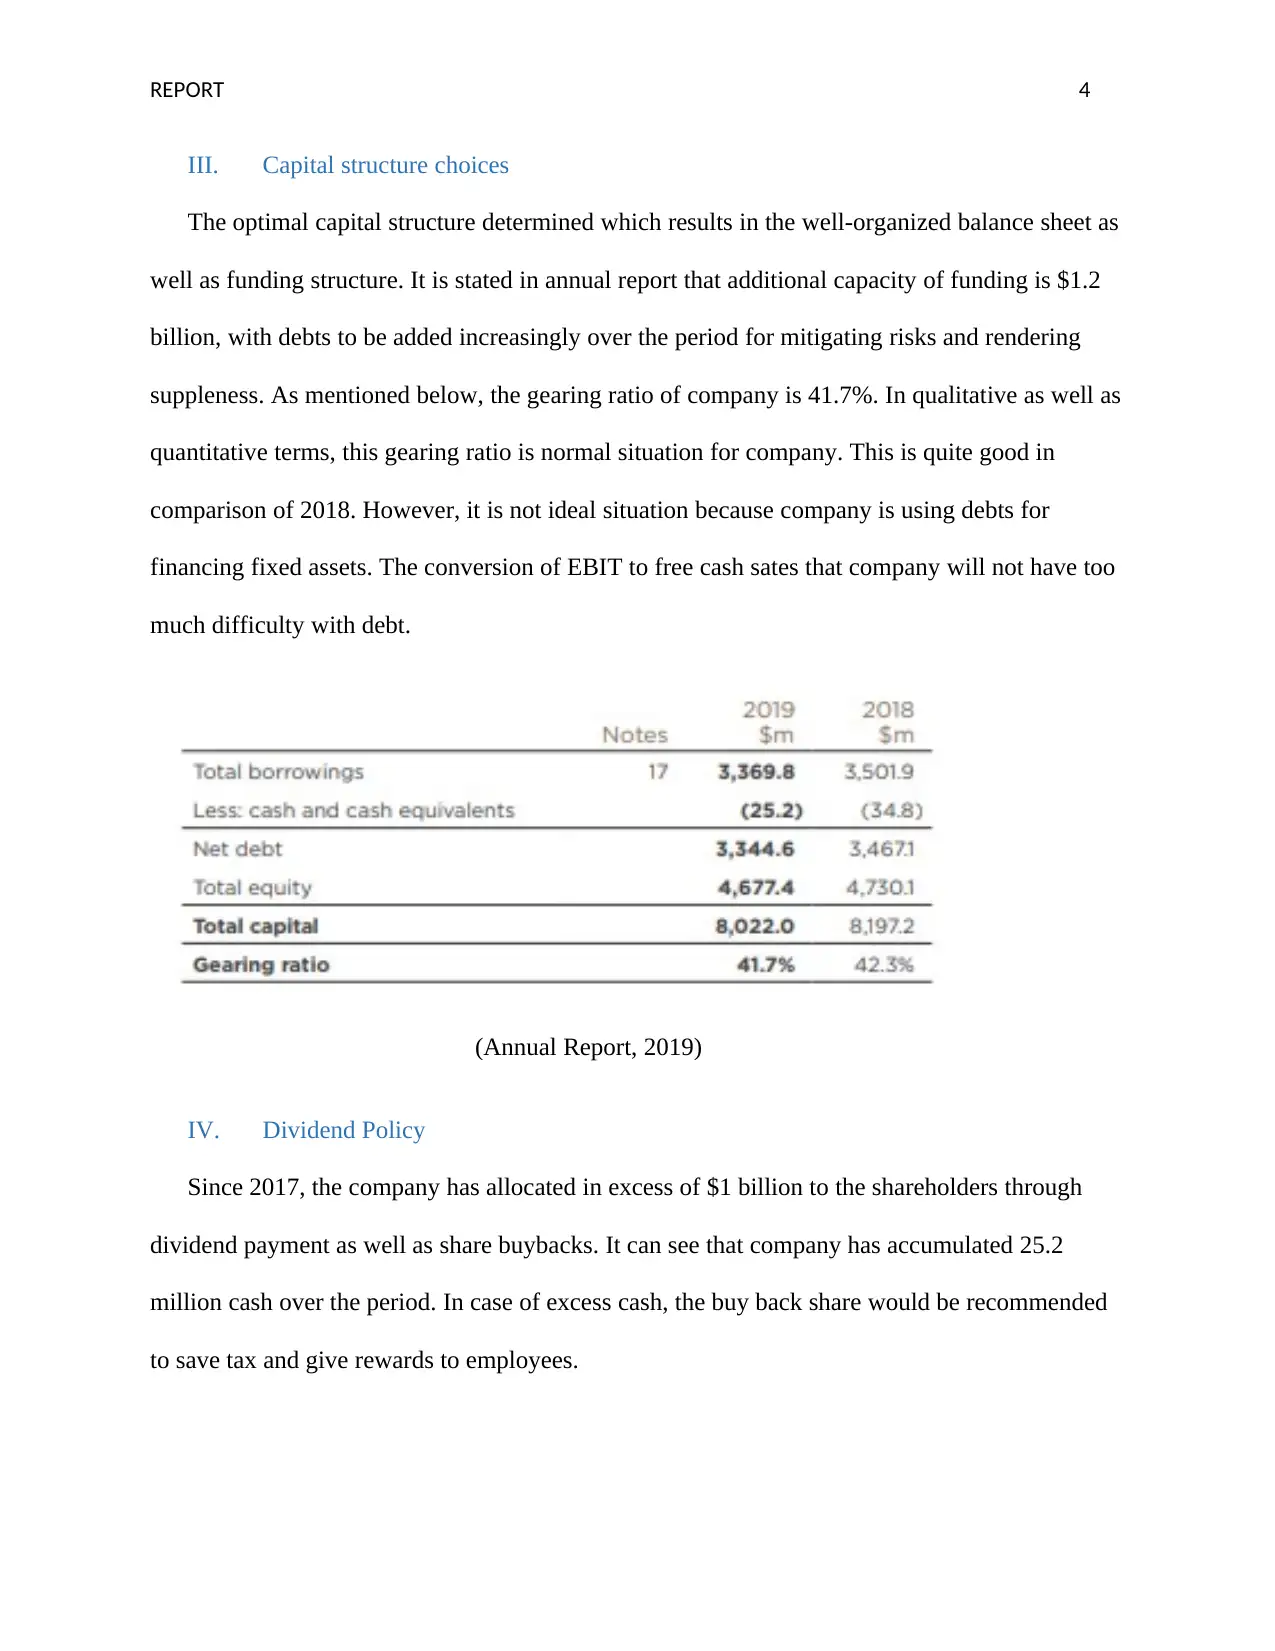
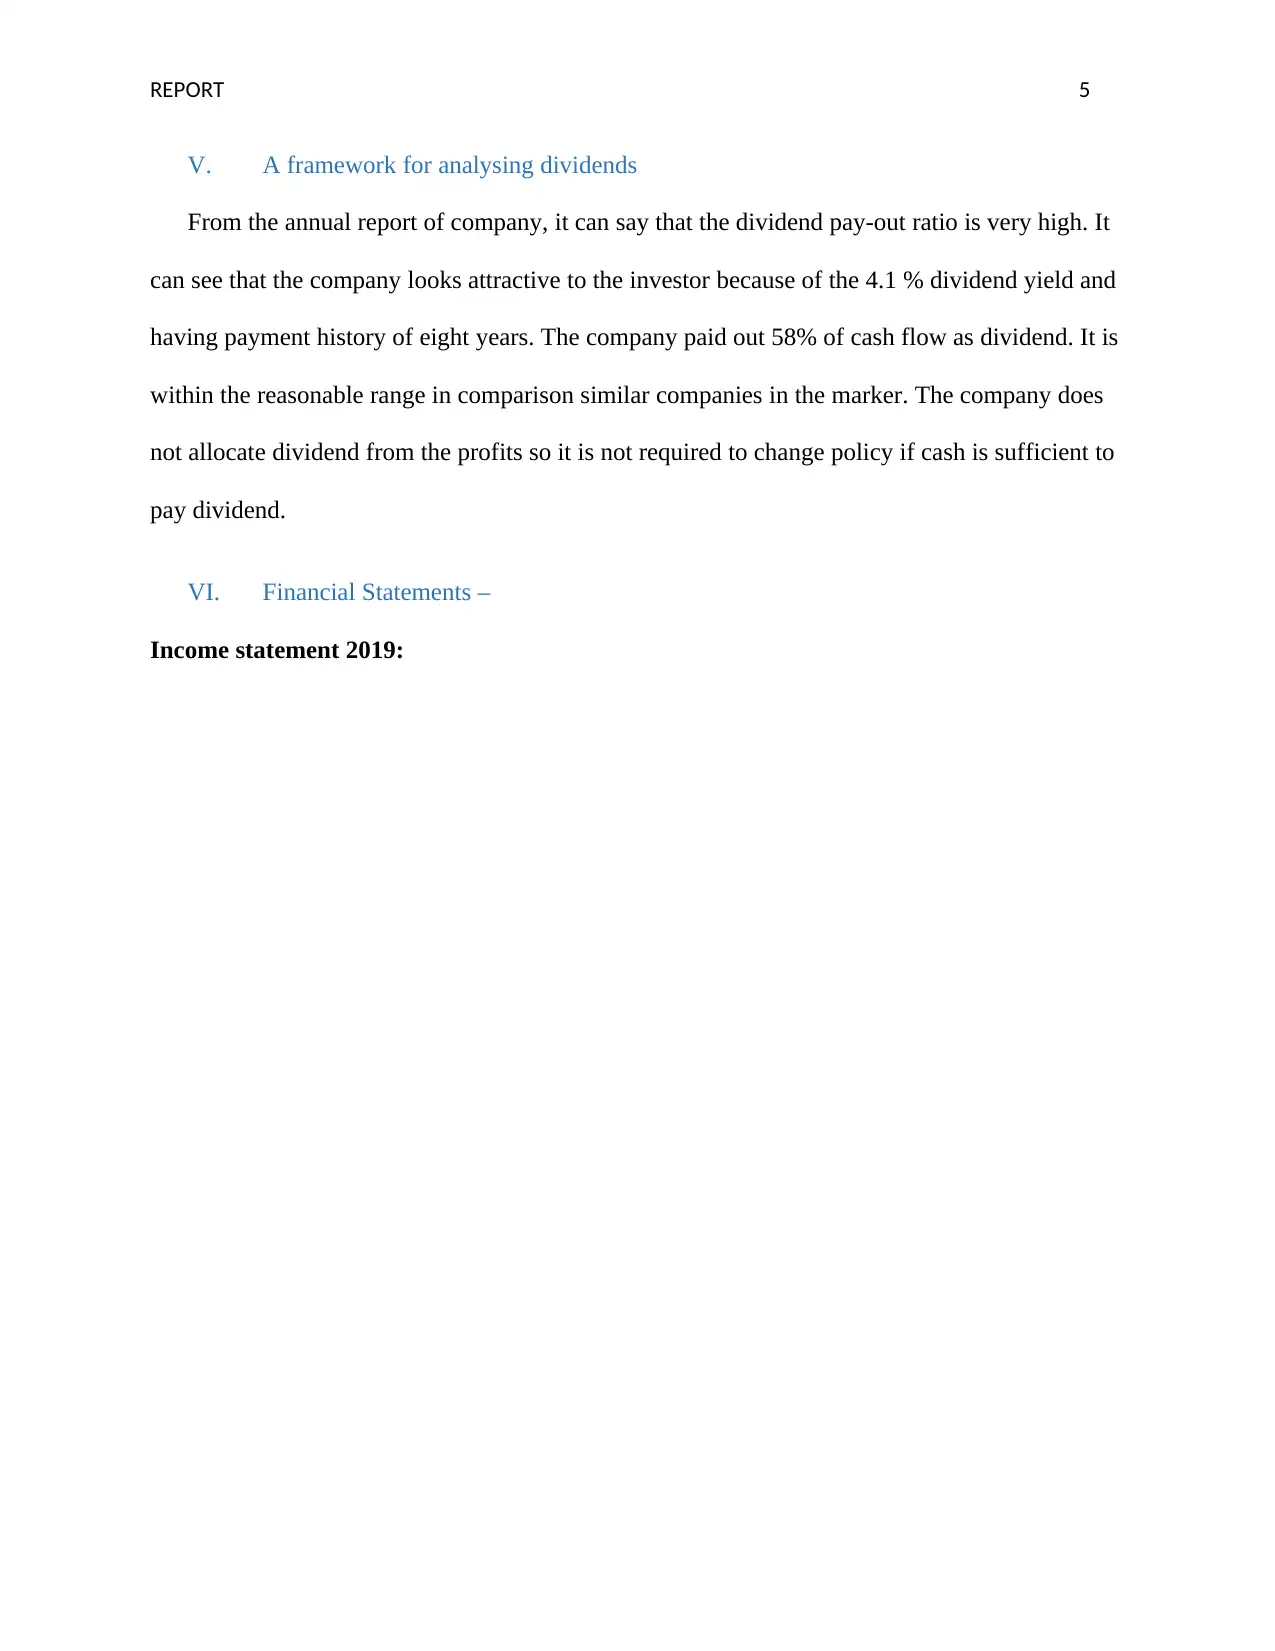
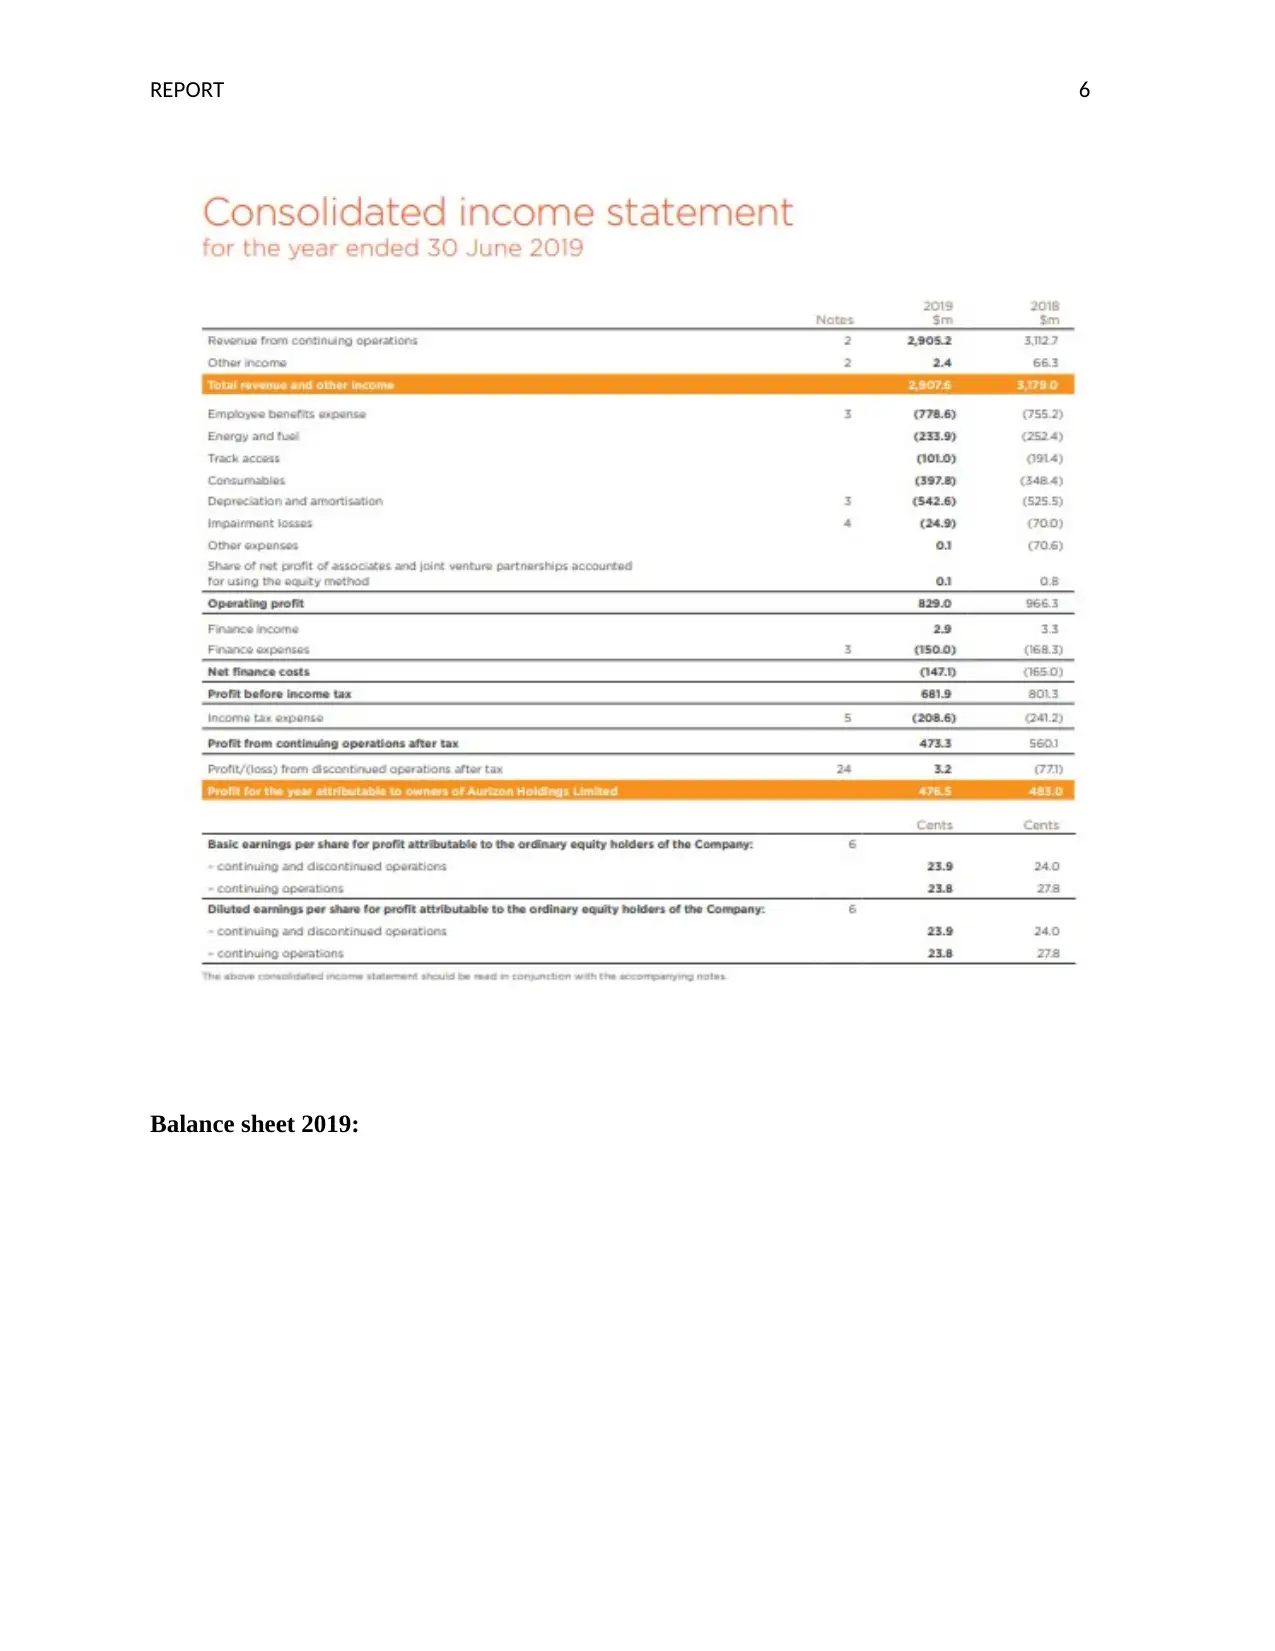
This report provides a detailed corporate finance analysis of Aurizon Holdings Limited. It begins with an overview of the company's corporate governance, highlighting the separation between management and ownership, potential conflicts of interest, and its interaction with financial markets. A tho...
Read More
Contribute Materials
Your contribution can guide someone’s learning journey. Share your
documents today.

Running head: REPORT 0
CORPORATE FINANCE MBA 610
Aurizon Holding Limited
MARCH 17, 2020
STUDENT DETAILS
CORPORATE FINANCE MBA 610
Aurizon Holding Limited
MARCH 17, 2020
STUDENT DETAILS
Secure Best Marks with AI Grader
Need help grading? Try our AI Grader for instant feedback on your assignments.

REPORT 1
Contents
I. Corporate governance analysis............................................................................................................2
I. Stakeholder analysis............................................................................................................................2
II. Risk and return....................................................................................................................................2
III. Capital structure choices..................................................................................................................4
IV. Dividend Policy...............................................................................................................................5
V. A framework for analysing dividends..................................................................................................5
VI. Financial Statements –.....................................................................................................................6
References.................................................................................................................................................11

REPORT 2
I. Corporate governance analysis
Aurizon Holdings Limited is a publicly listed rail freight company of Australia. This
company is owned by government of Queensland (Reuters, 2019). The directors and executives
have collective ownership. It is analysed that the non-Executive directors are required to keep
directors’ fees of the shares of one year in the entity. The MD and CEO keep the fixed
Remuneration of share of one year in company. In addition, it is assessed by company that
related party transaction can create conflicts of interest. Further, the shares of company are
traded on Australian stock exchanges. Moreover, it makes commitments to develop strong
relationship with public or society.
I. Stakeholder analysis
The breakdown of stockholders is discussed as below –
Institutional Ownership (54.59%)
Insider ownership (less than 1%)
General public ownership (42.61%)
Private company ownership (2.76%)
In this way, insiders are marginal investors in this stock.
II. Risk and return
Risk = 0.75
Market rate of return = 5.83 %
Cost of capital -
Calculation of market value weights-

REPORT 3
Debt Equity Total
Market value of equity shares
($B)
11,602.
28
Add: Retained Earnings
352.
30
Value of debt 3369.80
Total 3369.80
11,954.
58
15,
324.38
Weights 0.22
0.
78
B) Cost of Equity and cost of Debt -
Cost of Equity: CAPM model
Risk free rate 2.75%
Market rate of return 7%
Beta 0.75
Cost of equity 5.83%
Cost of debt:
Net finance cost ($M) 147.01
Less: Tax @30% 44.13
After tax cost of debt 102.97
Borrowings amount 3369.80
After tax cost of debt (%) 3.06%
C. WACC-
Debt
Ordinary
Shares Total
Cost of Finance 3.06% 5.83%
Market Weights 0.22
0.7
8
WACC 0.67% 4.54% 5.22%
Secure Best Marks with AI Grader
Need help grading? Try our AI Grader for instant feedback on your assignments.

REPORT 4
III. Capital structure choices
The optimal capital structure determined which results in the well-organized balance sheet as
well as funding structure. It is stated in annual report that additional capacity of funding is $1.2
billion, with debts to be added increasingly over the period for mitigating risks and rendering
suppleness. As mentioned below, the gearing ratio of company is 41.7%. In qualitative as well as
quantitative terms, this gearing ratio is normal situation for company. This is quite good in
comparison of 2018. However, it is not ideal situation because company is using debts for
financing fixed assets. The conversion of EBIT to free cash sates that company will not have too
much difficulty with debt.
(Annual Report, 2019)
IV. Dividend Policy
Since 2017, the company has allocated in excess of $1 billion to the shareholders through
dividend payment as well as share buybacks. It can see that company has accumulated 25.2
million cash over the period. In case of excess cash, the buy back share would be recommended
to save tax and give rewards to employees.

REPORT 5
V. A framework for analysing dividends
From the annual report of company, it can say that the dividend pay-out ratio is very high. It
can see that the company looks attractive to the investor because of the 4.1 % dividend yield and
having payment history of eight years. The company paid out 58% of cash flow as dividend. It is
within the reasonable range in comparison similar companies in the marker. The company does
not allocate dividend from the profits so it is not required to change policy if cash is sufficient to
pay dividend.
VI. Financial Statements –
Income statement 2019:

REPORT 6
Balance sheet 2019:
Balance sheet 2019:
Paraphrase This Document
Need a fresh take? Get an instant paraphrase of this document with our AI Paraphraser

REPORT 7
Cash flow statement 2019:

REPORT 8
Ratios:
Ratios Formula 2019
Liquidity ratios
Current ratio Current assets/current liabilities 0.78
Ratios:
Ratios Formula 2019
Liquidity ratios
Current ratio Current assets/current liabilities 0.78

REPORT 9
Quick Ratio
(Total current assets - Inventory) / Total current
liabilities 0.74
Average collection period Average receivables x 365 / Net credit sales 64.14
Profitability ratios
operating profit margin operating profit/total revenue 28.54%
Return on capital employed net operating profit/(Total assets-CL) 9.47%
Net profit margin Net profit/total sales 16.40%
Efficiency ratios
Asset turnover ratio Sales /average total assets 0.15
Fixed-Asset Turnover Ratio Sales / Total non-current assets 0.32
Gearing ratio
Debt ratio Total debt / Total assets 52%
Equity ratio Total equity / Total assets 48%
Secure Best Marks with AI Grader
Need help grading? Try our AI Grader for instant feedback on your assignments.

REPORT 10
References
Annual report (2019). Aurizon Holding Limited. Retrieved from:
https://www.aurizon.com.au/-/media/project/aurizon/files/investors/documents-and-webcasts/
2019/2019-full-year-results/aurizon-annual-report-2019.pdf
Reuters (2019). Aurizon Holdings Limited. Retrieved from:
https://www.reuters.com/finance/stocks/companyProfile/AZJ.AX
1 out of 11
Related Documents

Your All-in-One AI-Powered Toolkit for Academic Success.
+13062052269
info@desklib.com
Available 24*7 on WhatsApp / Email
Unlock your academic potential
© 2024 | Zucol Services PVT LTD | All rights reserved.