MIS771: Descriptive Analytics and Visualization of AusPaper's Data
VerifiedAdded on 2023/06/12
|32
|5059
|309
Report
AI Summary
This report analyzes the future business decisions of AusPaper using descriptive analytics and visualization techniques. The analysis includes assessing customer satisfaction, correlation analysis, regression analysis, and logistic regression to predict strategic alliances. Key findings reveal factors influencing customer satisfaction and the likelihood of future alliances, with a focus on product quality, pricing, and company image. The report also includes a sales forecast for 2017 and concludes with recommendations for AusPaper based on the data-driven insights. This document is available on Desklib, a platform offering a wide range of study resources for students.
1
MIS771 Descriptive Analytics and
Visualization
Assignment 2
Future Business Decision of AusPaper
Student Name: Student ID:
Due Date: Unit Name:
MIS771 Descriptive Analytics and
Visualization
Assignment 2
Future Business Decision of AusPaper
Student Name: Student ID:
Due Date: Unit Name:
Paraphrase This Document
Need a fresh take? Get an instant paraphrase of this document with our AI Paraphraser
2
Table of Contents
Assignment 2...............................................................................................................................................1
Future Business Decision of AusPaper.........................................................................................................1
Introduction.................................................................................................................................................3
Research direction...................................................................................................................................4
Task 1.......................................................................................................................................................4
Task 2.......................................................................................................................................................5
2.1 Correlation Analysis.......................................................................................................................5
2.2 Regression Analysis........................................................................................................................6
2.3 Outside ANZ Model........................................................................................................................8
Task 3.......................................................................................................................................................8
3.0 Logistic Regression.........................................................................................................................8
3.1 Maximum Likelihood...................................................................................................................10
3.2 Predicted probability visualization...............................................................................................11
Task 4.....................................................................................................................................................13
Forecasting of Sales...............................................................................................................................13
Conclusion.................................................................................................................................................14
References.................................................................................................................................................16
Appendices................................................................................................................................................17
Appendix 1.............................................................................................................................................17
Appendix 2.............................................................................................................................................22
Appendix 3.............................................................................................................................................30
Appendix 4.............................................................................................................................................31
Appendix 5.............................................................................................................................................33
3
Introduction
The Australian paper giant Auspaper has a long history of success in production of paper
products. The company is an affiliated franchise of Pinnon Paper Industries. The historical
backdrop of the company is very encouraging, and they used to produce almost equal amount of
paper products compared to the total products all the similar companies. The major customers
belonged to two different market sectors. The company used to sell their products to the
magazine and newspaper sectors through direct sales or through dealer. The company also
exported paper products to various countries of Asia, Middle East, USA, and Europe and in
different provinces of India as well as Africa.
The future problem areas were identified by the research and development wing of Auspaper and
some of the concerns bothered the management. The expansion of social media, along with
increasing market of electronic gadgets was two of the most important factors for probable future
decline in sale. The company indented to perform a market research and they approached the
research team manager Hugo Barra, a PhD in Data Science and a Master in Digital Marketing at
ANALYTICS7. The job of analysing the project was given to the scholar after a long
conversation on the scope of the research.
Research direction
The key factor was identified as edification of strategic alliance in a business to business
environment with respect to the customer satisfaction with Auspaper’s functioning and products.
The likelihood of the customers was also evaluated with a logistic model for further
⊘ This is a preview!⊘
Do you want full access?
Subscribe today to unlock all pages.
Trusted by 1+ million students worldwide
4
understanding the trend of strategic alliance. Furthermore a forecasting for last three quarters of
sales was conducted for the year 2017.
Task 1
The first task was to assess the dependent factor of the collected data fields of 200 customers.
The descriptive values of strategic alliance were found for satisfaction level of the customers.
The job was performed using Microsoft Excel Tool pack facility. The average satisfaction score
was found as 6.95 in scale of 10. Indication of almost 70% likely future purchase of Auspaper
products was observed. The deviation of satisfaction score of 1.24 was also noticed. This factor
was a very disturbing figure as 12% deviation in the negative side could deter the future planning
of the company. The median was 7.05 and a Gaussian nature of the distribution of satisfaction
score was seen with a very minor skewness of 0.09. The mode of the data was at 5.4; this
indicated the satisfaction level for most of the customers. This trend was not at all encouraging
for the company. The range of the satisfaction was noted to be 5.2 with minimum satisfaction
level at 4.7 and maximum at 9.9. Total 200 samples were analyzed for this study and the
standard error was calculated as 0.08, which provided an approximate estimate for the population
mean. The 95% confidence interval for the satisfaction score was between 6.77 and 7.12, the
compactness of the confidence interval was a useful result to analyse the customer likelihood for
the paper products of Auspaper.
The entire data was split into two subcategories based on the strategic alliance choice of the
customers. The first part consisted of 86 customers who preferred to continue future alliance
with the company. The average satisfaction level for those customers was found to be 7.94,
which was expectedly greater than that of the total data set. The median was at 7.9 and the mode
Paraphrase This Document
Need a fresh take? Get an instant paraphrase of this document with our AI Paraphraser
5
at 7.6. Almost perfect normal distribution for the satisfaction curve was seen with a negligible
skewness of -0.08. The consistency and homogeneity for the customers was evident from the
descriptive figures. The 95% confidence interval was calculated as [7.75, 8.13]. The second
section of customers with preference of discontinuing their strategic alliance with Auspaper was
114 in numbers. It was noticed that most of the customers were unhappy with services in the
collected sample data. The average satisfaction was 6.2 and the median was at 6.3, the most
important observation was for the median which was 5.4 for the data set. The distribution had a
skewness of 0.26 with kurtosis of -0.77.
Task 2
2.1 Correlation Analysis
The satisfaction of customers was the dependent variable and it was cross checked with the
independent factors. Multiple correlation technique was used for the purpose and association
levels among the factors were noticed.
The probable dependent variable was customer satisfaction score, which was continuous in
nature. The strategic alliance was a binary dependent variable. Initially correlation with these
dependent variables was noticed. In order to narrow down on the search of independent factors,
and finalize the list for most significant independent factors multiple correlation matrix was
constructed using the excel tool pack using this set of 15 variables.
For the purpose of visual influence, initially scatter diagrams were drawn. The diagrams
represented the trend of the dependent factor based on the independent factors. The delivery
speed was found to have a high positive (R = 0.63) correlation with customer satisfaction; price

6
flexibility had a low level of correlation (R = 0.03) with satisfaction. The dependent variable had
a high positive correlation (R = 0.54) with billing, image (R = 0.48), product line (R = 0.65),
complaint readdress (R = 0.59) and product quality (R = 0.51). Some of the variables such as e-
commerce (R = 0.34) and technical support (R = 0.2) also had low level of positive correlation
with satisfaction of customers. The scatter diagrams clearly reflected the trend of these
associations. Pricing was the only factor which was negatively (R = -0.28) correlated with the
dependent variable. The purchase intention of the customers was hampered by the higher prices
of paper products of Auspaper compared to other rival companies. On the positive side the fast
delivery of the paper products, product line variability, complaint readdress system and correct
billing were the major factors for customer retention research work. The sales channel ways of
distribution, the different regions, the industry types did not come into the correlation analysis.
2.2 Regression Analysis
After the correlation analysis, the scholar went ahead with multiple regression technique using
excel tool pack. The first model consisted of fourteen variables including the strategic alliance of
the customers with the company. It was observed that advertising was not a significant factor for
the regression model with p value of 0.98 and coefficient of -0.001. The model was restructured
by removing advertisement factor and warranty on products was found to be insignificant with a
p value of 0.85 and likelihood coefficient of -0.015. The model was reconstructed again without
the factor warranty, and gradually, delivery speed of the company (p value of 0.66), billing
transparency (p value of 0.58), new product launching in market (p value of 0.21), technical
support for customers (p value of 0.22), pricing of paper products (p value of 0.09), and
complaint readdress system (p value of 0.06) were also eliminated from the model due to level of
insignificance levels. The final model consisted of six factors, which were product quality, e-
⊘ This is a preview!⊘
Do you want full access?
Subscribe today to unlock all pages.
Trusted by 1+ million students worldwide
7
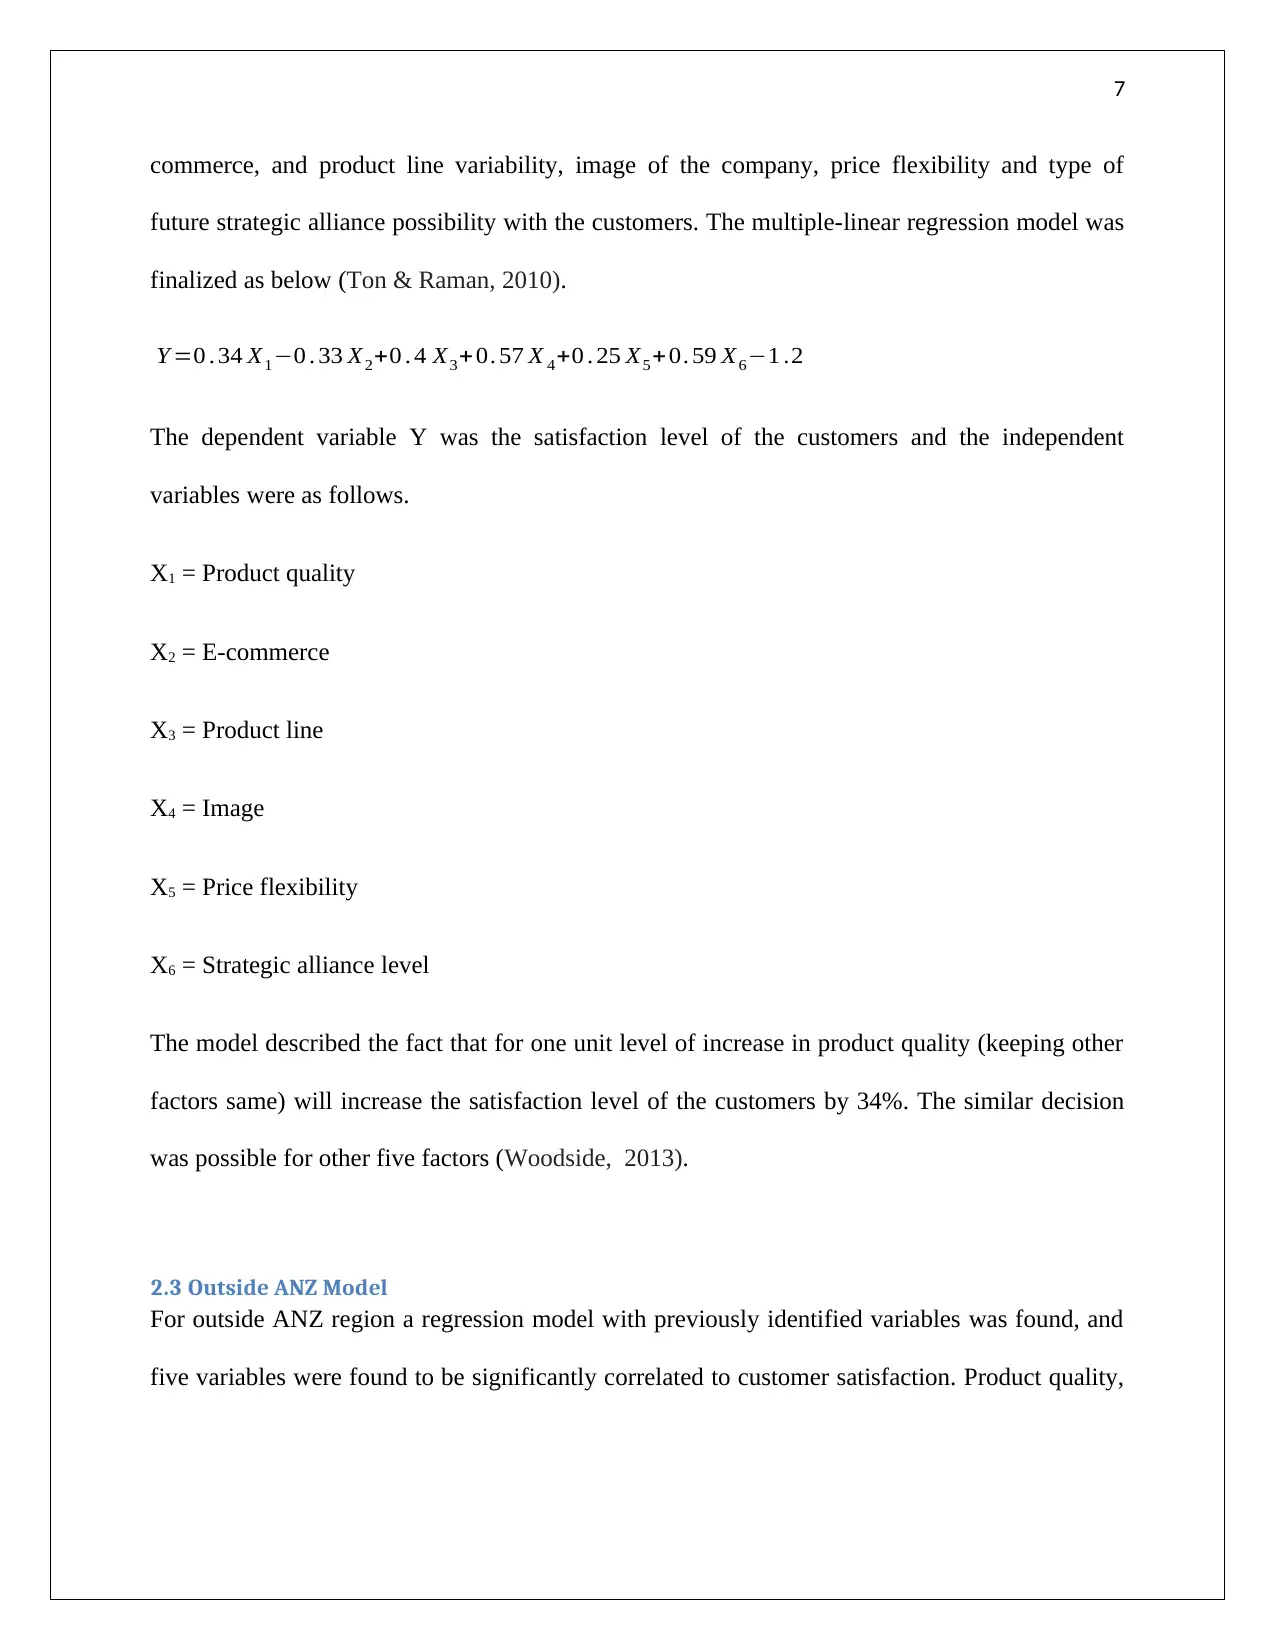
commerce, and product line variability, image of the company, price flexibility and type of
future strategic alliance possibility with the customers. The multiple-linear regression model was
finalized as below (Ton & Raman, 2010).
Y =0 . 34 X1−0 . 33 X2+0 . 4 X3+0. 57 X 4+0 . 25 X5+ 0. 59 X6−1 .2
The dependent variable Y was the satisfaction level of the customers and the independent
variables were as follows.
X1 = Product quality
X2 = E-commerce
X3 = Product line
X4 = Image
X5 = Price flexibility
X6 = Strategic alliance level
The model described the fact that for one unit level of increase in product quality (keeping other
factors same) will increase the satisfaction level of the customers by 34%. The similar decision
was possible for other five factors (Woodside, 2013).
2.3 Outside ANZ Model
For outside ANZ region a regression model with previously identified variables was found, and
five variables were found to be significantly correlated to customer satisfaction. Product quality,
Paraphrase This Document
Need a fresh take? Get an instant paraphrase of this document with our AI Paraphraser

8
complaints readdress system, image of the company, pricing of paper products, and strategic
alliance type were used to build up the new regression model. The final model was as below,
Y =0 . 32 X1+0 . 0 .39 X2 +0 .28 X3−0. 14 X4+ 0 .89 X5 +1. 55
Y = Customer satisfaction
X1 = Product quality
X2 = Complaint readdress system
X3 = Image
X4 = Price of products
X5 = Strategic alliance level
Task 3
3.0 Logistic Regression
The course coordinator of the scholar and an analytical expert at ANALYTICS7, Dr. Hugo Barra
analyzed and predicted that Product Line, Product Quality, Price Flexibility, Competitive
Pricing, and Personnel Image were the important and decisive factors for strategic alliance of the
customers with the firm. The scholar was guided to cross check the likelihood estimation for the
above predictive factors. The scholar used a logistic regression model as the factor strategic
alliance was binary in nature. Due to incapability of linear regression model to handle binary
factors the scholar went ahead with his proposed logistic model. The logistic regression model
with Dr. Hugo’s prescribed variables revealed that competitive pricing of the paper products was

9
not a significant factor of the study (p value of 0.06). The model was restructured with remaining
four variables. The model was finalized with Product Line, Product Quality, Price Flexibility,
and Personnel Image. The equation of the model has been provided below as,
Y = 1 . 09 X1+0 . 94 X2+0 . 87 X3+1 . 14 X 4−24 .32
Where the dependent variable was Y = strategic alliance and the independent factors were as
follows.
X1 = Product quality
X2 = Product line
X3 = Image
X4 = Price flexibility
The model described the fact that for one unit level of increase in product quality (keeping other
factors same) will increase the satisfaction level of the customers by almost 100%. The similar
decision was possible for other three factors (Kleinbaum et al., 2013).
3.1 Maximum Likelihood
The maximum likelihood probabilities for the continuous variables were evaluated and are
reported in table 11 in appendix. The four significant variables Product Line, Product Quality,
Price Flexibility, and Personnel Image from the logistic model were used to find the likelihood
estimate probabilities. The likelihood function was constructed. Initially the constant term and
coefficients of the models were assumed to be 0.5. The values were then multiplied with the four
factors and the constant term was added to find the likelihood function. The exponential value
⊘ This is a preview!⊘
Do you want full access?
Subscribe today to unlock all pages.
Trusted by 1+ million students worldwide
10
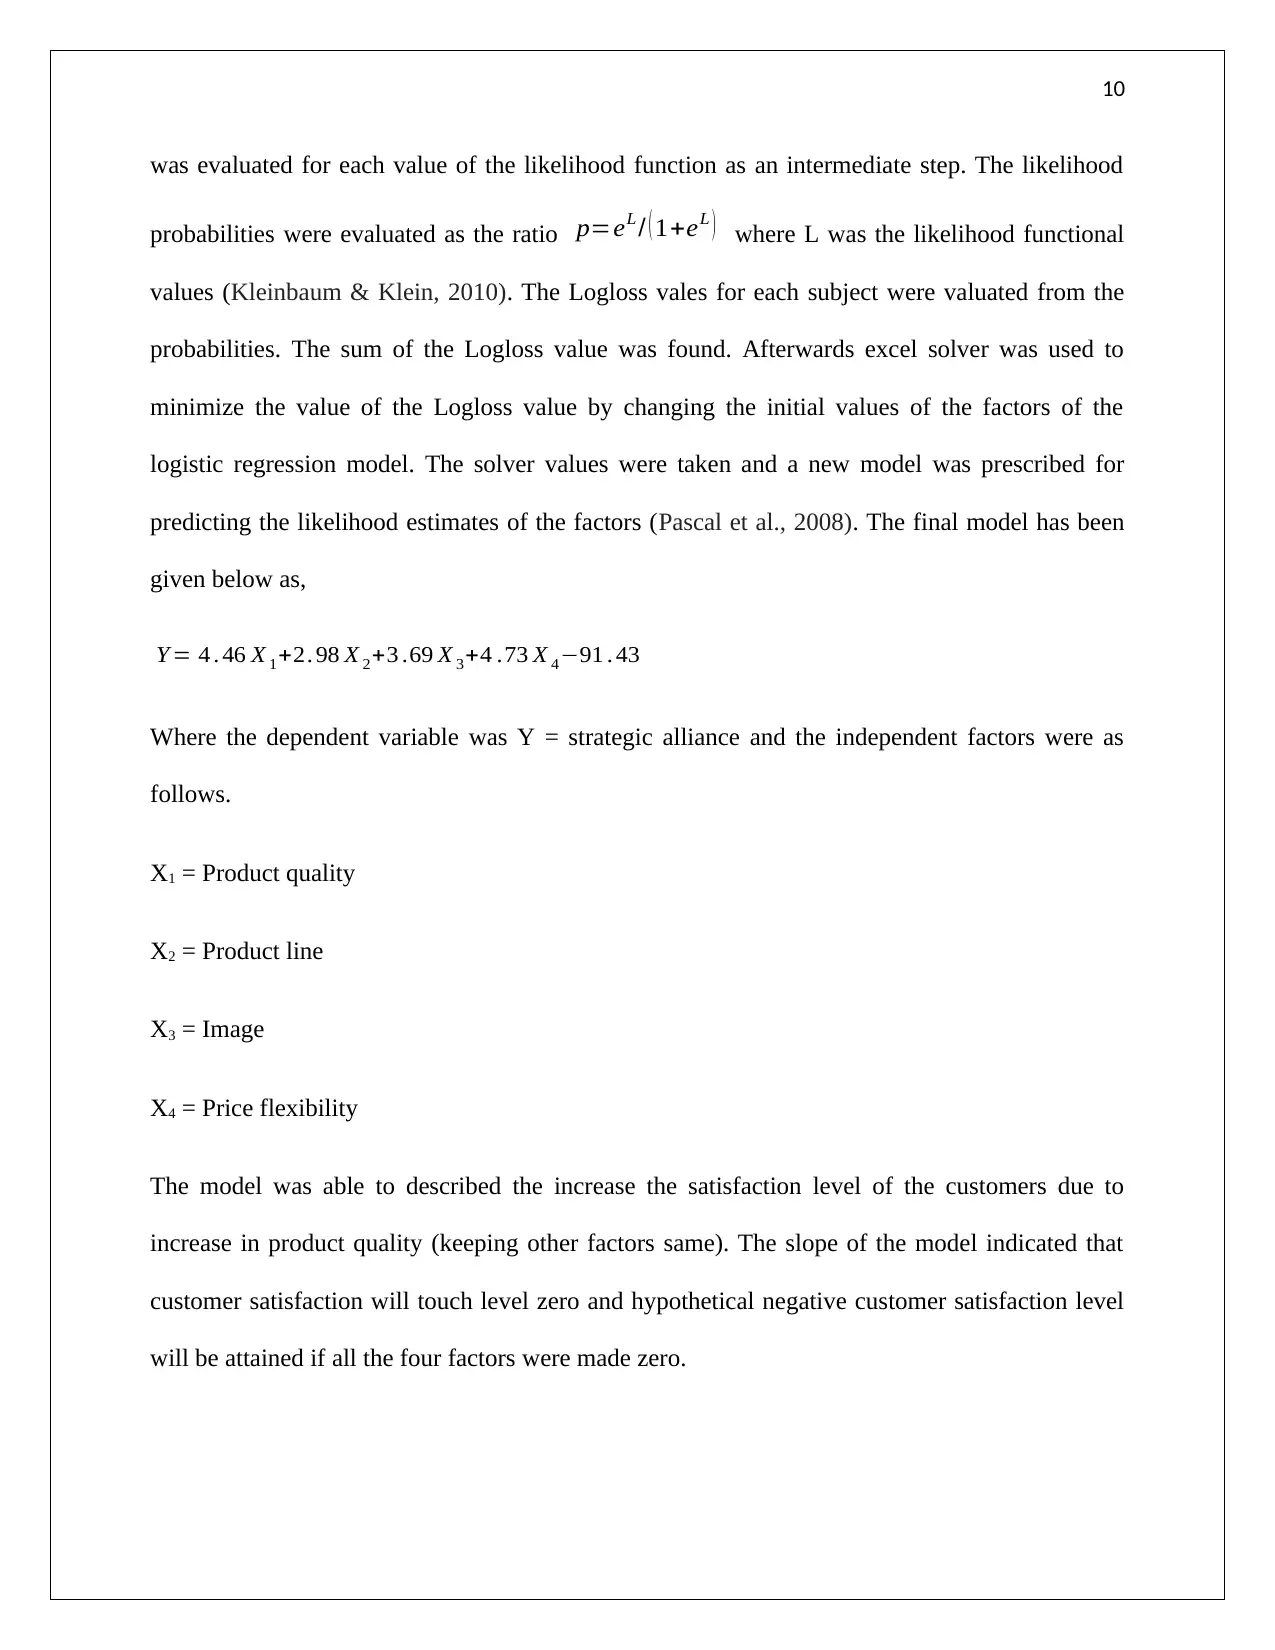
was evaluated for each value of the likelihood function as an intermediate step. The likelihood
probabilities were evaluated as the ratio p=eL / ( 1+eL ) where L was the likelihood functional
values (Kleinbaum & Klein, 2010). The Logloss vales for each subject were valuated from the
probabilities. The sum of the Logloss value was found. Afterwards excel solver was used to
minimize the value of the Logloss value by changing the initial values of the factors of the
logistic regression model. The solver values were taken and a new model was prescribed for
predicting the likelihood estimates of the factors (Pascal et al., 2008). The final model has been
given below as,
Y = 4 . 46 X 1+2. 98 X 2+3 .69 X 3+4 .73 X 4−91 . 43
Where the dependent variable was Y = strategic alliance and the independent factors were as
follows.
X1 = Product quality
X2 = Product line
X3 = Image
X4 = Price flexibility
The model was able to described the increase the satisfaction level of the customers due to
increase in product quality (keeping other factors same). The slope of the model indicated that
customer satisfaction will touch level zero and hypothetical negative customer satisfaction level
will be attained if all the four factors were made zero.
Paraphrase This Document
Need a fresh take? Get an instant paraphrase of this document with our AI Paraphraser

11
3.2 Predicted probability visualization
Here the scholar evaluated the probabilities for the association strategic alliance level as
prescribed by Dr. Hugo Barra. The personal image and variability of product lines were
considered fixed at level 5. The intention was to keep the neutral responses of the customers on
these two factors. Then the probabilities for the purpose were evaluated for three levels of price
flexibility. The three levels of price flexibility were zero (Non flexible price level), five
(moderate flexible price level) and ten (highly flexible price level). The ten levels of product
quality of the paper product were used against three levels of price flexibility. The association
alliance probabilities were plotted in figure 1 for three levels of price flexibility.
1 2 3 4 5 6 7 8 9 10
0
0.2
0.4
0.6
0.8
1
1.2
Product Quality vs Predicted
Probability
Price_Flex=0
Price_Flex=5
Price_Flex=10
Quality
Probability
Figure 1: Product quality versus Predicted probability
For the price flexibility of level zero it was observed that the predicted probabilities for strategic
alliance of the customers with the firm were almost zero. Therefore it was observed that
12
irrespective of high level of finished paper products, the probability of association of the
customers did not exist. For the second tier of flexibility (Price_Flex = 5) the trend showed that
customers started to respond from level 6 of the product quality. Hence for lower product levels
mediocre price flexibility was a non responsive factor. The probability sharply increased for high
level of products even for price flexibility of level 5. The third tier of price flexibility (Price_Flex
= 10) was an eye catcher for customers. Irrespective of the quality of product customers were
inclined to buy the products of Auspaper. The trends were in line with earlier research works and
general customer behavior of the Australian market. People preferred to buy the products for a
lower price level but the increase rate in the trend flattened out for higher end products.
Hence the scholar concluded that people were inclined for low priced products, but there were
some customers who were also inclined towards high end paper products for moderate price
flexibility (Silva & Tenreyro, 2010).
Task 4
Forecasting of Sales
For this purpose the scholar developed a time series model and later adjusted the seasonal
variation. It is a well know tool to forecast future trend and therefore seasonal adjustments were
also performed. The quarterly turnover for 37 quarters for previous ten years (2008-2017) was
used to find average sales for time series and then seasonal indices were calculated for the entire
time frame (De Livera, Hyndman & Snyder, 2011). The seasonal adjusted values for sales
turnover was recalculated using seasonal indices. The trend was smoothed out that way and
future forecast for last three quarters were done. Mean absolute percentage error (MAPE) was
2.68 % (Brockwell & Davis, 2016).
⊘ This is a preview!⊘
Do you want full access?
Subscribe today to unlock all pages.
Trusted by 1+ million students worldwide
1 out of 32
Related Documents


Your All-in-One AI-Powered Toolkit for Academic Success.
+13062052269
info@desklib.com
Available 24*7 on WhatsApp / Email
![[object Object]](/_next/static/media/star-bottom.7253800d.svg)
Unlock your academic potential
Copyright © 2020–2026 A2Z Services. All Rights Reserved. Developed and managed by ZUCOL.