Target Customer Identification: Australian Coffee Market Analysis
VerifiedAdded on 2023/03/30
|22
|4804
|222
Report
AI Summary
This report analyzes the Australian coffee market to determine the most suitable customer group for a coffee business. It uses secondary data from the Australian Bureau of Statistics regarding Brisbane's community profile, analyzed via Excel for data visualization. The study identifies families with children as a dominant demographic with high weekly income, suggesting they are the ideal target customer. The report also evaluates whether the business should start as a small-scale or large-scale operation, concluding that a medium-scale approach is optimal. The analysis includes age and sex distribution, marital status, and family structures within Greater Brisbane to inform strategic marketing decisions and ensure a successful business launch in the competitive Australian coffee market. This report utilizes business-to-customer marketing strategies to understand customer backgrounds and environments, aiming to enhance business performance.

Australian coffee market analysis
Paraphrase This Document
Need a fresh take? Get an instant paraphrase of this document with our AI Paraphraser
Executive summary
The main purpose of this report was to incorporate the marketing strategies to analyze the market
and determine the most suitable group of customers that should be targeted by the coffee
business. This objective was addressed by further objectives including 1) To determine the most
suitable group of customers that should be targeted by the coffee shop business and 2) to
determine whether the business should start its operation in small scale or large scale coffee
supplier. Secondary data retrieved from Australia Bureau of Statistics regarding Brisbane
community profile was used and data analyzed using excel to generate tables and graphs in data
visualization process. Results indicated that families with children was well spread and
dominated the population as well as dominating the weekly income scale with the highest
income. As a result therefor, it was concluded that the most suited group of customers that will
be focused on was families with children and that the business will start its operation in medium
scale.

Table of content
⊘ This is a preview!⊘
Do you want full access?
Subscribe today to unlock all pages.
Trusted by 1+ million students worldwide
Introduction
Every business venture must follow a certain marketing strategy for a successful startup and
withstand the pressure and challenges coming as a result of competition. Failure to conduct
market research may lead to a business tumble within a short period of stay in the market.
Critical analysis of current situations in the market and predictive analysis opt to be conducted to
assimilate with such situations or even more harsh situations than that. Marketing strategy is
therefore defined as multiple steps undertaken to evaluate the market and leading to making
informed decisions about the purchase behavior of the customers (Atwal and Williams, 2017).
Various marketing strategies are designed according to the type of product a business is
supplying in the market and the goals set by the business to achieve (Cant et al, 2015). Among
other existing marketing strategies are employee marketing, business to customer, business to
business and direct selling strategies among others. The main purpose of this report was
therefore to incorporate the marketing strategies to analyze the market and determine the most
suitable group of customers that should be targeted by the coffee business. This will be able to be
achieved through the help and utilization of business to customer marketing strategy analysis
which involves the understanding of customers’ background activities and environment.
Report objectives
1. To determine the most suitable group of customers that should be targeted by the coffee
shop business
2. To determine whether the business should start its operation in small scale or large scale
coffee supplier
Research questions
1. Which is the most suitable group of customers to be focused on by the coffee shop
business?
Paraphrase This Document
Need a fresh take? Get an instant paraphrase of this document with our AI Paraphraser
2. Should the coffee shop business start its operation as a small scale or large scale supplier
of coffee?
Brief literature review
Australia is perceived as one of the largest coffee consuming countries in the oceanic regions. As
a result of that, the country has had and is still expecting stronger growth of coffee shops in the
market due to the love the residents have for quality coffee (Walters and Broom, 2013). In the
past years, Australians had been interested in the good taste and the origin of the product. As a
result of that therefore, strategic plans were laid leading to certified green coffee beans being
bought for farming by 2016 (Thompson et al, 2016). The country men had had strong coffee
culture that lead to the thriving of and increased rate of number of coffee shops in the country.
This has led to competition in the industry as each coffee shop owner is striving as much to
remain relevant in the market thus industry growing by 2.2% by 2018 (Cox, 2018). Depending
on the source type, Australian coffee market has been divided into two i.e. Arabica and Robusta
where Arabica dominates shares closely followed by Robusta (Creti et al, 2013; Fox et al, 2013).
When at the market, coffee is divided into ground coffee, instant coffee and the whole bean. Out
of all the three types of coffee supplied in the market, instant coffee takes the lead in terms of
sale in the market due to its aroma and flavor (Nuševa et al, 2017). The industry has had positive
economic effect in the growth and development of the country’s economy since it offers
employment to unemployed youths. There are also challenges associated with coffee in the
market coming from politics to other issues in the country that need to be addressed.
Methodology
Secondary data used in the preparation of this report was retrieved from Australian Bureau of
Statistics (ABS) which covered the housing and population census for the year 2016. The data
covered general community profile for Greater Brisbane, Greater Melbourne and Greater
Sydney. Just to mention a few, datasets covered sex, age, marital, status place of birth etc.
Secondary data (census data) was preferred for use in this research since they result to quality
results and also helps in saving time and money unlike collecting primary data (Greenhoot and
Dowsett, 2012). Census data in particular are deemed important in marketing analysis because
they lead to reliable results about a population targeted by the business. The retrieved data
needed to be undertake through a series of analysis to extract any available information that
could be useful in bettering the business performance. Descriptive statistical analysis was
employed by the researcher in this report to better under the housing population data towards
achieving the objectives of this report. Data visualization was conducted using the Microsoft
excel in the representation of data in figures and tables for analysis and easy interpretation.
Report results
This section was developed to help in answering the research questions and thus to meet the
research objectives set too. The research questions were addressed in this report in two separate
sections each addressing different research objectives.
Objective 1: The most suitable group of customers that should be targeted by coffee shop
business
⊘ This is a preview!⊘
Do you want full access?
Subscribe today to unlock all pages.
Trusted by 1+ million students worldwide
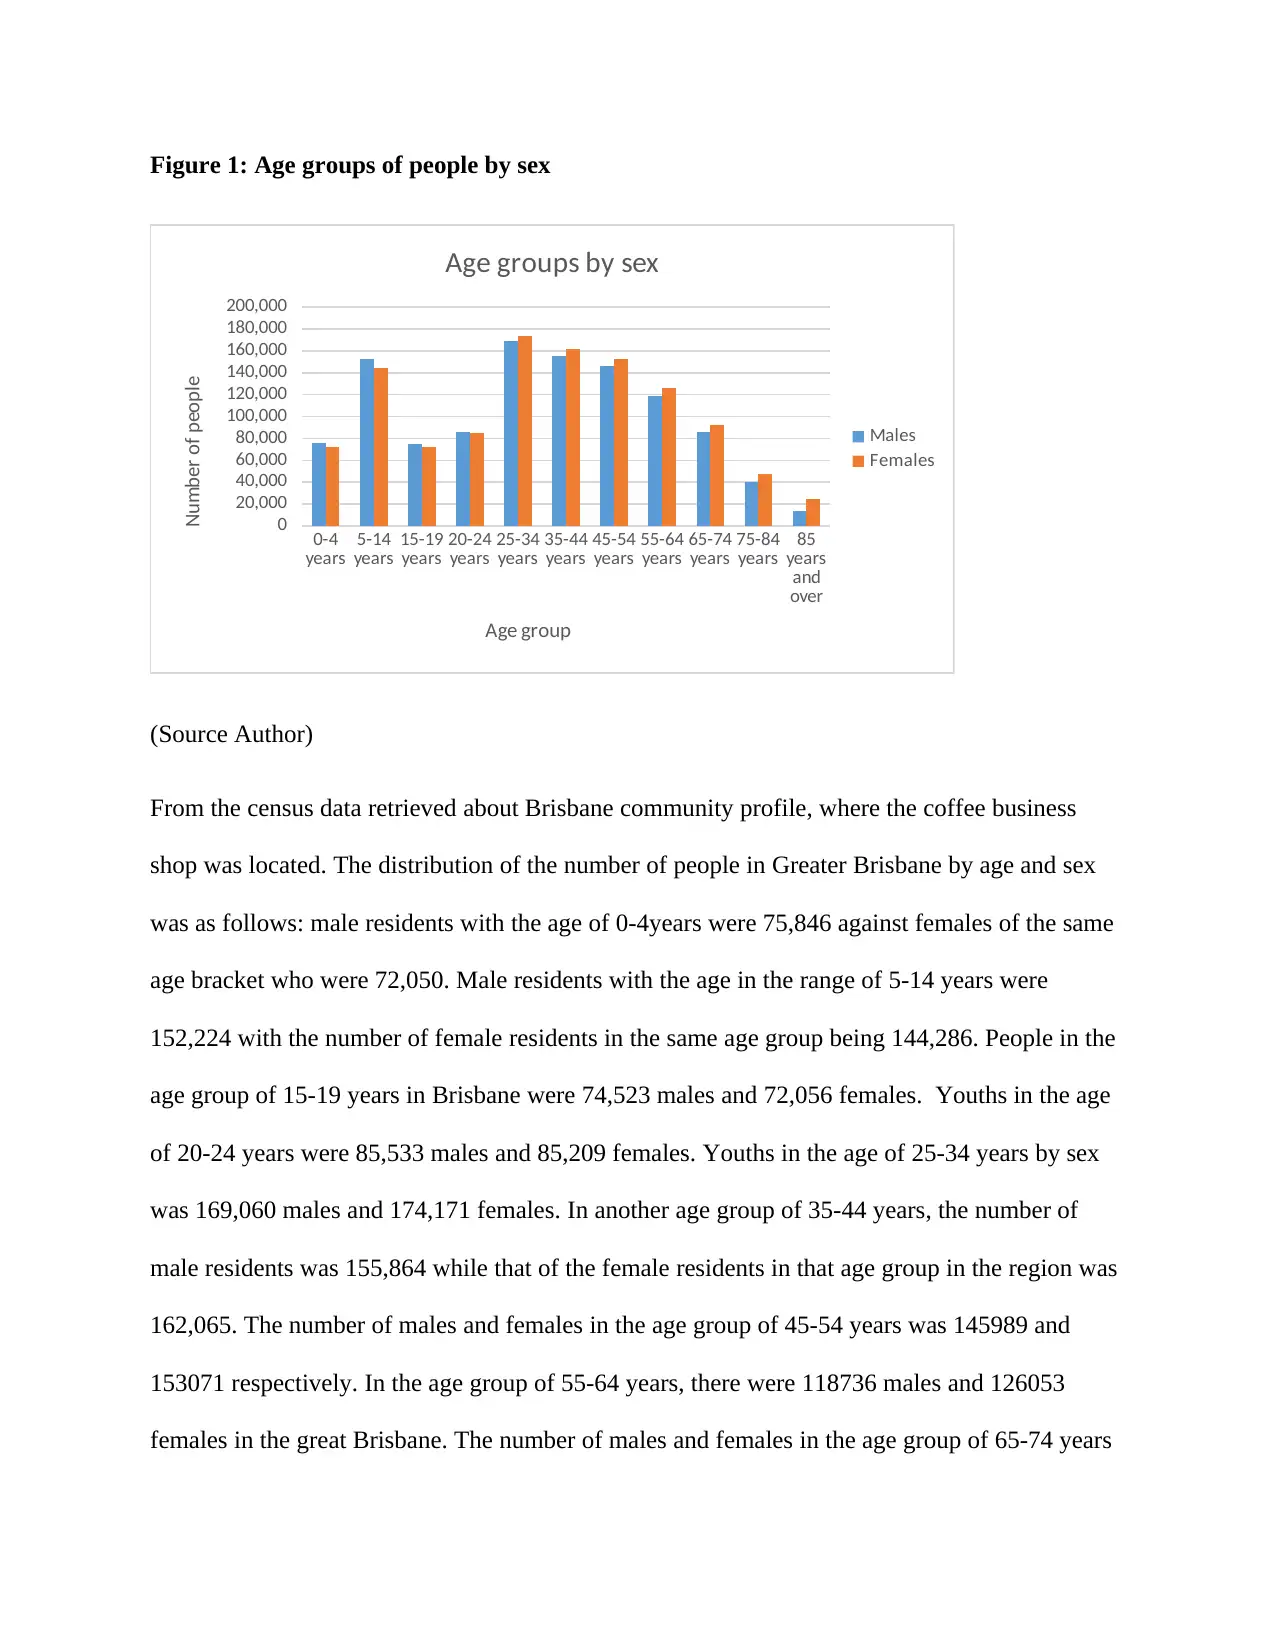
Figure 1: Age groups of people by sex
0-4
years 5-14
years 15-19
years 20-24
years 25-34
years 35-44
years 45-54
years 55-64
years 65-74
years 75-84
years 85
years
and
over
0
20,000
40,000
60,000
80,000
100,000
120,000
140,000
160,000
180,000
200,000
Age groups by sex
Males
Females
Age group
Number of people
(Source Author)
From the census data retrieved about Brisbane community profile, where the coffee business
shop was located. The distribution of the number of people in Greater Brisbane by age and sex
was as follows: male residents with the age of 0-4years were 75,846 against females of the same
age bracket who were 72,050. Male residents with the age in the range of 5-14 years were
152,224 with the number of female residents in the same age group being 144,286. People in the
age group of 15-19 years in Brisbane were 74,523 males and 72,056 females. Youths in the age
of 20-24 years were 85,533 males and 85,209 females. Youths in the age of 25-34 years by sex
was 169,060 males and 174,171 females. In another age group of 35-44 years, the number of
male residents was 155,864 while that of the female residents in that age group in the region was
162,065. The number of males and females in the age group of 45-54 years was 145989 and
153071 respectively. In the age group of 55-64 years, there were 118736 males and 126053
females in the great Brisbane. The number of males and females in the age group of 65-74 years
Paraphrase This Document
Need a fresh take? Get an instant paraphrase of this document with our AI Paraphraser
was 86,138 males and 92,065 females. The age group of 75-84 years, there were 39855 males
and 47651 females in the entire population in the area. There was 13,676 males and 24,673
females of the people who were aged 85 years and above.
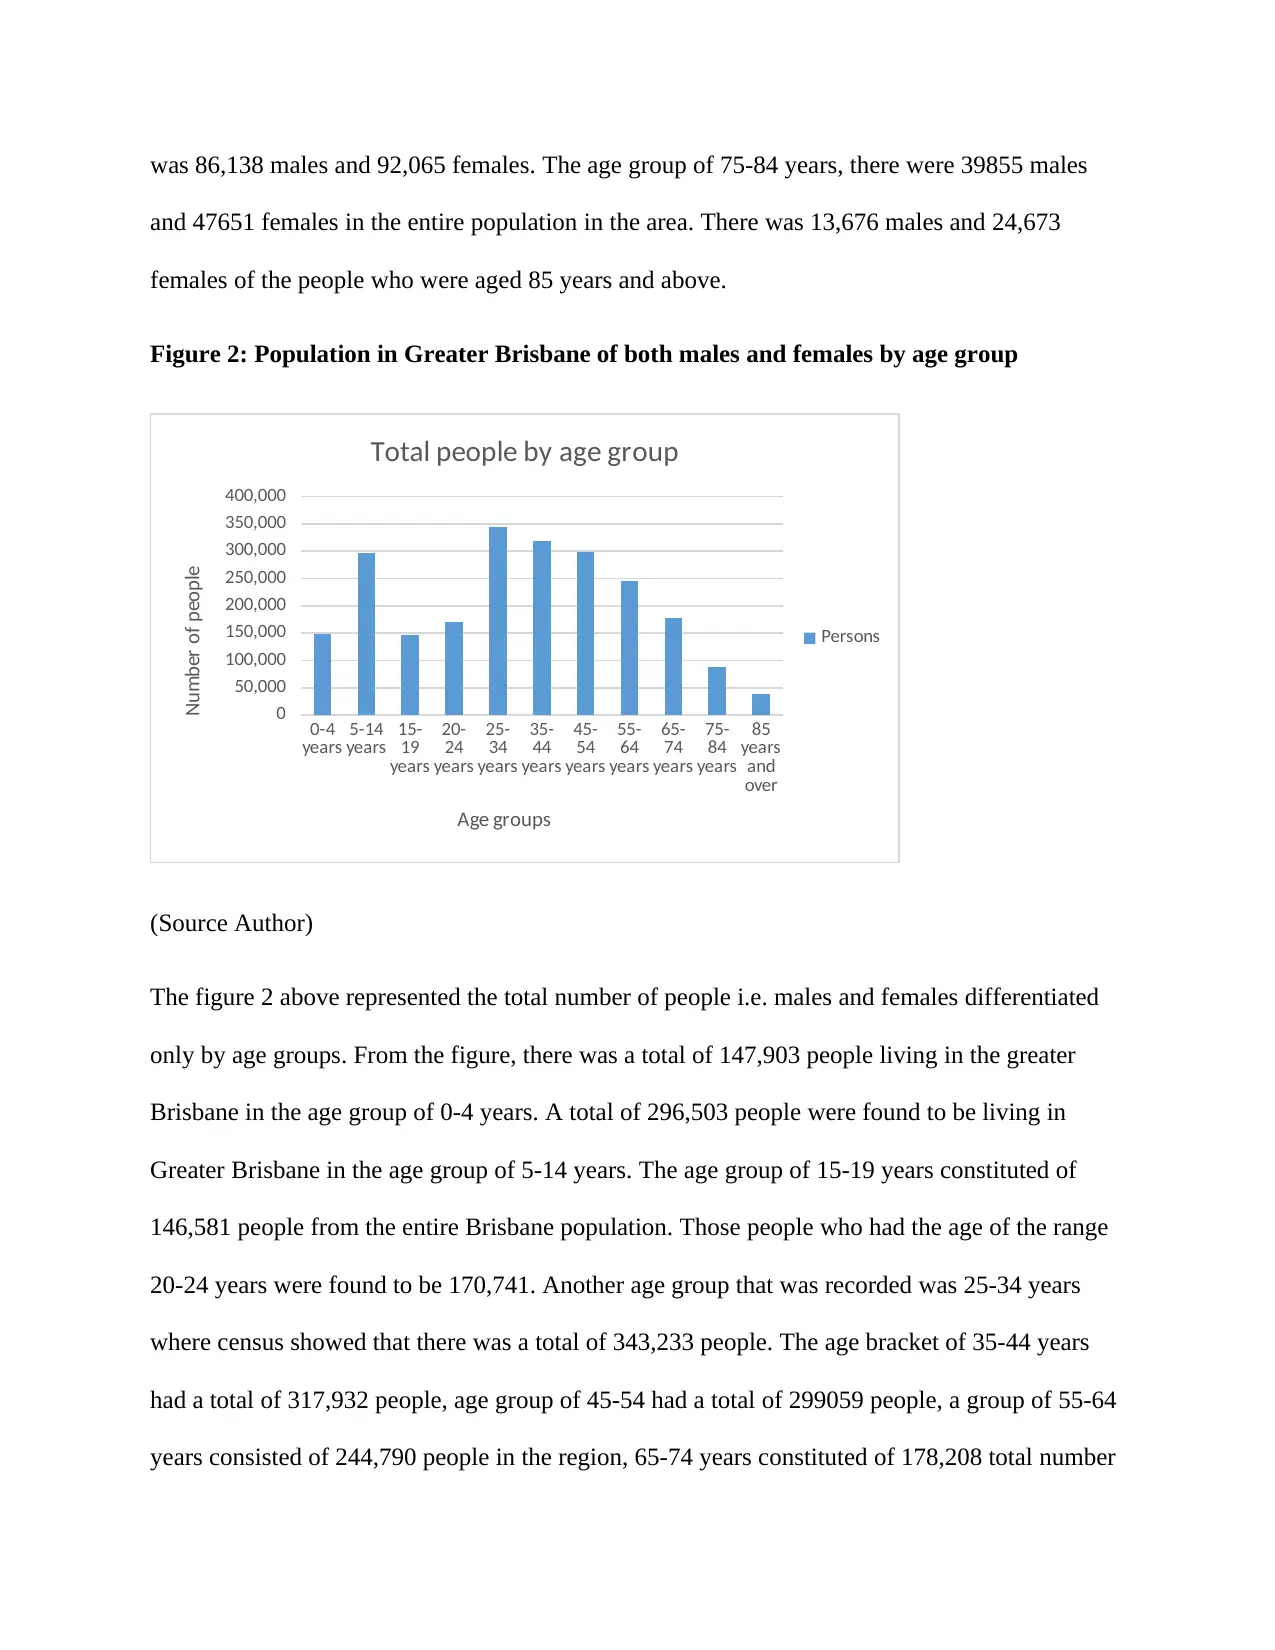
Figure 2: Population in Greater Brisbane of both males and females by age group
0-4
years 5-14
years 15-
19
years
20-
24
years
25-
34
years
35-
44
years
45-
54
years
55-
64
years
65-
74
years
75-
84
years
85
years
and
over
0
50,000
100,000
150,000
200,000
250,000
300,000
350,000
400,000
Total people by age group
Persons
Age groups
Number of people
(Source Author)
The figure 2 above represented the total number of people i.e. males and females differentiated
only by age groups. From the figure, there was a total of 147,903 people living in the greater
Brisbane in the age group of 0-4 years. A total of 296,503 people were found to be living in
Greater Brisbane in the age group of 5-14 years. The age group of 15-19 years constituted of
146,581 people from the entire Brisbane population. Those people who had the age of the range
20-24 years were found to be 170,741. Another age group that was recorded was 25-34 years
where census showed that there was a total of 343,233 people. The age bracket of 35-44 years
had a total of 317,932 people, age group of 45-54 had a total of 299059 people, a group of 55-64
years consisted of 244,790 people in the region, 65-74 years constituted of 178,208 total number
and 47651 females in the entire population in the area. There was 13,676 males and 24,673
females of the people who were aged 85 years and above.
Figure 2: Population in Greater Brisbane of both males and females by age group
0-4
years 5-14
years 15-
19
years
20-
24
years
25-
34
years
35-
44
years
45-
54
years
55-
64
years
65-
74
years
75-
84
years
85
years
and
over
0
50,000
100,000
150,000
200,000
250,000
300,000
350,000
400,000
Total people by age group
Persons
Age groups
Number of people
(Source Author)
The figure 2 above represented the total number of people i.e. males and females differentiated
only by age groups. From the figure, there was a total of 147,903 people living in the greater
Brisbane in the age group of 0-4 years. A total of 296,503 people were found to be living in
Greater Brisbane in the age group of 5-14 years. The age group of 15-19 years constituted of
146,581 people from the entire Brisbane population. Those people who had the age of the range
20-24 years were found to be 170,741. Another age group that was recorded was 25-34 years
where census showed that there was a total of 343,233 people. The age bracket of 35-44 years
had a total of 317,932 people, age group of 45-54 had a total of 299059 people, a group of 55-64
years consisted of 244,790 people in the region, 65-74 years constituted of 178,208 total number
of people, age group of 75-84 years consisted of 87,505 total number of people both males and
females and lastly, people whose age was 85 years and above were 38,357 people in total.
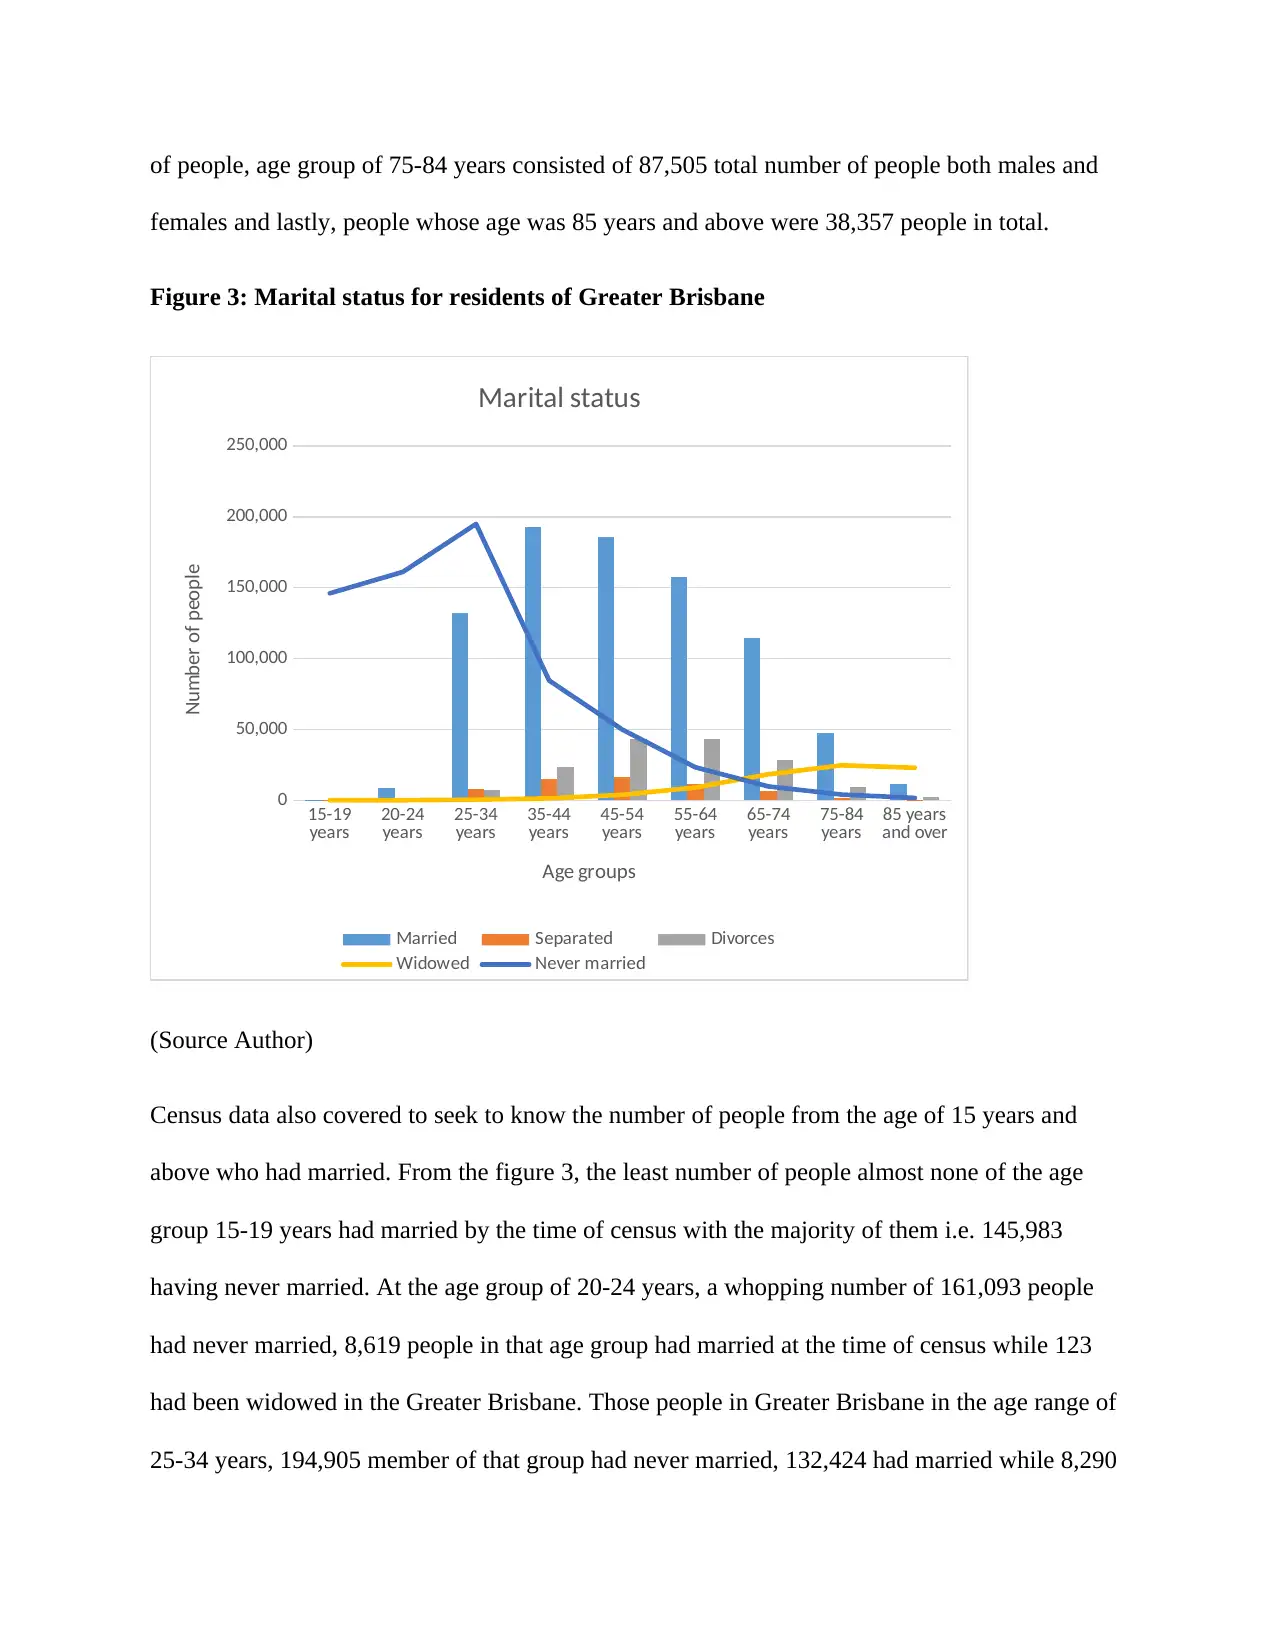
Figure 3: Marital status for residents of Greater Brisbane
15-19
years 20-24
years 25-34
years 35-44
years 45-54
years 55-64
years 65-74
years 75-84
years 85 years
and over
0
50,000
100,000
150,000
200,000
250,000
Marital status
Married Separated Divorces
Widowed Never married
Age groups
Number of people
(Source Author)
Census data also covered to seek to know the number of people from the age of 15 years and
above who had married. From the figure 3, the least number of people almost none of the age
group 15-19 years had married by the time of census with the majority of them i.e. 145,983
having never married. At the age group of 20-24 years, a whopping number of 161,093 people
had never married, 8,619 people in that age group had married at the time of census while 123
had been widowed in the Greater Brisbane. Those people in Greater Brisbane in the age range of
25-34 years, 194,905 member of that group had never married, 132,424 had married while 8,290
females and lastly, people whose age was 85 years and above were 38,357 people in total.
Figure 3: Marital status for residents of Greater Brisbane
15-19
years 20-24
years 25-34
years 35-44
years 45-54
years 55-64
years 65-74
years 75-84
years 85 years
and over
0
50,000
100,000
150,000
200,000
250,000
Marital status
Married Separated Divorces
Widowed Never married
Age groups
Number of people
(Source Author)
Census data also covered to seek to know the number of people from the age of 15 years and
above who had married. From the figure 3, the least number of people almost none of the age
group 15-19 years had married by the time of census with the majority of them i.e. 145,983
having never married. At the age group of 20-24 years, a whopping number of 161,093 people
had never married, 8,619 people in that age group had married at the time of census while 123
had been widowed in the Greater Brisbane. Those people in Greater Brisbane in the age range of
25-34 years, 194,905 member of that group had never married, 132,424 had married while 8,290
⊘ This is a preview!⊘
Do you want full access?
Subscribe today to unlock all pages.
Trusted by 1+ million students worldwide
had separated, 7,155 had been divorced and 457 of that age group were widowed. A total of
192,867 people in the age group of 35-44 years had married, 1,421 of the people in that group
were widowed, 15,340 of the people in that same group were separated and 23,810 were divorces
while a total of 84,491 people within that region had never married. At the age group of 45-54
years, 185,708 people had married, 16,680 had been separated, 42,899 were divorces, 9,069 were
widowed and 23,301 had never married. In yet another age group of 55-64 years, 157,246 people
had married, 9,250 were separated, 9,069 were widowed, 43,469 were divorces and 23,301 had
never married. The group of age of 65-74 years, 114,740 people had married, 9,620 had
separated by the time of census in the region, 18,360 people had been widowed and 9,781 people
from the region had never married while the number of divorces was 28,783. At the group of age
of 75-84 years, 47,791 people had married, 24,674 people had been widowed, 4,044 people had
never married, 9,131 people had divorced and 1,452 had separated. At the highest age group i.e.
85 and over, 11,281 people had married, 1,724 people still never married, 22,925 people had
been widowed and a very negligible number of people were divorces.
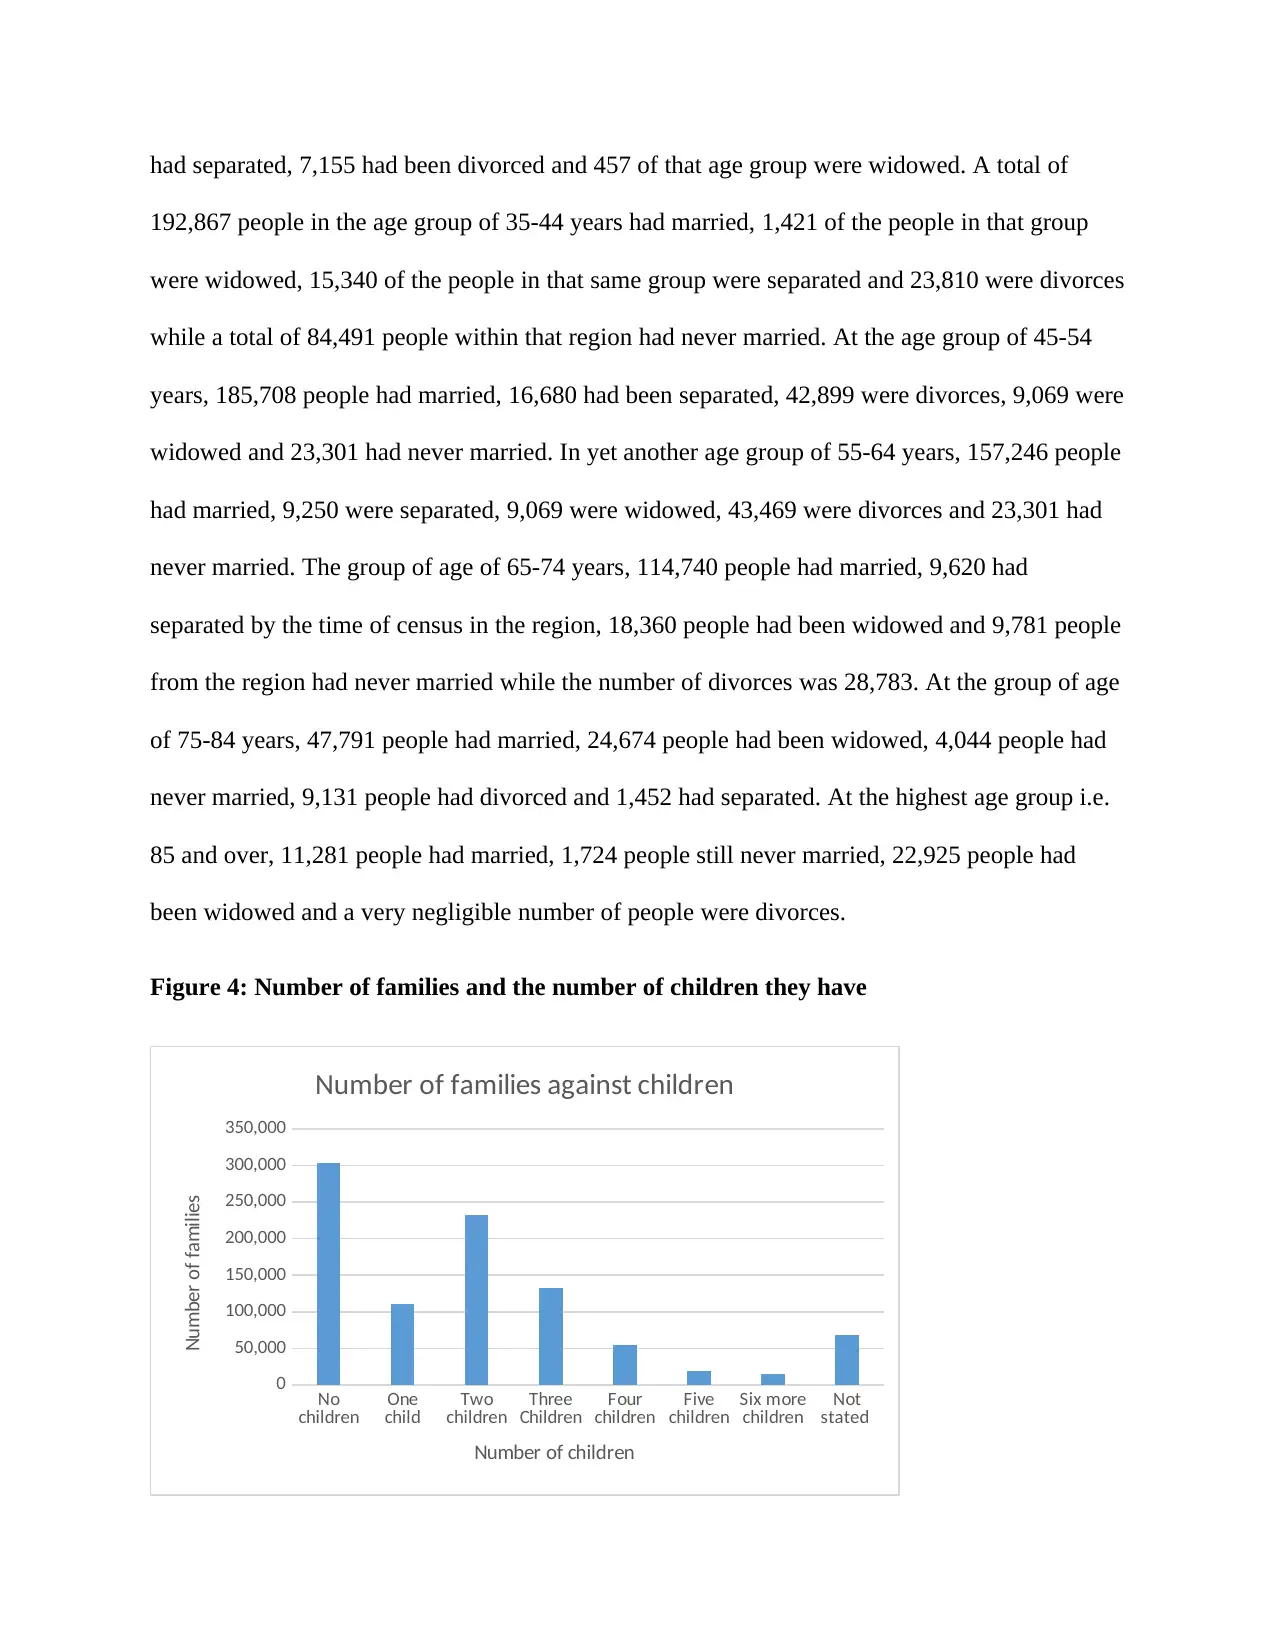
Figure 4: Number of families and the number of children they have
No
children One
child Two
children Three
Children Four
children Five
children Six more
children Not
stated
0
50,000
100,000
150,000
200,000
250,000
300,000
350,000
Number of families against children
Number of children
Number of families
192,867 people in the age group of 35-44 years had married, 1,421 of the people in that group
were widowed, 15,340 of the people in that same group were separated and 23,810 were divorces
while a total of 84,491 people within that region had never married. At the age group of 45-54
years, 185,708 people had married, 16,680 had been separated, 42,899 were divorces, 9,069 were
widowed and 23,301 had never married. In yet another age group of 55-64 years, 157,246 people
had married, 9,250 were separated, 9,069 were widowed, 43,469 were divorces and 23,301 had
never married. The group of age of 65-74 years, 114,740 people had married, 9,620 had
separated by the time of census in the region, 18,360 people had been widowed and 9,781 people
from the region had never married while the number of divorces was 28,783. At the group of age
of 75-84 years, 47,791 people had married, 24,674 people had been widowed, 4,044 people had
never married, 9,131 people had divorced and 1,452 had separated. At the highest age group i.e.
85 and over, 11,281 people had married, 1,724 people still never married, 22,925 people had
been widowed and a very negligible number of people were divorces.
Figure 4: Number of families and the number of children they have
No
children One
child Two
children Three
Children Four
children Five
children Six more
children Not
stated
0
50,000
100,000
150,000
200,000
250,000
300,000
350,000
Number of families against children
Number of children
Number of families
Paraphrase This Document
Need a fresh take? Get an instant paraphrase of this document with our AI Paraphraser
(Source Author)
Since the coffee business was concerned with the market, the larger the family size was, the
more market coffee shop was expected to have. In that regard therefore, number and size of the
families drew the attention in search for suitable group of customers. The number of families
with no children was recorded to be 302,802. The number of families that had one child was
recorded to be 110,930, the number of families in Greater Brisbane that had two children was
recorded to be 232,192. The number of families that had the number of children to be three was
recorded to be 133,300. Four number of children was recorded in 54,897 families. Families with
five children was recorded to be 19,458. The number of families that was as well recorded to
have had six or more children was recorded to be 14,990 and lastly some families never stated to
have had children and such number of families totaled to 68,446.
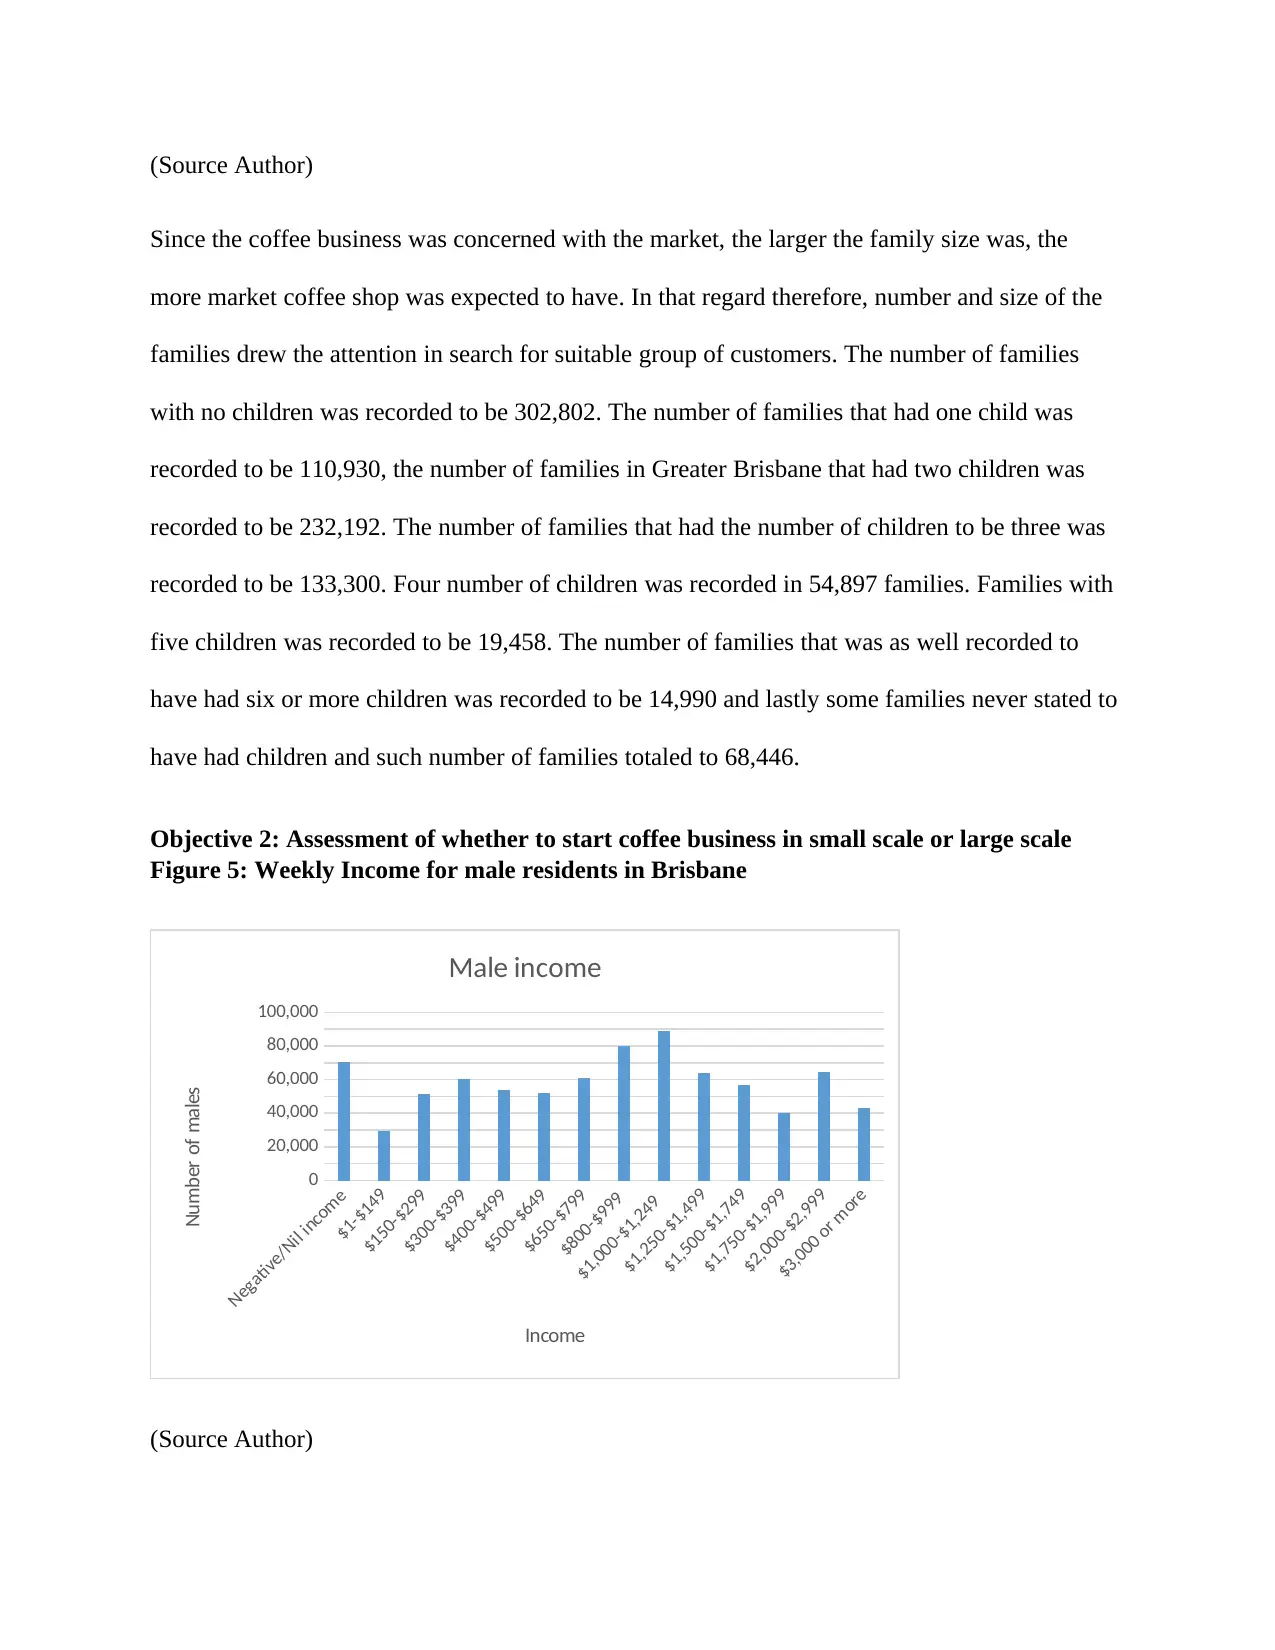
Objective 2: Assessment of whether to start coffee business in small scale or large scale
Figure 5: Weekly Income for male residents in Brisbane
Negative/Nil income
$1-$149
$150-$299
$300-$399
$400-$499
$500-$649
$650-$799
$800-$999
$1,000-$1,249
$1,250-$1,499
$1,500-$1,749
$1,750-$1,999
$2,000-$2,999
$3,000 or more
0
20,000
40,000
60,000
80,000
100,000
Male income
Income
Number of males
(Source Author)
Since the coffee business was concerned with the market, the larger the family size was, the
more market coffee shop was expected to have. In that regard therefore, number and size of the
families drew the attention in search for suitable group of customers. The number of families
with no children was recorded to be 302,802. The number of families that had one child was
recorded to be 110,930, the number of families in Greater Brisbane that had two children was
recorded to be 232,192. The number of families that had the number of children to be three was
recorded to be 133,300. Four number of children was recorded in 54,897 families. Families with
five children was recorded to be 19,458. The number of families that was as well recorded to
have had six or more children was recorded to be 14,990 and lastly some families never stated to
have had children and such number of families totaled to 68,446.
Objective 2: Assessment of whether to start coffee business in small scale or large scale
Figure 5: Weekly Income for male residents in Brisbane
Negative/Nil income
$1-$149
$150-$299
$300-$399
$400-$499
$500-$649
$650-$799
$800-$999
$1,000-$1,249
$1,250-$1,499
$1,500-$1,749
$1,750-$1,999
$2,000-$2,999
$3,000 or more
0
20,000
40,000
60,000
80,000
100,000
Male income
Income
Number of males
(Source Author)
A large number of males totaling to 70,221 were captured in the census to have had negative or
no income. Those males in the region whose weekly income was in the range of $1-$149 were
29,481, those who had a weekly income of $150-$299 were 51,119. Total number of males in
Greater Brisbane earning an income of $300-$399 weekly were 60,251, those who were earning
weekly income of $400-$499 were 53,866 and those males who lived in Greater Brisbane and
had weekly income of $500-$649 were found to be 51,762. Other males had weekly income of
$650-$799 with their number recorded at 61,286, others had weekly income of $800-$999 with
the number of those males at 79,969. Further, weekly scale of income at $1000-$1,249 was being
earned by 88,984 males in Greater Brisbane, $1250-$1499 was earned weekly by 63,953 male
individuals, $1500-$1749 was being earned weekly by 56,665 male individuals, income of
$1750-$1999 was being earned weekly by a total of 39,964 male individuals,$2000-$2999 was
being earned weekly by 64,578 male individuals and finally, $3000 and more was being earned
by 43,036 male individuals in Greater Brisbane.
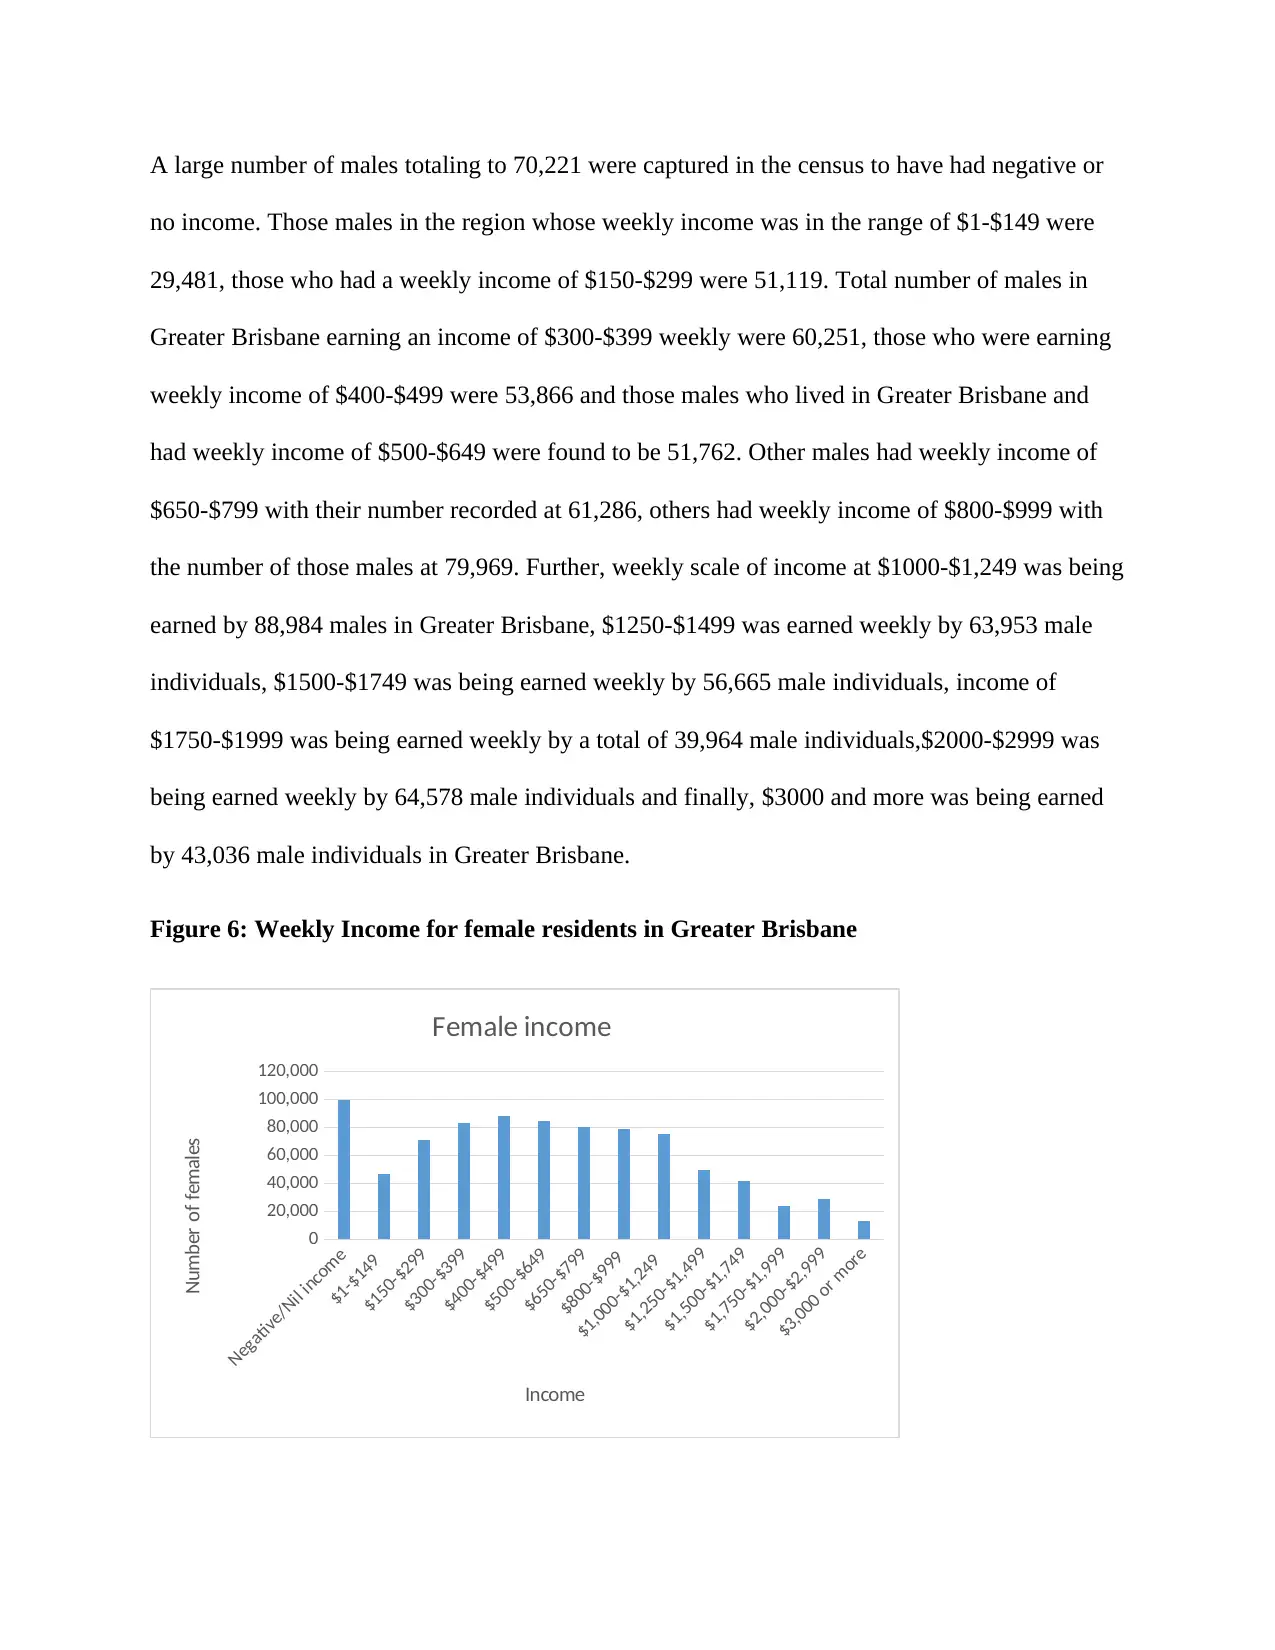
Figure 6: Weekly Income for female residents in Greater Brisbane
Negative/Nil income
$1-$149
$150-$299
$300-$399
$400-$499
$500-$649
$650-$799
$800-$999
$1,000-$1,249
$1,250-$1,499
$1,500-$1,749
$1,750-$1,999
$2,000-$2,999
$3,000 or more
0
20,000
40,000
60,000
80,000
100,000
120,000
Female income
Income
Number of females
no income. Those males in the region whose weekly income was in the range of $1-$149 were
29,481, those who had a weekly income of $150-$299 were 51,119. Total number of males in
Greater Brisbane earning an income of $300-$399 weekly were 60,251, those who were earning
weekly income of $400-$499 were 53,866 and those males who lived in Greater Brisbane and
had weekly income of $500-$649 were found to be 51,762. Other males had weekly income of
$650-$799 with their number recorded at 61,286, others had weekly income of $800-$999 with
the number of those males at 79,969. Further, weekly scale of income at $1000-$1,249 was being
earned by 88,984 males in Greater Brisbane, $1250-$1499 was earned weekly by 63,953 male
individuals, $1500-$1749 was being earned weekly by 56,665 male individuals, income of
$1750-$1999 was being earned weekly by a total of 39,964 male individuals,$2000-$2999 was
being earned weekly by 64,578 male individuals and finally, $3000 and more was being earned
by 43,036 male individuals in Greater Brisbane.
Figure 6: Weekly Income for female residents in Greater Brisbane
Negative/Nil income
$1-$149
$150-$299
$300-$399
$400-$499
$500-$649
$650-$799
$800-$999
$1,000-$1,249
$1,250-$1,499
$1,500-$1,749
$1,750-$1,999
$2,000-$2,999
$3,000 or more
0
20,000
40,000
60,000
80,000
100,000
120,000
Female income
Income
Number of females
⊘ This is a preview!⊘
Do you want full access?
Subscribe today to unlock all pages.
Trusted by 1+ million students worldwide
1 out of 22
Related Documents


Your All-in-One AI-Powered Toolkit for Academic Success.
+13062052269
info@desklib.com
Available 24*7 on WhatsApp / Email
![[object Object]](/_next/static/media/star-bottom.7253800d.svg)
Unlock your academic potential
Copyright © 2020–2026 A2Z Services. All Rights Reserved. Developed and managed by ZUCOL.