Economics Assignment: Australia's Economic Performance Analysis Report
VerifiedAdded on 2021/06/16
|17
|3580
|18
Report
AI Summary
This report provides a comprehensive analysis of Australia's economic performance, examining key macroeconomic indicators such as GDP growth, unemployment rate, inflation rate, and trade. The analysis utilizes statistical data and graphical representations to illustrate the relationships between these economic parameters. The report investigates the association between inflation and real GDP growth, as well as the relationship between the unemployment rate and GDP growth. It also explores the business cycle of the Australian economy, compares interest rates with the US, and assesses the relationship between real exchange rates and net exports. Furthermore, the report analyzes the association between the US Federal Reserve Fund's rates and Australia's Cash rates. The findings highlight the current growth stage of the Australian economy, the impact of trade, and the influence of foreign investment. The report concludes with a summarized overview of the findings and provides a forecast of Australia's economic performance in the coming years.
Running head: ECONOMICS ASSIGNMENT
Economics Assignment
Name of the student:
Name of the University:
Author note
Economics Assignment
Name of the student:
Name of the University:
Author note
Paraphrase This Document
Need a fresh take? Get an instant paraphrase of this document with our AI Paraphraser
2ECONOMICS ASSIGNMENT
Executive summary:
Australia is one of the largest mixed developed economy around the world that has been
going through magnanimous amount of transformation since the last two decades. Over the
year, service sector of the state and the manufacturing industries has grew to a large extent
that has made it one of the largest economy in the world. This report is focused to discuss the
economic performance of the Australia through the statistical as well as graphical
presentation of the economic parameters like unemployment rate, trade, GDP growth rate and
inflation. It will compare the interest rate of the Australian economy with the US economy
and allow the researcher to determine of the respective market. To conclude it will provide
summarised overview of the findings and forecast the economic performance of the Australia
in coming days. From the analysis it has been found that the Australian economy has been
going through good growth stage as of now and the economy has been increasing at good
growth rate. Though the unemployment rate is high in the state, yet good amount of job
creation has kept the things under control. With the rise in the trade by the means of
controlling the Cash rate and inflow of foreign investment has kept the things easy for the
Australian economy over the recent years.
3ECONOMICS ASSIGNMENT
Table of Contents
Introduction:...............................................................................................................................4
Association between Australia’s inflation rate and Real GDP growth rate:..............................5
Real GDP growth rate and Australia unemployment rate:.........................................................6
Evidence of the business cycle:..................................................................................................8
Association between real exchange rates and net exports of Australia and USA:.....................9
Association between USA Federal Reserve Fund’s rates and Australia’s Cash rates:............10
Movements in the Cash rates and Federal Reserve Fund’s rates:............................................12
Macroeconomic outlook of Australia:.....................................................................................12
Conclusion:..............................................................................................................................13
Reference:................................................................................................................................15
Appendix:.................................................................................................................................17
⊘ This is a preview!⊘
Do you want full access?
Subscribe today to unlock all pages.
Trusted by 1+ million students worldwide
4ECONOMICS ASSIGNMENT
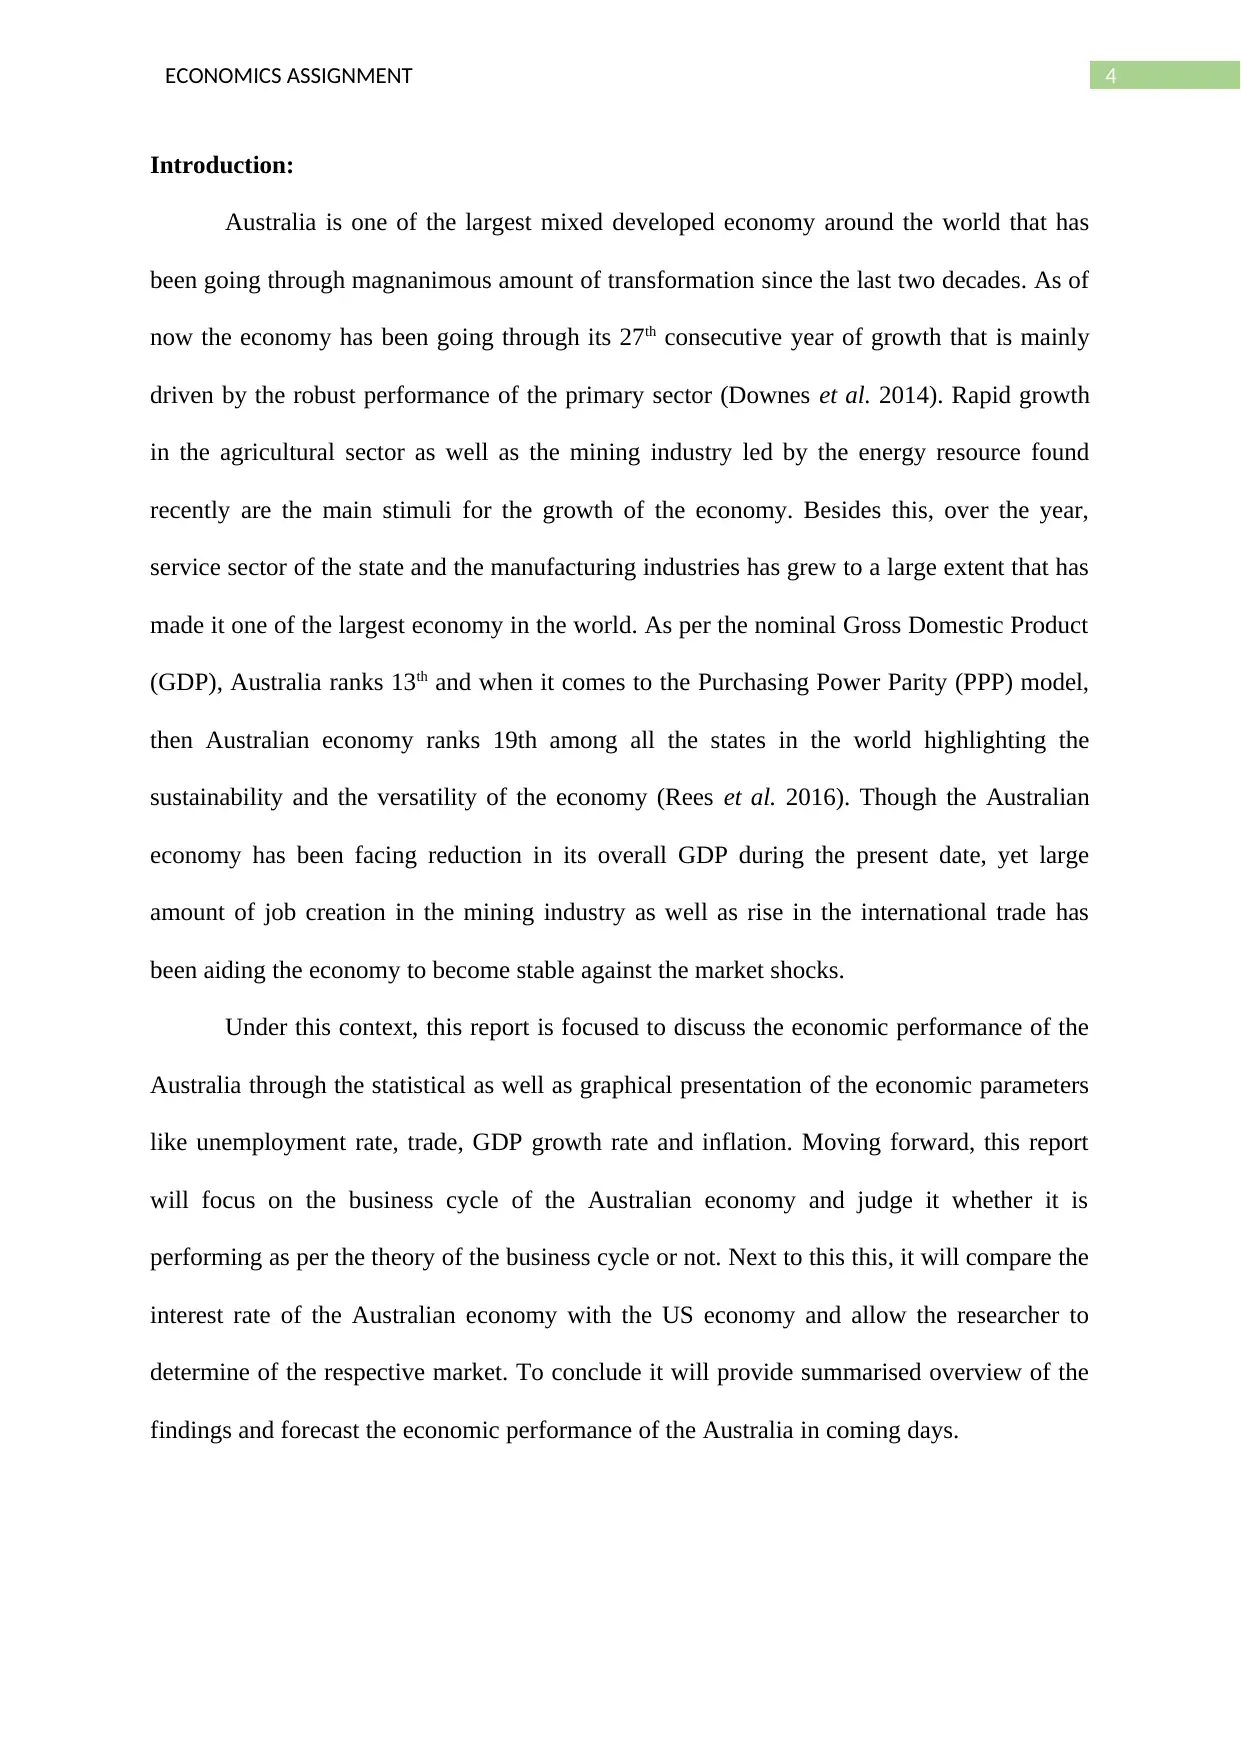
Introduction:
Australia is one of the largest mixed developed economy around the world that has
been going through magnanimous amount of transformation since the last two decades. As of
now the economy has been going through its 27th consecutive year of growth that is mainly
driven by the robust performance of the primary sector (Downes et al. 2014). Rapid growth
in the agricultural sector as well as the mining industry led by the energy resource found
recently are the main stimuli for the growth of the economy. Besides this, over the year,
service sector of the state and the manufacturing industries has grew to a large extent that has
made it one of the largest economy in the world. As per the nominal Gross Domestic Product
(GDP), Australia ranks 13th and when it comes to the Purchasing Power Parity (PPP) model,
then Australian economy ranks 19th among all the states in the world highlighting the
sustainability and the versatility of the economy (Rees et al. 2016). Though the Australian
economy has been facing reduction in its overall GDP during the present date, yet large
amount of job creation in the mining industry as well as rise in the international trade has
been aiding the economy to become stable against the market shocks.
Under this context, this report is focused to discuss the economic performance of the
Australia through the statistical as well as graphical presentation of the economic parameters
like unemployment rate, trade, GDP growth rate and inflation. Moving forward, this report
will focus on the business cycle of the Australian economy and judge it whether it is
performing as per the theory of the business cycle or not. Next to this this, it will compare the
interest rate of the Australian economy with the US economy and allow the researcher to
determine of the respective market. To conclude it will provide summarised overview of the
findings and forecast the economic performance of the Australia in coming days.
Paraphrase This Document
Need a fresh take? Get an instant paraphrase of this document with our AI Paraphraser
5ECONOMICS ASSIGNMENT
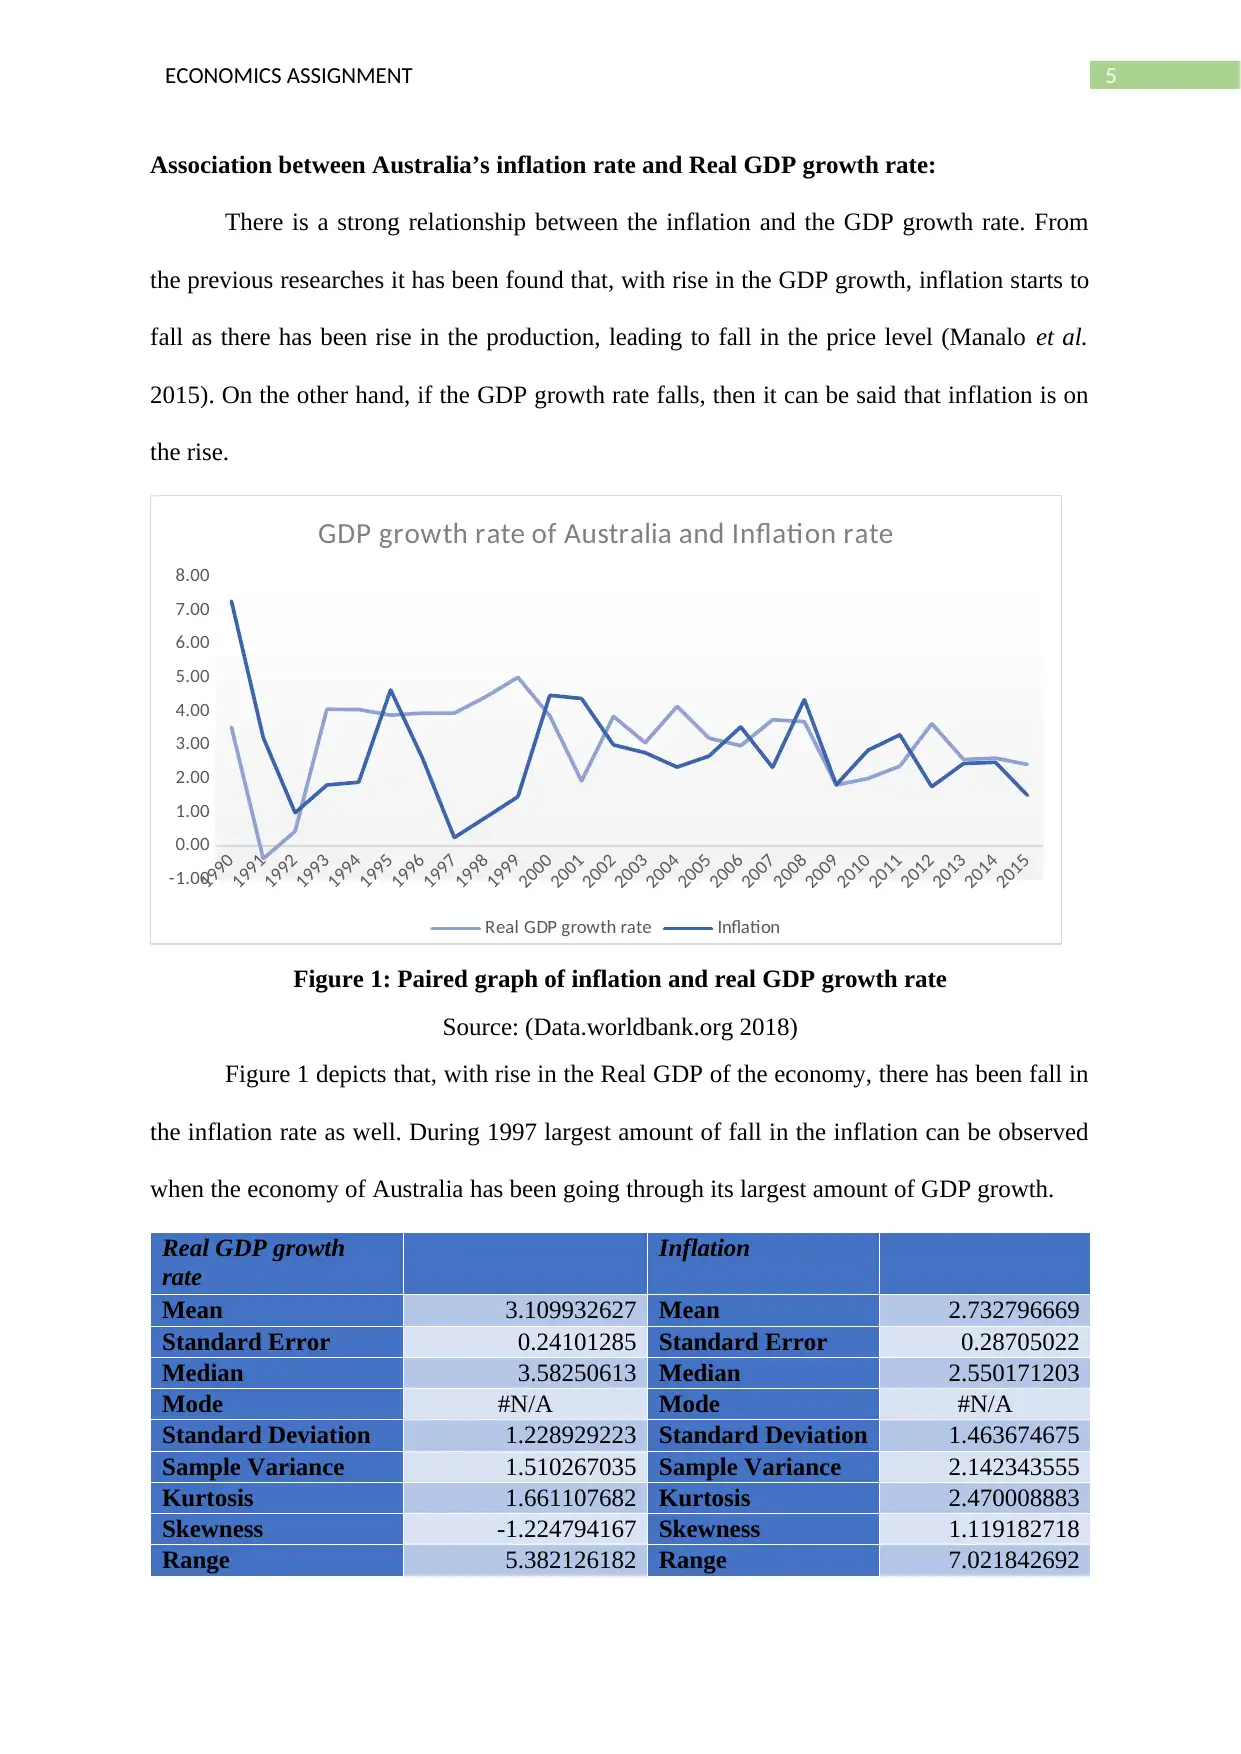
Association between Australia’s inflation rate and Real GDP growth rate:
There is a strong relationship between the inflation and the GDP growth rate. From
the previous researches it has been found that, with rise in the GDP growth, inflation starts to
fall as there has been rise in the production, leading to fall in the price level (Manalo et al.
2015). On the other hand, if the GDP growth rate falls, then it can be said that inflation is on
the rise.
1990
1991
1992
1993
1994
1995
1996
1997
1998
1999
2000
2001
2002
2003
2004
2005
2006
2007
2008
2009
2010
2011
2012
2013
2014
2015
-1.00
0.00
1.00
2.00
3.00
4.00
5.00
6.00
7.00
8.00
GDP growth rate of Australia and Inflation rate
Real GDP growth rate Inflation
Figure 1: Paired graph of inflation and real GDP growth rate
Source: (Data.worldbank.org 2018)
Figure 1 depicts that, with rise in the Real GDP of the economy, there has been fall in
the inflation rate as well. During 1997 largest amount of fall in the inflation can be observed
when the economy of Australia has been going through its largest amount of GDP growth.
Real GDP growth
rate
Inflation
Mean 3.109932627 Mean 2.732796669
Standard Error 0.24101285 Standard Error 0.28705022
Median 3.58250613 Median 2.550171203
Mode #N/A Mode #N/A
Standard Deviation 1.228929223 Standard Deviation 1.463674675
Sample Variance 1.510267035 Sample Variance 2.142343555
Kurtosis 1.661107682 Kurtosis 2.470008883
Skewness -1.224794167 Skewness 1.119182718
Range 5.382126182 Range 7.021842692
6ECONOMICS ASSIGNMENT
Minimum -0.375372306 Minimum 0.250417362
Maximum 5.006753877 Maximum 7.272260054
Sum 80.85824831 Sum 71.05271339
Count 26 Count 26
Table 1: Summary statistics of inflation and real GDP growth rate
Source: (Created by Author)
From the table 1, it can be seen that the mean inflation level in the Australian
economy is 2.73, which has proved to be beneficial for the economic growth of the state and
on the other hand mean rise in the GDP growth rate is 3.1, which highlights the steady
growth of the Australian economy (Reedman et al. 2018).
Real GDP growth rate Inflation
Real GDP growth rate 1
Inflation -0.030813091 1
Table 2: Association between the inflation and real GDP growth rate
Source: (Created by Author)
Table 2 showcase that there is negative association between the inflation and the real
GDP growth rate, which entails as the real GDP of the Australian economy rises, inflation
falls. It depicts that Australian economy has been performing as per the general rule of GDP
growth rate and inflation proving strong performance of the economy.
Real GDP growth rate and Australia unemployment rate:
Unemployment is another important macroeconomic indicator that highlights the
economic performance of a state. From the previous researches it has been found that, with
rise in the GDP growth rate, there has been fall in the unemployment rate too. As the
economy moves forward, its Real GDP starts to increase through the generation of
employment and fall in the level of unemployment (Ally et al. 2016).
⊘ This is a preview!⊘
Do you want full access?
Subscribe today to unlock all pages.
Trusted by 1+ million students worldwide
7ECONOMICS ASSIGNMENT
1990
1991
1992
1993
1994
1995
1996
1997
1998
1999
2000
2001
2002
2003
2004
2005
2006
2007
2008
2009
2010
2011
2012
2013
2014
2015
-2.00
0.00
2.00
4.00
6.00
8.00
10.00
12.00
Real GDP growth rate and Unemployment rate
Real GDP growth rate Unemployment
Axis Title
Axis Title
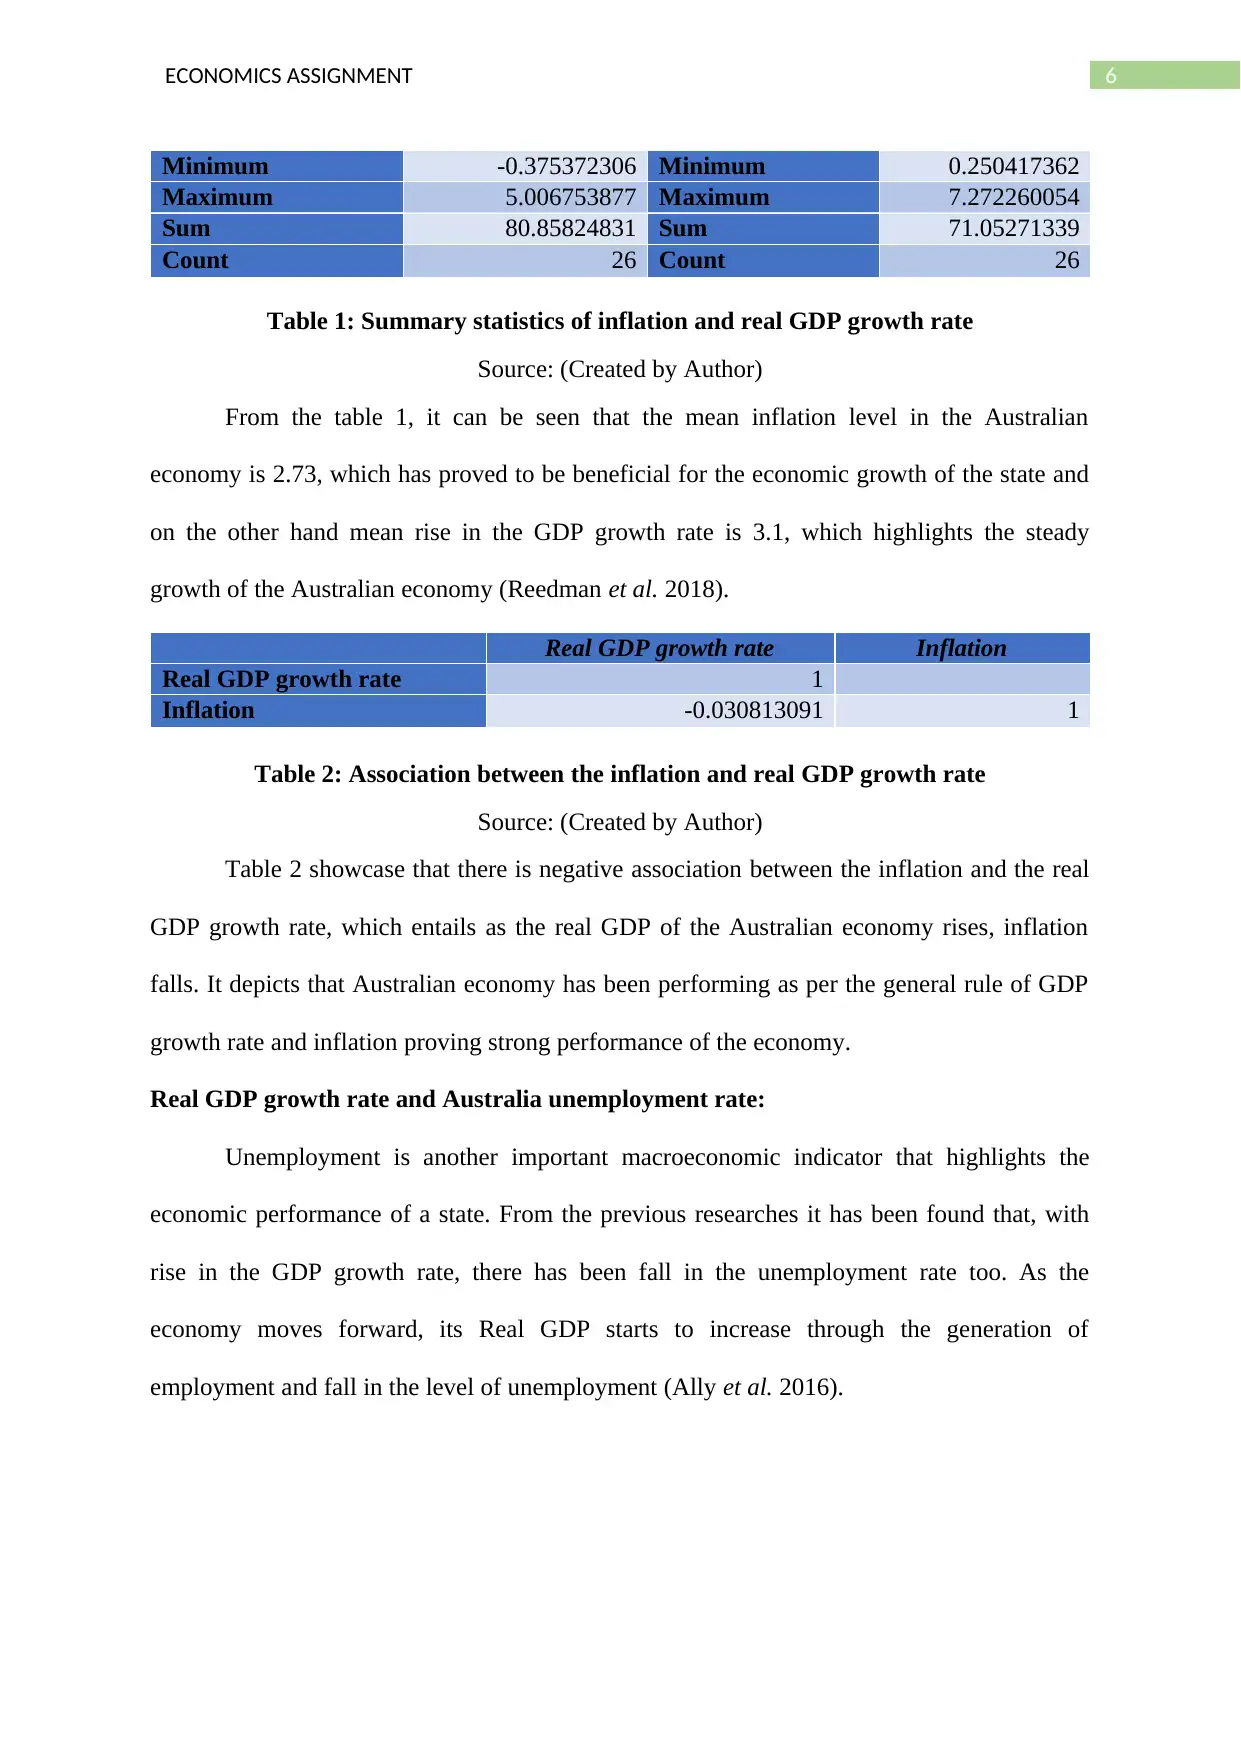
Figure 2: Paired graph of unemployment rate of Australia and Real GDP growth rate
Source: (Data.worldbank.org 2018)
Considering the figure 2, it can be seen that, as there has been rise in the Real GDP
growth rate, unemployment starts to fall. During the 1991, GDP growth rate of Australia was
highest and the unemployment as lowest (Pandya and Sisombat 2017). Since then as the GDP
growth rate started to fall, unemployment also increased over the time.
Real GDP growth rate Unemployment
Mean 3.109932627 Mean 6.758461494
Standard Error 0.24101285 Standard Error 0.376066964
Median 3.58250613 Median 6.180000067
Mode #N/A Mode #N/A
Standard Deviation 1.228929223 Standard Deviation 1.917572789
Sample Variance 1.510267035 Sample Variance 3.677085402
Kurtosis 1.661107682 Kurtosis -0.294397285
Skewness -1.22479417 Skewness 0.82510807
Range 5.382126182 Range 6.639999866
Minimum -0.37537231 Minimum 4.230000019
Maximum 5.006753877 Maximum 10.86999989
Sum 80.85824831 Sum 175.7199988
Count 26 Count 26
Table 3: Summary statistics of unemployment rate and Real GDP growth rate
Source: (Created by Author)
From the table 3 it can be seen that the mean unemployment rate of the Australian
economy is 6.75. Unemployment rate in the economy has fluctuated over time between the
1990
1991
1992
1993
1994
1995
1996
1997
1998
1999
2000
2001
2002
2003
2004
2005
2006
2007
2008
2009
2010
2011
2012
2013
2014
2015
-2.00
0.00
2.00
4.00
6.00
8.00
10.00
12.00
Real GDP growth rate and Unemployment rate
Real GDP growth rate Unemployment
Axis Title
Axis Title
Figure 2: Paired graph of unemployment rate of Australia and Real GDP growth rate
Source: (Data.worldbank.org 2018)
Considering the figure 2, it can be seen that, as there has been rise in the Real GDP
growth rate, unemployment starts to fall. During the 1991, GDP growth rate of Australia was
highest and the unemployment as lowest (Pandya and Sisombat 2017). Since then as the GDP
growth rate started to fall, unemployment also increased over the time.
Real GDP growth rate Unemployment
Mean 3.109932627 Mean 6.758461494
Standard Error 0.24101285 Standard Error 0.376066964
Median 3.58250613 Median 6.180000067
Mode #N/A Mode #N/A
Standard Deviation 1.228929223 Standard Deviation 1.917572789
Sample Variance 1.510267035 Sample Variance 3.677085402
Kurtosis 1.661107682 Kurtosis -0.294397285
Skewness -1.22479417 Skewness 0.82510807
Range 5.382126182 Range 6.639999866
Minimum -0.37537231 Minimum 4.230000019
Maximum 5.006753877 Maximum 10.86999989
Sum 80.85824831 Sum 175.7199988
Count 26 Count 26
Table 3: Summary statistics of unemployment rate and Real GDP growth rate
Source: (Created by Author)
From the table 3 it can be seen that the mean unemployment rate of the Australian
economy is 6.75. Unemployment rate in the economy has fluctuated over time between the
Paraphrase This Document
Need a fresh take? Get an instant paraphrase of this document with our AI Paraphraser
8ECONOMICS ASSIGNMENT
range of 6.18 to 6.75, which depicts Australian economy has been facing issues with its
unemployment level (Kydland et al 2016).
Real GDP growth
rate
Unemployment
Real GDP growth rate 1
Unemployment -0.13421 1
Table 4: Correlation between unemployment rate and Real GDP growth rate
Source: (Created by Author)
From the table 4, it can be seen that there is a negative relation between the real GDP
growth of Australia and the unemployment rate. Thus, it can be said that the Australian
economy has been performing as per the general rule of GDP growth rate and unemployment.
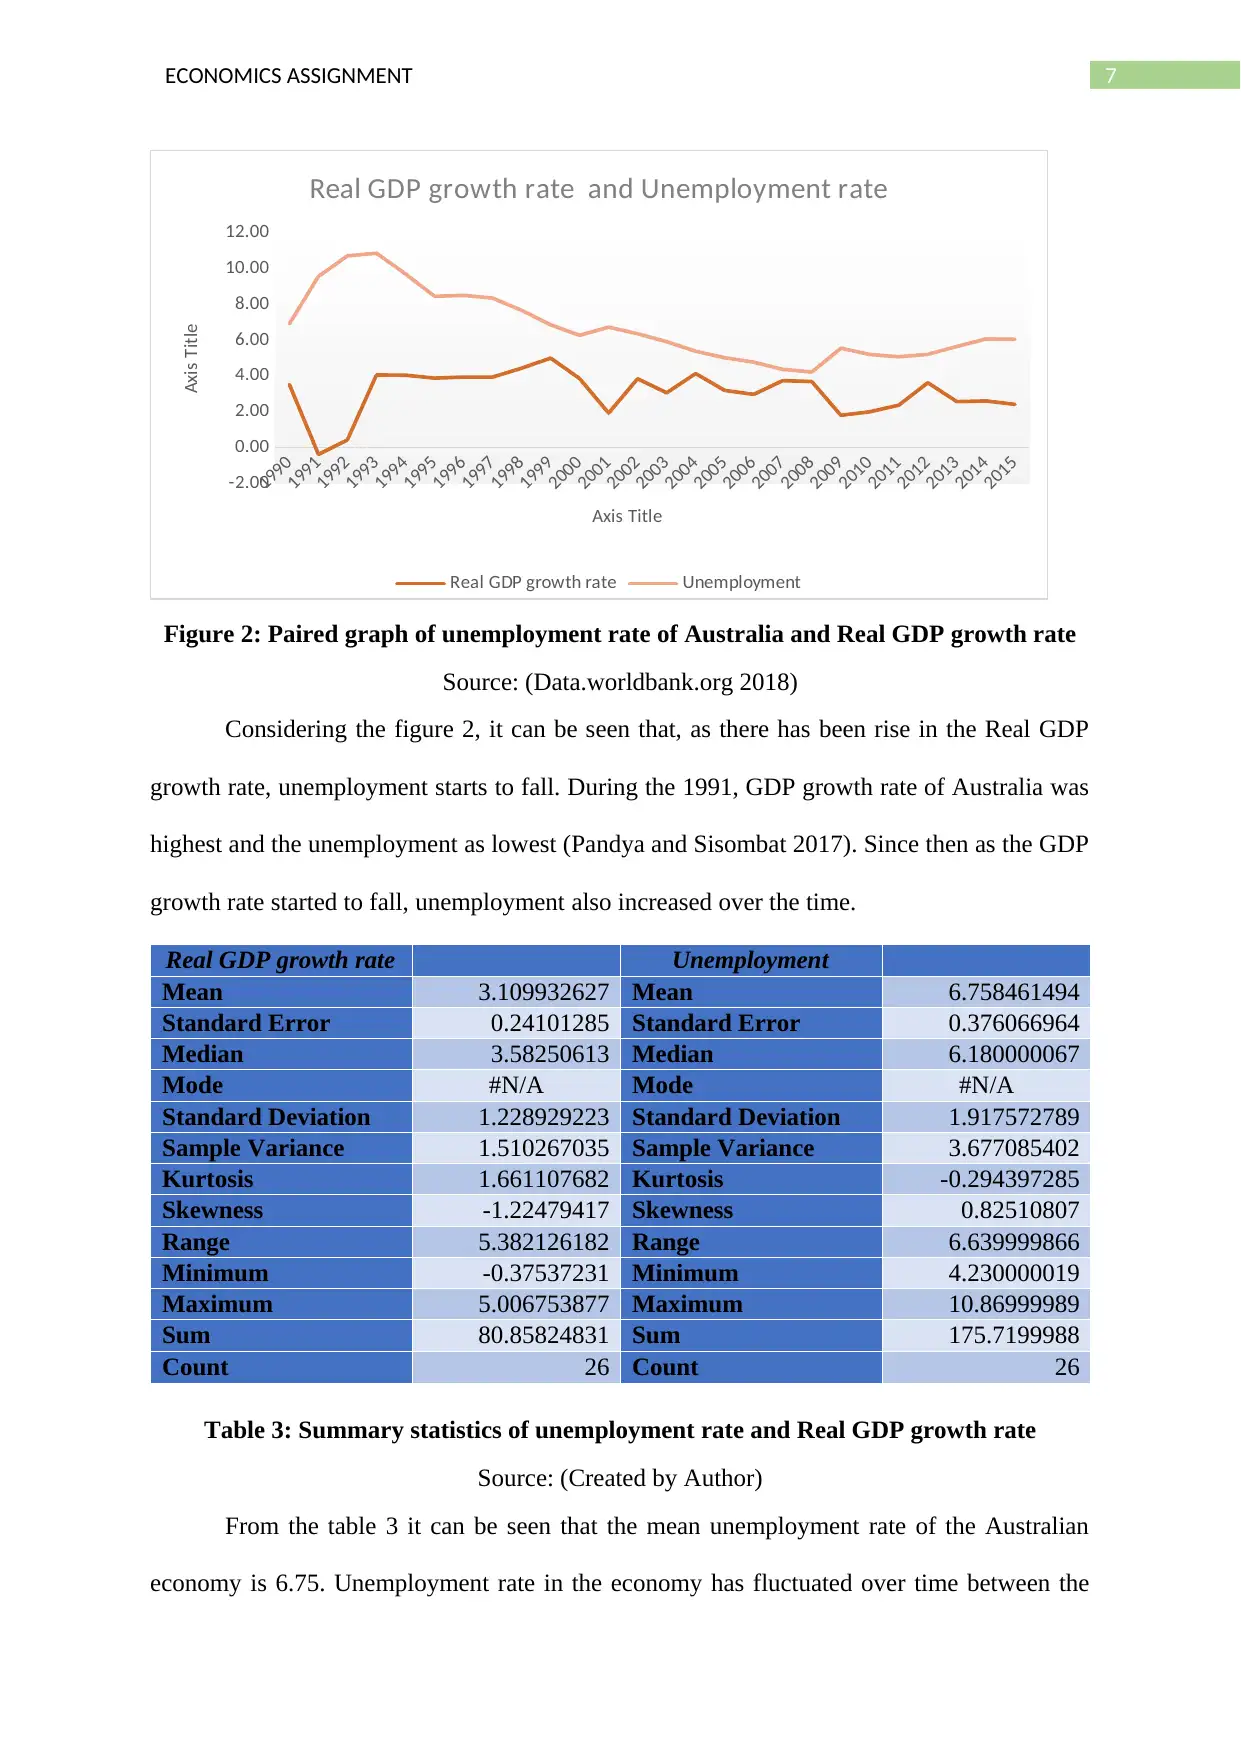
Evidence of the business cycle:
As per the business cycle theory, there are five stages, which are expansion, peak,
recession, contraction and tough session (Mankiw 2014). The world economy as well as the
Australian economy has gone through the recession during the 2008 and presently it is under
the growth stage (Jacobs and Rush 2015).
1990
1991
1992
1993
1994
1995
1996
1997
1998
1999
2000
2001
2002
2003
2004
2005
2006
2007
2008
2009
2010
2011
2012
2013
2014
2015
-1.00
0.00
1.00
2.00
3.00
4.00
5.00
6.00
Real GDP growth rate
Figure 3: Australian Real GDP growth rate
Source: (Data.worldbank.org 2018)
range of 6.18 to 6.75, which depicts Australian economy has been facing issues with its
unemployment level (Kydland et al 2016).
Real GDP growth
rate
Unemployment
Real GDP growth rate 1
Unemployment -0.13421 1
Table 4: Correlation between unemployment rate and Real GDP growth rate
Source: (Created by Author)
From the table 4, it can be seen that there is a negative relation between the real GDP
growth of Australia and the unemployment rate. Thus, it can be said that the Australian
economy has been performing as per the general rule of GDP growth rate and unemployment.
Evidence of the business cycle:
As per the business cycle theory, there are five stages, which are expansion, peak,
recession, contraction and tough session (Mankiw 2014). The world economy as well as the
Australian economy has gone through the recession during the 2008 and presently it is under
the growth stage (Jacobs and Rush 2015).
1990
1991
1992
1993
1994
1995
1996
1997
1998
1999
2000
2001
2002
2003
2004
2005
2006
2007
2008
2009
2010
2011
2012
2013
2014
2015
-1.00
0.00
1.00
2.00
3.00
4.00
5.00
6.00
Real GDP growth rate
Figure 3: Australian Real GDP growth rate
Source: (Data.worldbank.org 2018)
9ECONOMICS ASSIGNMENT
Considering the figure 3, it can be seen that the Australian economy also is presently
going through the growth stage, where the economy has been facing good amount of growth
in its GDP.
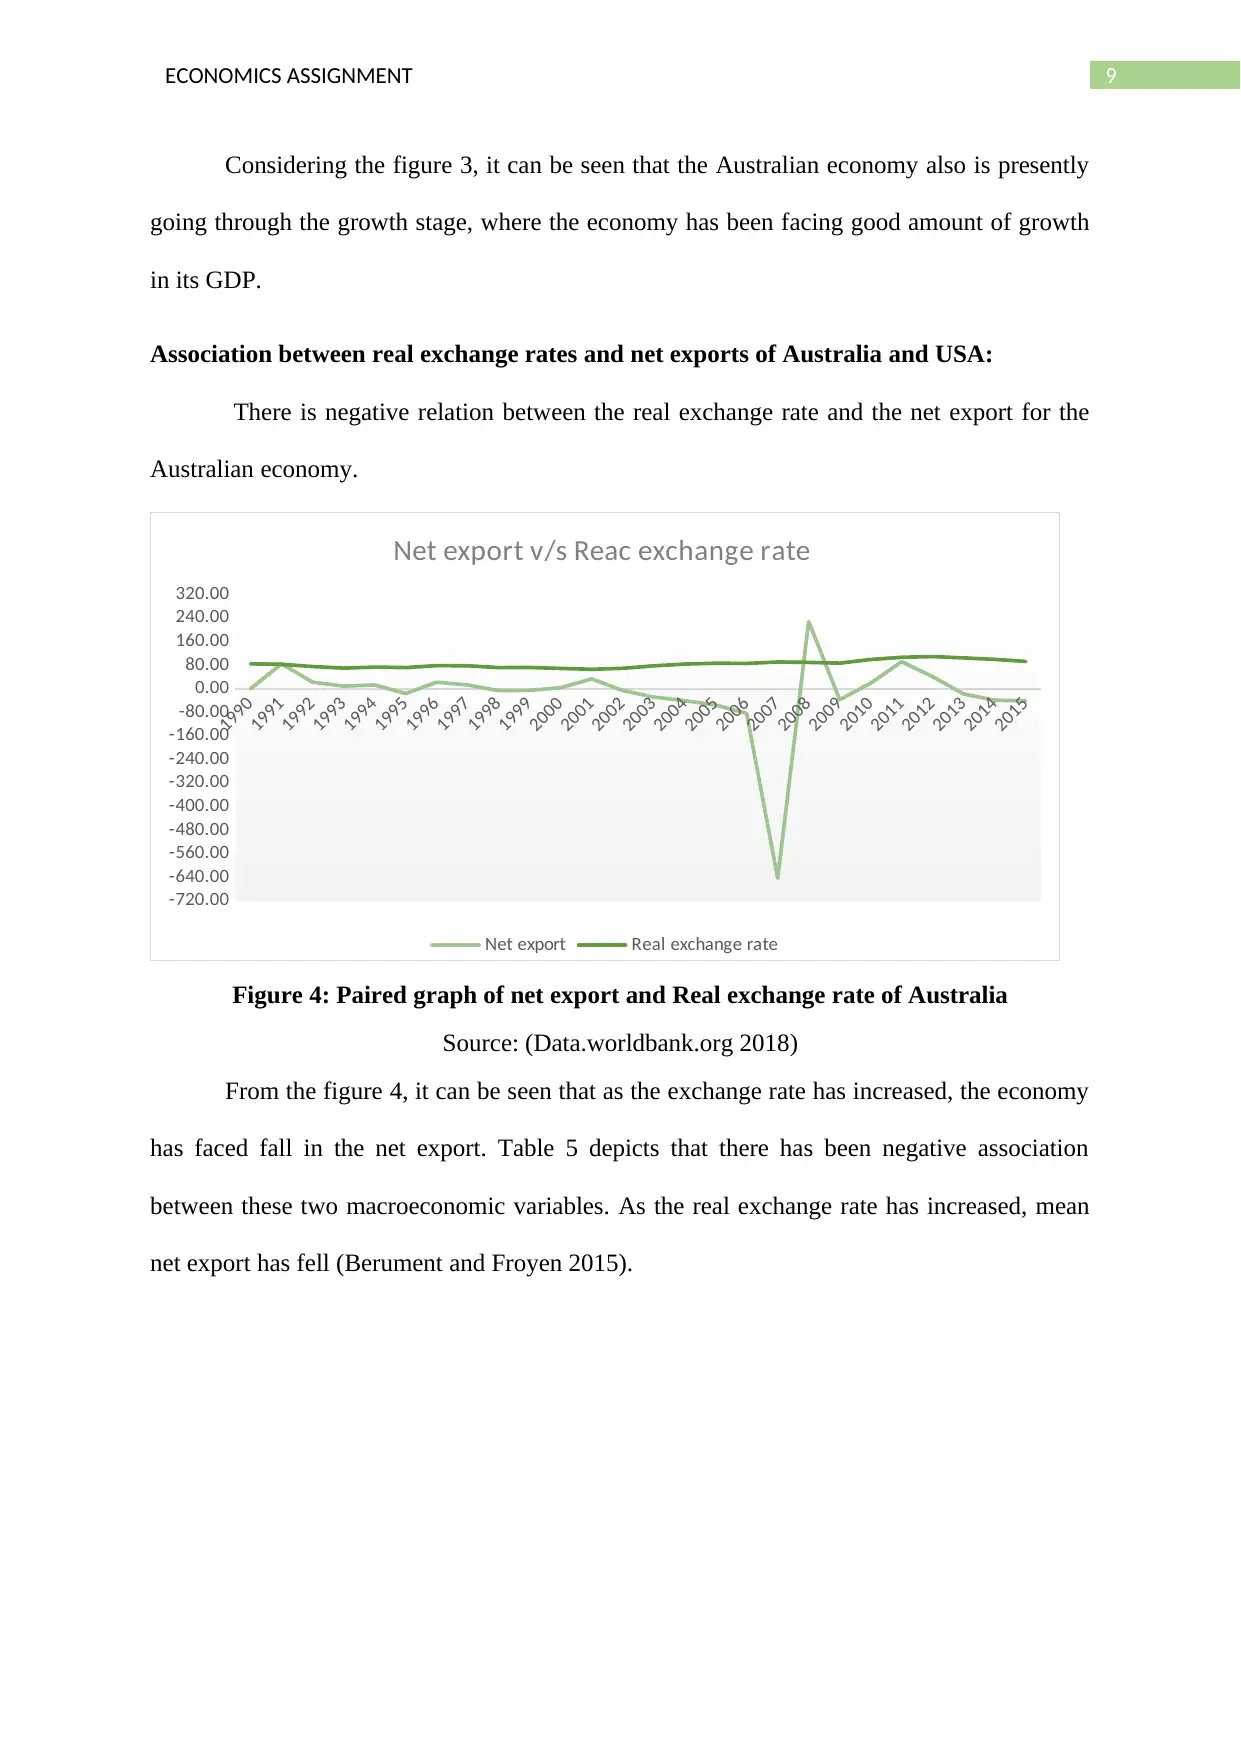
Association between real exchange rates and net exports of Australia and USA:
There is negative relation between the real exchange rate and the net export for the
Australian economy.
1990
1991
1992
1993
1994
1995
1996
1997
1998
1999
2000
2001
2002
2003
2004
2005
2006
2007
2008
2009
2010
2011
2012
2013
2014
2015
-720.00
-640.00
-560.00
-480.00
-400.00
-320.00
-240.00
-160.00
-80.00
0.00
80.00
160.00
240.00
320.00
Net export v/s Reac exchange rate
Net export Real exchange rate
Figure 4: Paired graph of net export and Real exchange rate of Australia
Source: (Data.worldbank.org 2018)
From the figure 4, it can be seen that as the exchange rate has increased, the economy
has faced fall in the net export. Table 5 depicts that there has been negative association
between these two macroeconomic variables. As the real exchange rate has increased, mean
net export has fell (Berument and Froyen 2015).
Considering the figure 3, it can be seen that the Australian economy also is presently
going through the growth stage, where the economy has been facing good amount of growth
in its GDP.
Association between real exchange rates and net exports of Australia and USA:
There is negative relation between the real exchange rate and the net export for the
Australian economy.
1990
1991
1992
1993
1994
1995
1996
1997
1998
1999
2000
2001
2002
2003
2004
2005
2006
2007
2008
2009
2010
2011
2012
2013
2014
2015
-720.00
-640.00
-560.00
-480.00
-400.00
-320.00
-240.00
-160.00
-80.00
0.00
80.00
160.00
240.00
320.00
Net export v/s Reac exchange rate
Net export Real exchange rate
Figure 4: Paired graph of net export and Real exchange rate of Australia
Source: (Data.worldbank.org 2018)
From the figure 4, it can be seen that as the exchange rate has increased, the economy
has faced fall in the net export. Table 5 depicts that there has been negative association
between these two macroeconomic variables. As the real exchange rate has increased, mean
net export has fell (Berument and Froyen 2015).
⊘ This is a preview!⊘
Do you want full access?
Subscribe today to unlock all pages.
Trusted by 1+ million students worldwide
10ECONOMICS ASSIGNMENT
Net export Real exchange rate
Mean -16.46833282 Mean 84.23797855
Standard Error 27.64978216 Standard Error 2.458253247
Median -2.159687892 Median 84.08738695
Mode #N/A Mode #N/A
Standard Deviation 140.9867788 Standard Deviation 12.53468128
Sample Variance 19877.27179 Sample Variance 157.1182347
Kurtosis 16.96395717 Kurtosis -0.632789153
Skewness -3.537881454 Skewness 0.571172065
Range 872.0743375 Range 43.2786843
Minimum -643.1317393 Minimum 66.6071117
Maximum 228.9425982 Maximum 109.885796
Sum -428.1766532 Sum 2190.187442
Count 26 Count 26
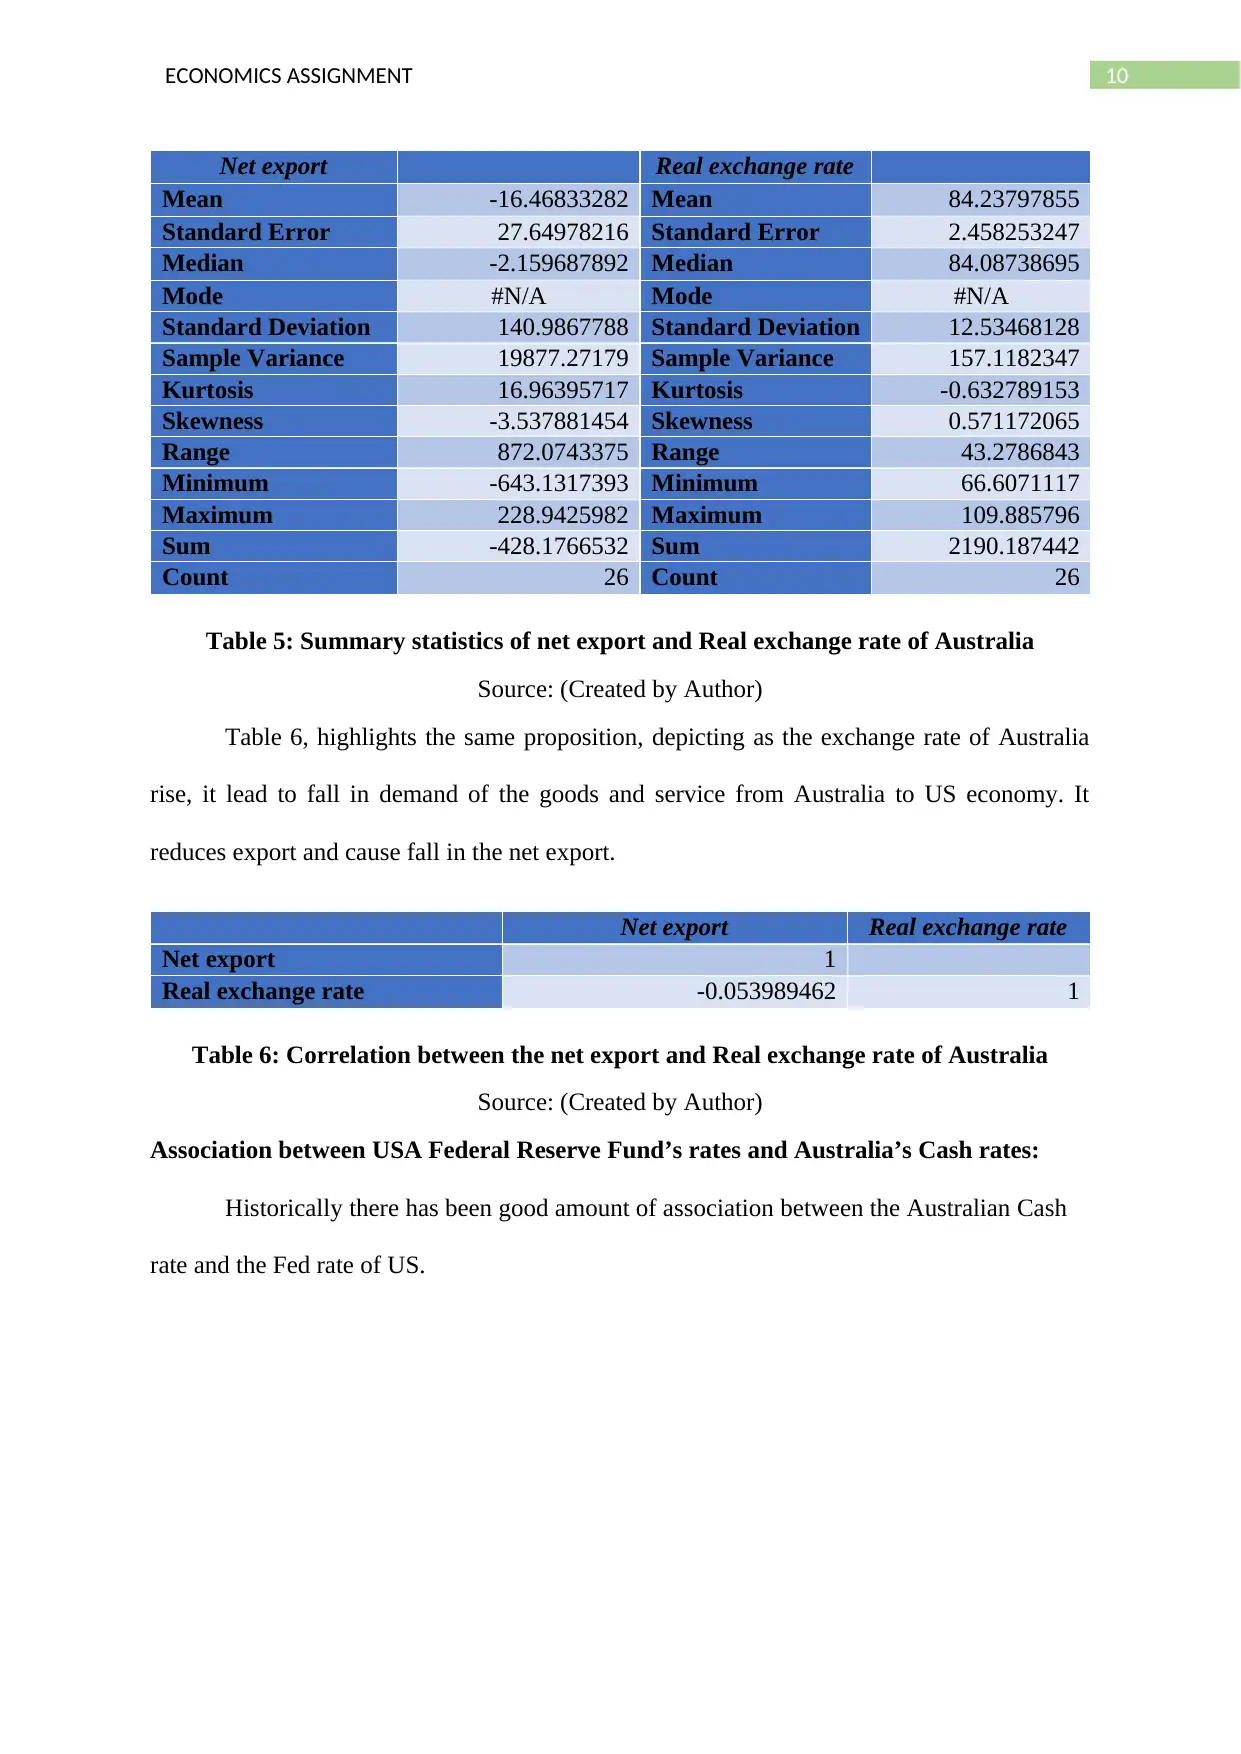
Table 5: Summary statistics of net export and Real exchange rate of Australia
Source: (Created by Author)
Table 6, highlights the same proposition, depicting as the exchange rate of Australia
rise, it lead to fall in demand of the goods and service from Australia to US economy. It
reduces export and cause fall in the net export.
Net export Real exchange rate
Net export 1
Real exchange rate -0.053989462 1
Table 6: Correlation between the net export and Real exchange rate of Australia
Source: (Created by Author)
Association between USA Federal Reserve Fund’s rates and Australia’s Cash rates:
Historically there has been good amount of association between the Australian Cash
rate and the Fed rate of US.
Net export Real exchange rate
Mean -16.46833282 Mean 84.23797855
Standard Error 27.64978216 Standard Error 2.458253247
Median -2.159687892 Median 84.08738695
Mode #N/A Mode #N/A
Standard Deviation 140.9867788 Standard Deviation 12.53468128
Sample Variance 19877.27179 Sample Variance 157.1182347
Kurtosis 16.96395717 Kurtosis -0.632789153
Skewness -3.537881454 Skewness 0.571172065
Range 872.0743375 Range 43.2786843
Minimum -643.1317393 Minimum 66.6071117
Maximum 228.9425982 Maximum 109.885796
Sum -428.1766532 Sum 2190.187442
Count 26 Count 26
Table 5: Summary statistics of net export and Real exchange rate of Australia
Source: (Created by Author)
Table 6, highlights the same proposition, depicting as the exchange rate of Australia
rise, it lead to fall in demand of the goods and service from Australia to US economy. It
reduces export and cause fall in the net export.
Net export Real exchange rate
Net export 1
Real exchange rate -0.053989462 1
Table 6: Correlation between the net export and Real exchange rate of Australia
Source: (Created by Author)
Association between USA Federal Reserve Fund’s rates and Australia’s Cash rates:
Historically there has been good amount of association between the Australian Cash
rate and the Fed rate of US.
Paraphrase This Document
Need a fresh take? Get an instant paraphrase of this document with our AI Paraphraser
11ECONOMICS ASSIGNMENT
1990
1991
1992
1993
1994
1995
1996
1997
1998
1999
2000
2001
2002
2003
2004
2005
2006
2007
2008
2009
2010
2011
2012
2013
2014
2015
0.00
2.00
4.00
6.00
8.00
10.00
12.00
Cash rate v/s Fed rate
Cash rate Fed rate
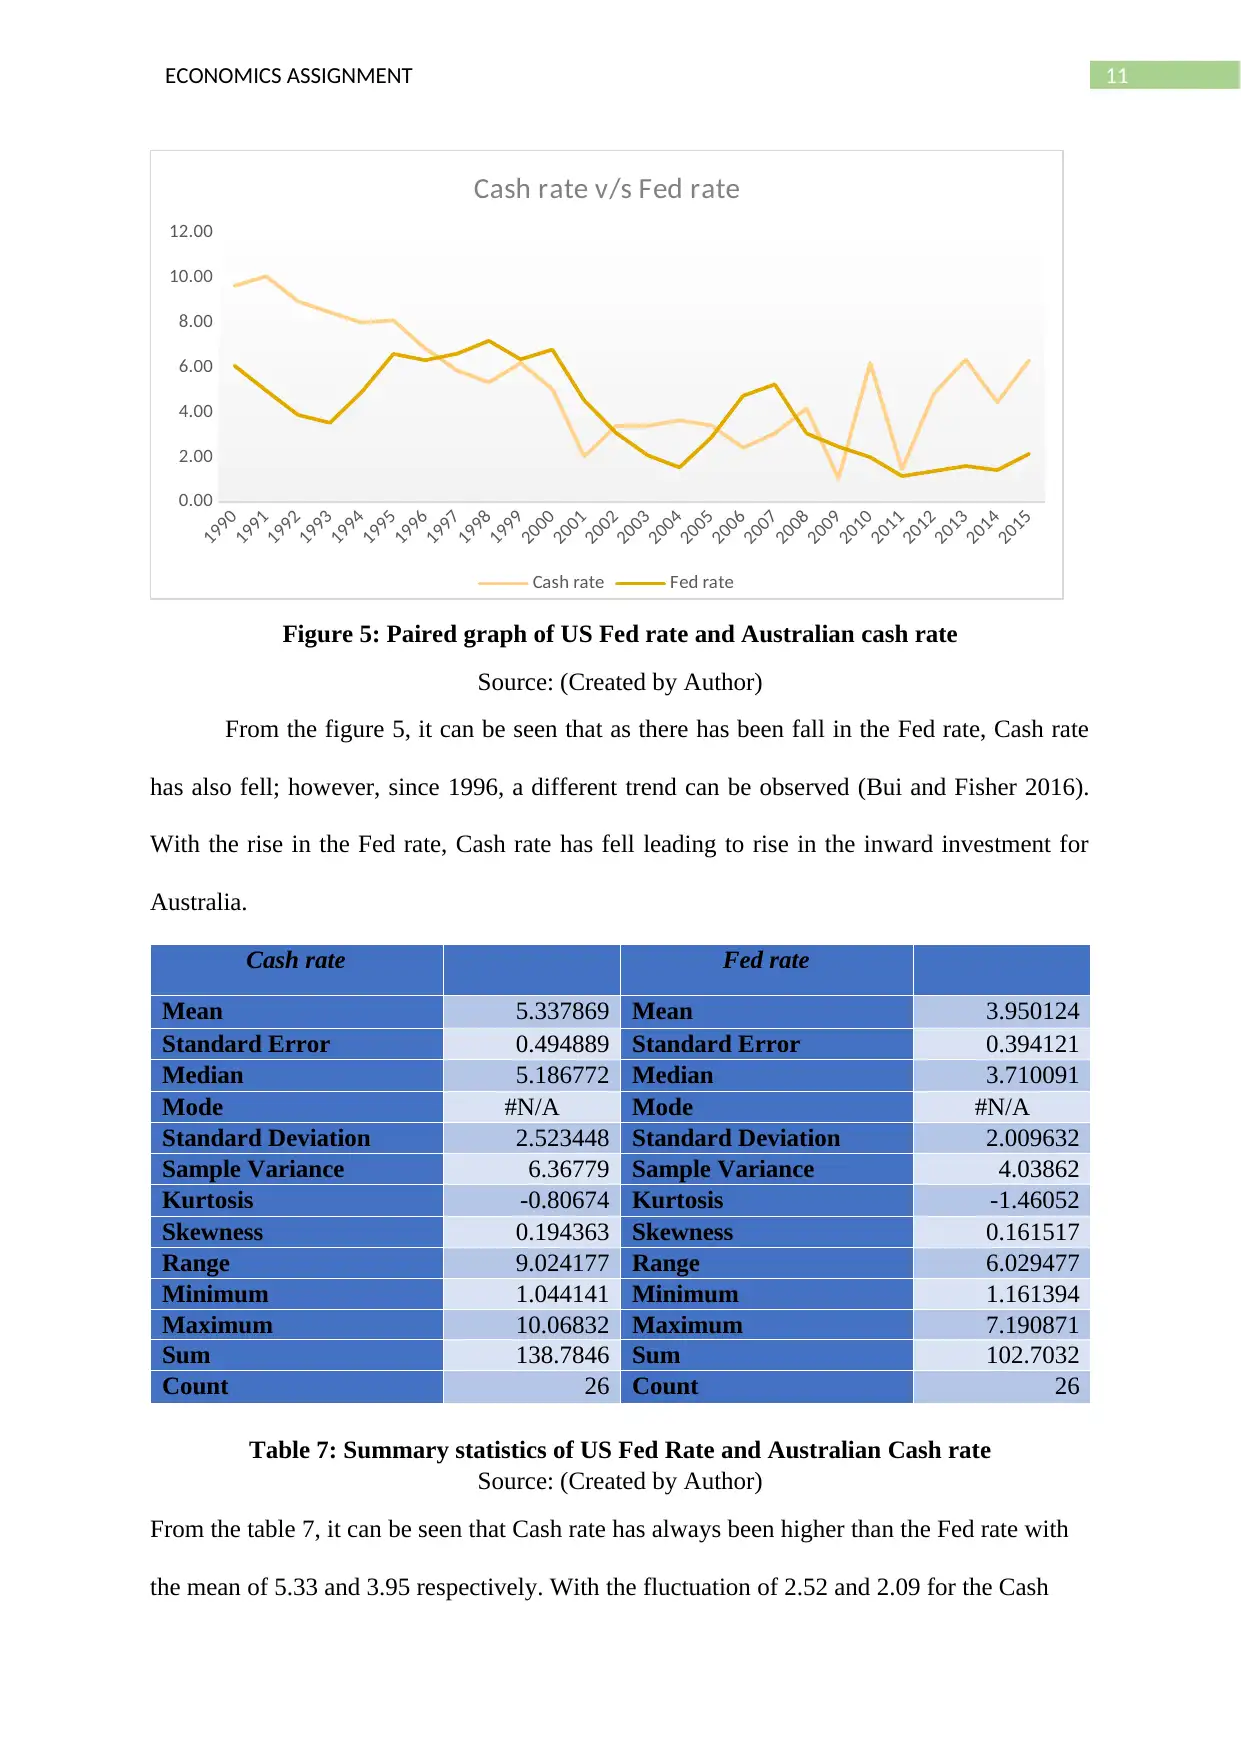
Figure 5: Paired graph of US Fed rate and Australian cash rate
Source: (Created by Author)
From the figure 5, it can be seen that as there has been fall in the Fed rate, Cash rate
has also fell; however, since 1996, a different trend can be observed (Bui and Fisher 2016).
With the rise in the Fed rate, Cash rate has fell leading to rise in the inward investment for
Australia.
Cash rate Fed rate
Mean 5.337869 Mean 3.950124
Standard Error 0.494889 Standard Error 0.394121
Median 5.186772 Median 3.710091
Mode #N/A Mode #N/A
Standard Deviation 2.523448 Standard Deviation 2.009632
Sample Variance 6.36779 Sample Variance 4.03862
Kurtosis -0.80674 Kurtosis -1.46052
Skewness 0.194363 Skewness 0.161517
Range 9.024177 Range 6.029477
Minimum 1.044141 Minimum 1.161394
Maximum 10.06832 Maximum 7.190871
Sum 138.7846 Sum 102.7032
Count 26 Count 26
Table 7: Summary statistics of US Fed Rate and Australian Cash rate
Source: (Created by Author)
From the table 7, it can be seen that Cash rate has always been higher than the Fed rate with
the mean of 5.33 and 3.95 respectively. With the fluctuation of 2.52 and 2.09 for the Cash
1990
1991
1992
1993
1994
1995
1996
1997
1998
1999
2000
2001
2002
2003
2004
2005
2006
2007
2008
2009
2010
2011
2012
2013
2014
2015
0.00
2.00
4.00
6.00
8.00
10.00
12.00
Cash rate v/s Fed rate
Cash rate Fed rate
Figure 5: Paired graph of US Fed rate and Australian cash rate
Source: (Created by Author)
From the figure 5, it can be seen that as there has been fall in the Fed rate, Cash rate
has also fell; however, since 1996, a different trend can be observed (Bui and Fisher 2016).
With the rise in the Fed rate, Cash rate has fell leading to rise in the inward investment for
Australia.
Cash rate Fed rate
Mean 5.337869 Mean 3.950124
Standard Error 0.494889 Standard Error 0.394121
Median 5.186772 Median 3.710091
Mode #N/A Mode #N/A
Standard Deviation 2.523448 Standard Deviation 2.009632
Sample Variance 6.36779 Sample Variance 4.03862
Kurtosis -0.80674 Kurtosis -1.46052
Skewness 0.194363 Skewness 0.161517
Range 9.024177 Range 6.029477
Minimum 1.044141 Minimum 1.161394
Maximum 10.06832 Maximum 7.190871
Sum 138.7846 Sum 102.7032
Count 26 Count 26
Table 7: Summary statistics of US Fed Rate and Australian Cash rate
Source: (Created by Author)
From the table 7, it can be seen that Cash rate has always been higher than the Fed rate with
the mean of 5.33 and 3.95 respectively. With the fluctuation of 2.52 and 2.09 for the Cash
12ECONOMICS ASSIGNMENT
rate and Fed rate respectively, both of them over the time has showcased some degree of
association too.
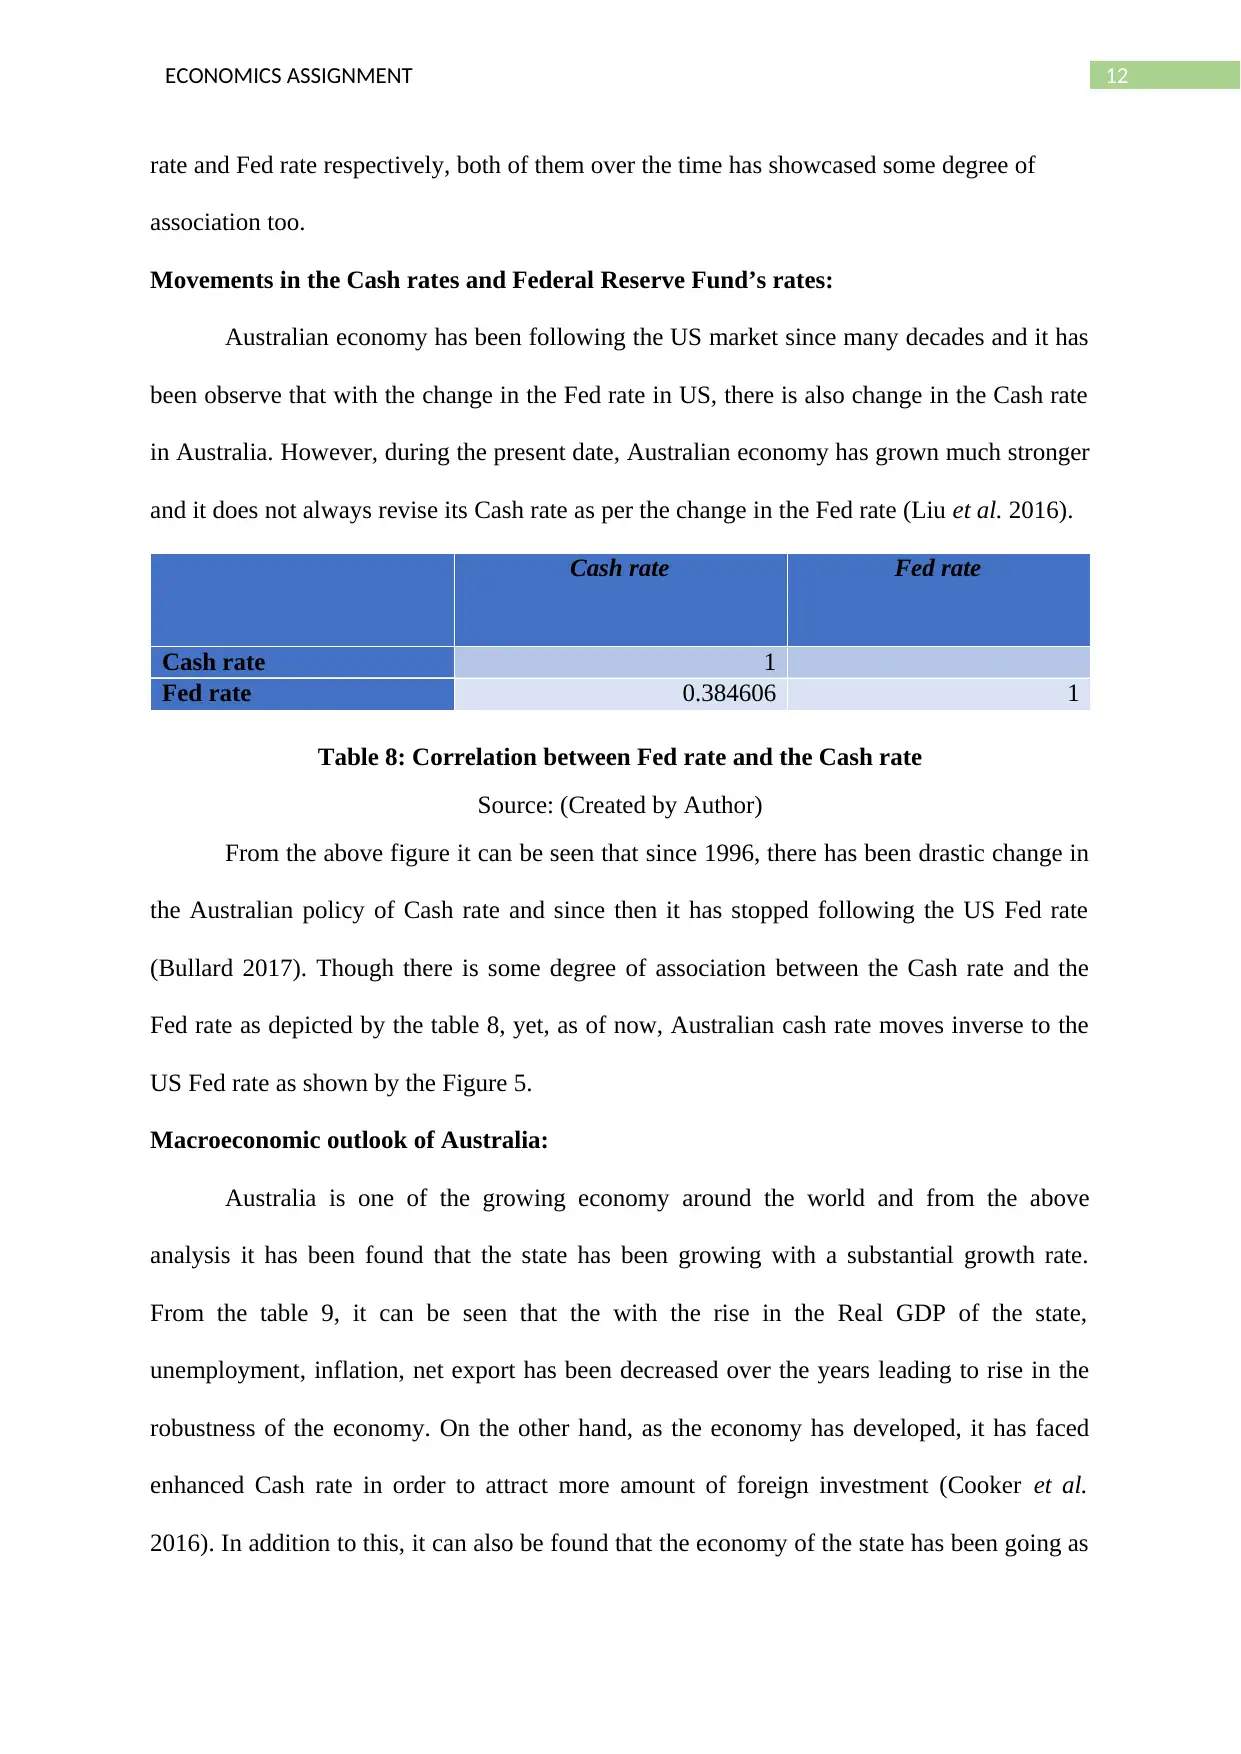
Movements in the Cash rates and Federal Reserve Fund’s rates:
Australian economy has been following the US market since many decades and it has
been observe that with the change in the Fed rate in US, there is also change in the Cash rate
in Australia. However, during the present date, Australian economy has grown much stronger
and it does not always revise its Cash rate as per the change in the Fed rate (Liu et al. 2016).
Cash rate Fed rate
Cash rate 1
Fed rate 0.384606 1
Table 8: Correlation between Fed rate and the Cash rate
Source: (Created by Author)
From the above figure it can be seen that since 1996, there has been drastic change in
the Australian policy of Cash rate and since then it has stopped following the US Fed rate
(Bullard 2017). Though there is some degree of association between the Cash rate and the
Fed rate as depicted by the table 8, yet, as of now, Australian cash rate moves inverse to the
US Fed rate as shown by the Figure 5.
Macroeconomic outlook of Australia:
Australia is one of the growing economy around the world and from the above
analysis it has been found that the state has been growing with a substantial growth rate.
From the table 9, it can be seen that the with the rise in the Real GDP of the state,
unemployment, inflation, net export has been decreased over the years leading to rise in the
robustness of the economy. On the other hand, as the economy has developed, it has faced
enhanced Cash rate in order to attract more amount of foreign investment (Cooker et al.
2016). In addition to this, it can also be found that the economy of the state has been going as
rate and Fed rate respectively, both of them over the time has showcased some degree of
association too.
Movements in the Cash rates and Federal Reserve Fund’s rates:
Australian economy has been following the US market since many decades and it has
been observe that with the change in the Fed rate in US, there is also change in the Cash rate
in Australia. However, during the present date, Australian economy has grown much stronger
and it does not always revise its Cash rate as per the change in the Fed rate (Liu et al. 2016).
Cash rate Fed rate
Cash rate 1
Fed rate 0.384606 1
Table 8: Correlation between Fed rate and the Cash rate
Source: (Created by Author)
From the above figure it can be seen that since 1996, there has been drastic change in
the Australian policy of Cash rate and since then it has stopped following the US Fed rate
(Bullard 2017). Though there is some degree of association between the Cash rate and the
Fed rate as depicted by the table 8, yet, as of now, Australian cash rate moves inverse to the
US Fed rate as shown by the Figure 5.
Macroeconomic outlook of Australia:
Australia is one of the growing economy around the world and from the above
analysis it has been found that the state has been growing with a substantial growth rate.
From the table 9, it can be seen that the with the rise in the Real GDP of the state,
unemployment, inflation, net export has been decreased over the years leading to rise in the
robustness of the economy. On the other hand, as the economy has developed, it has faced
enhanced Cash rate in order to attract more amount of foreign investment (Cooker et al.
2016). In addition to this, it can also be found that the economy of the state has been going as
⊘ This is a preview!⊘
Do you want full access?
Subscribe today to unlock all pages.
Trusted by 1+ million students worldwide
1 out of 17
Related Documents


Your All-in-One AI-Powered Toolkit for Academic Success.
+13062052269
info@desklib.com
Available 24*7 on WhatsApp / Email
![[object Object]](/_next/static/media/star-bottom.7253800d.svg)
Unlock your academic potential
Copyright © 2020–2026 A2Z Services. All Rights Reserved. Developed and managed by ZUCOL.