Australia's Economic Analysis Report
VerifiedAdded on 2019/12/28
|10
|1477
|181
Report
AI Summary
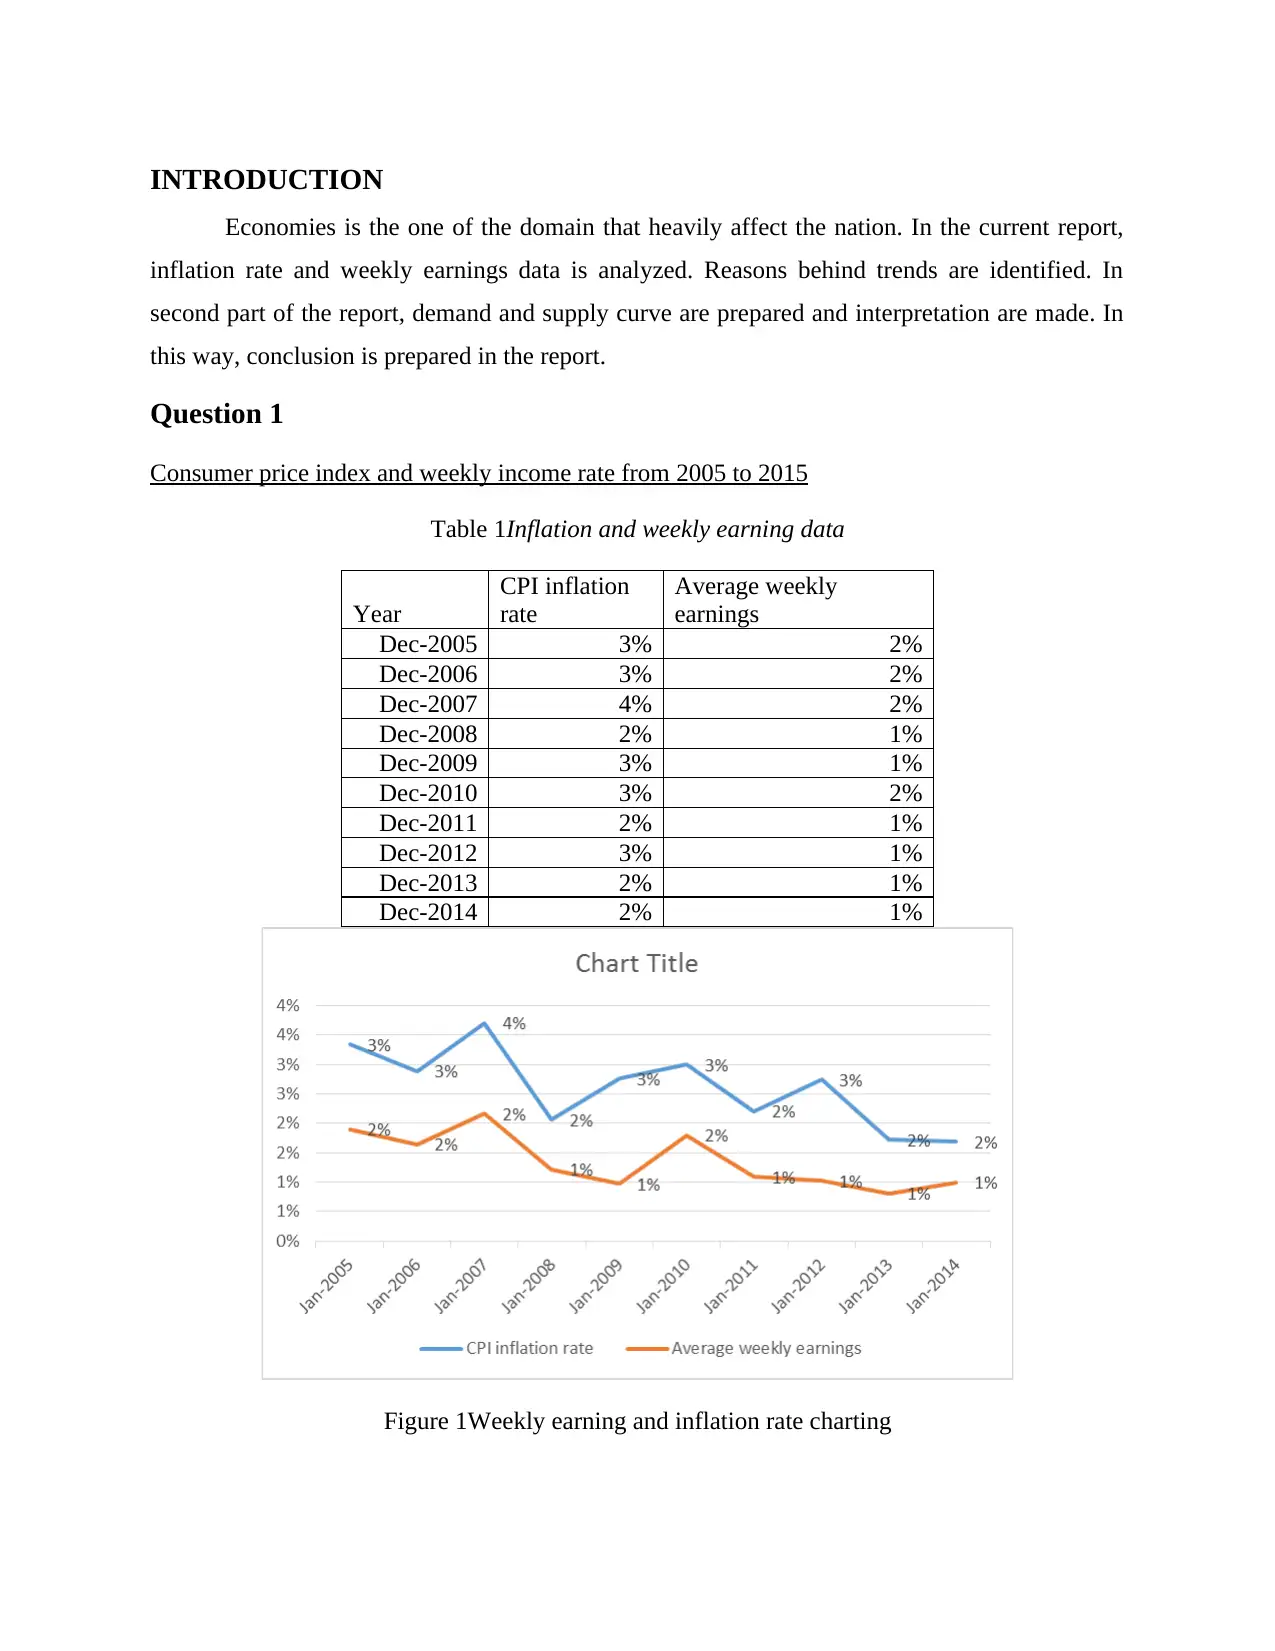
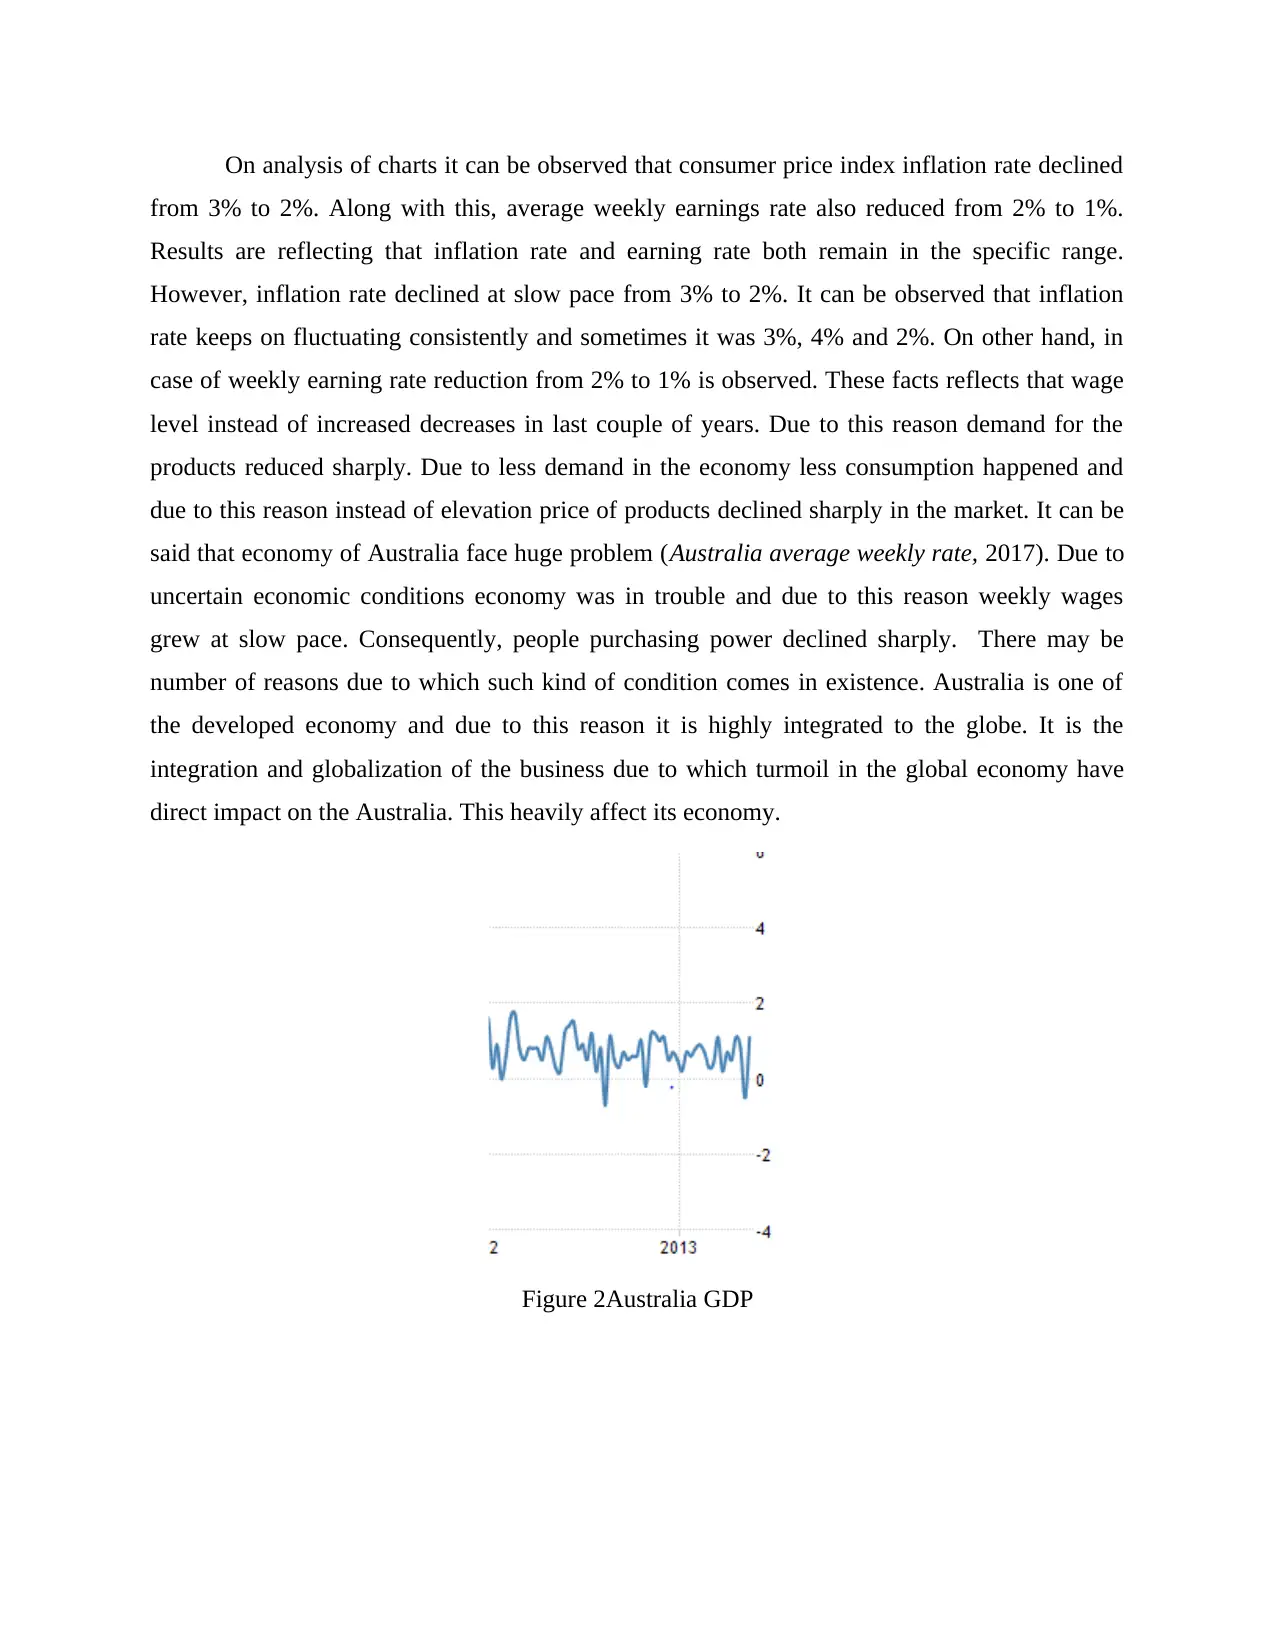
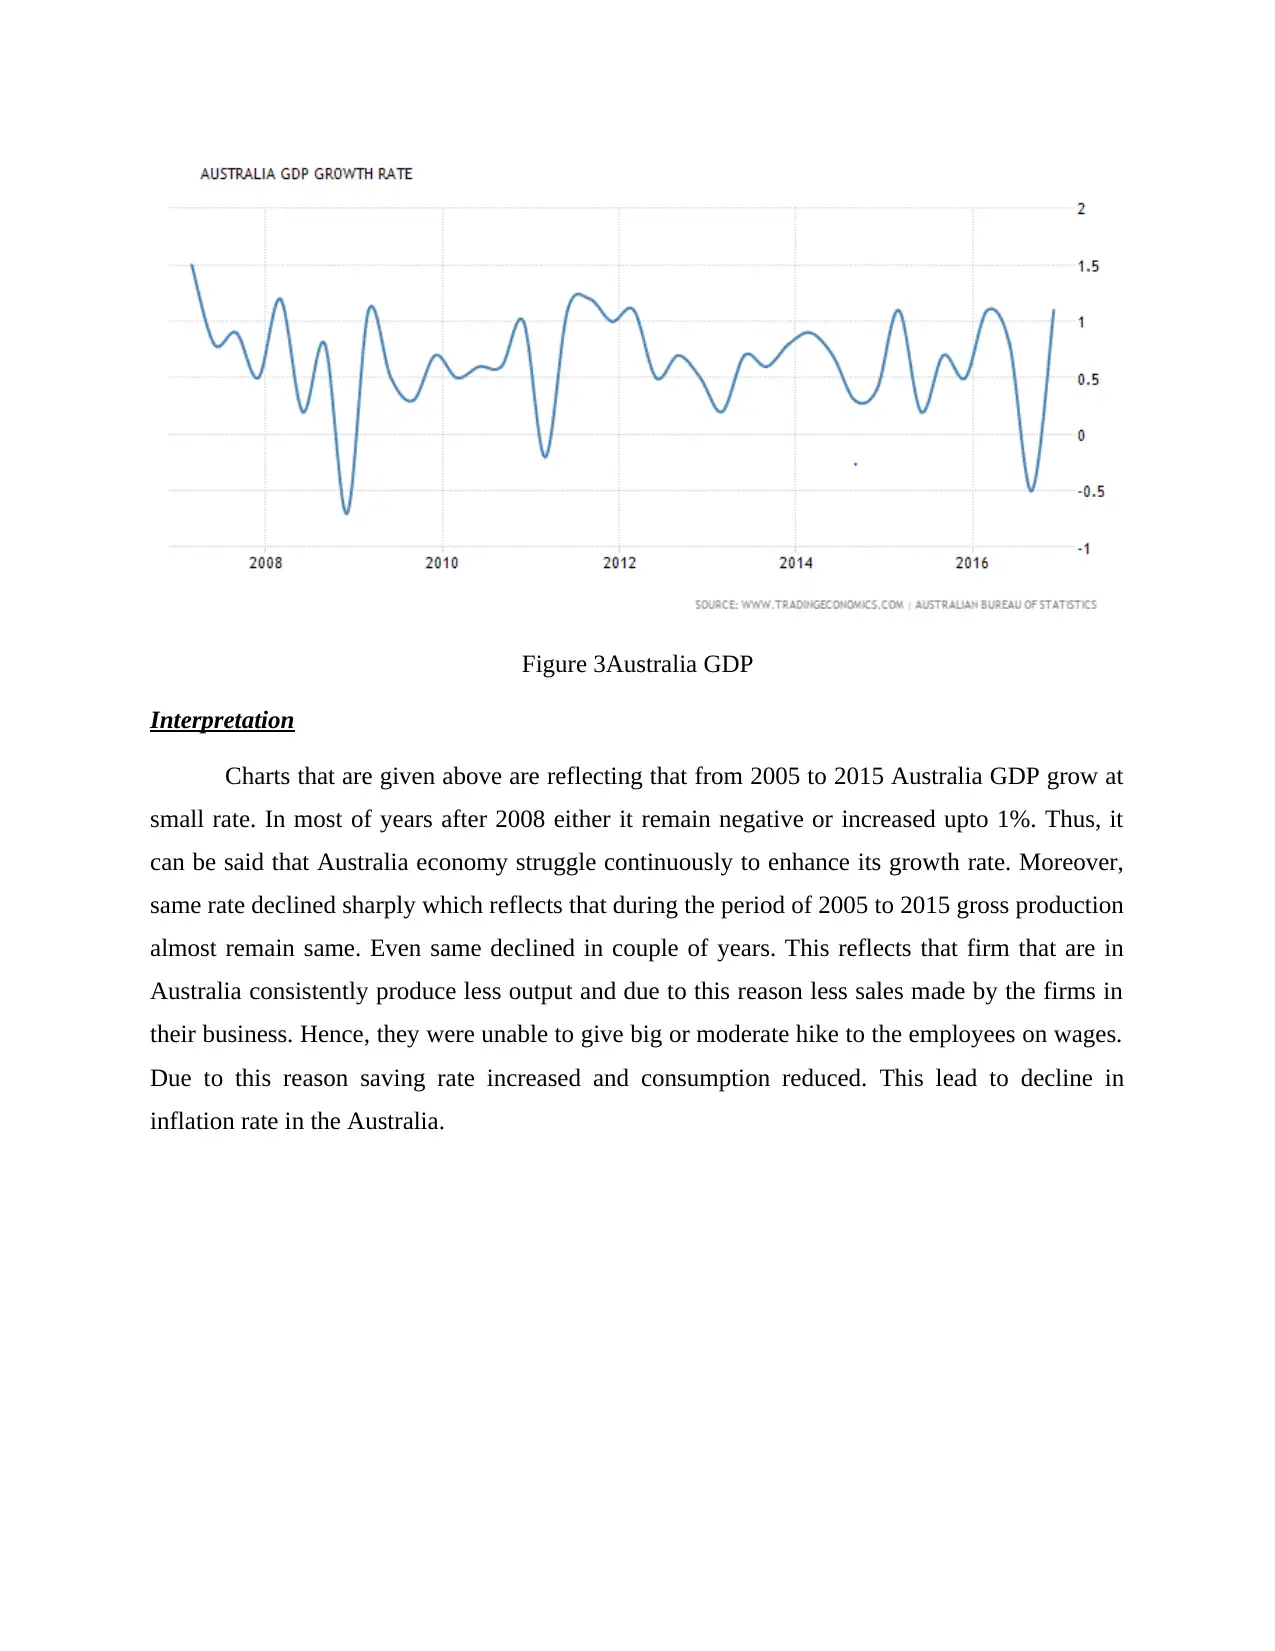
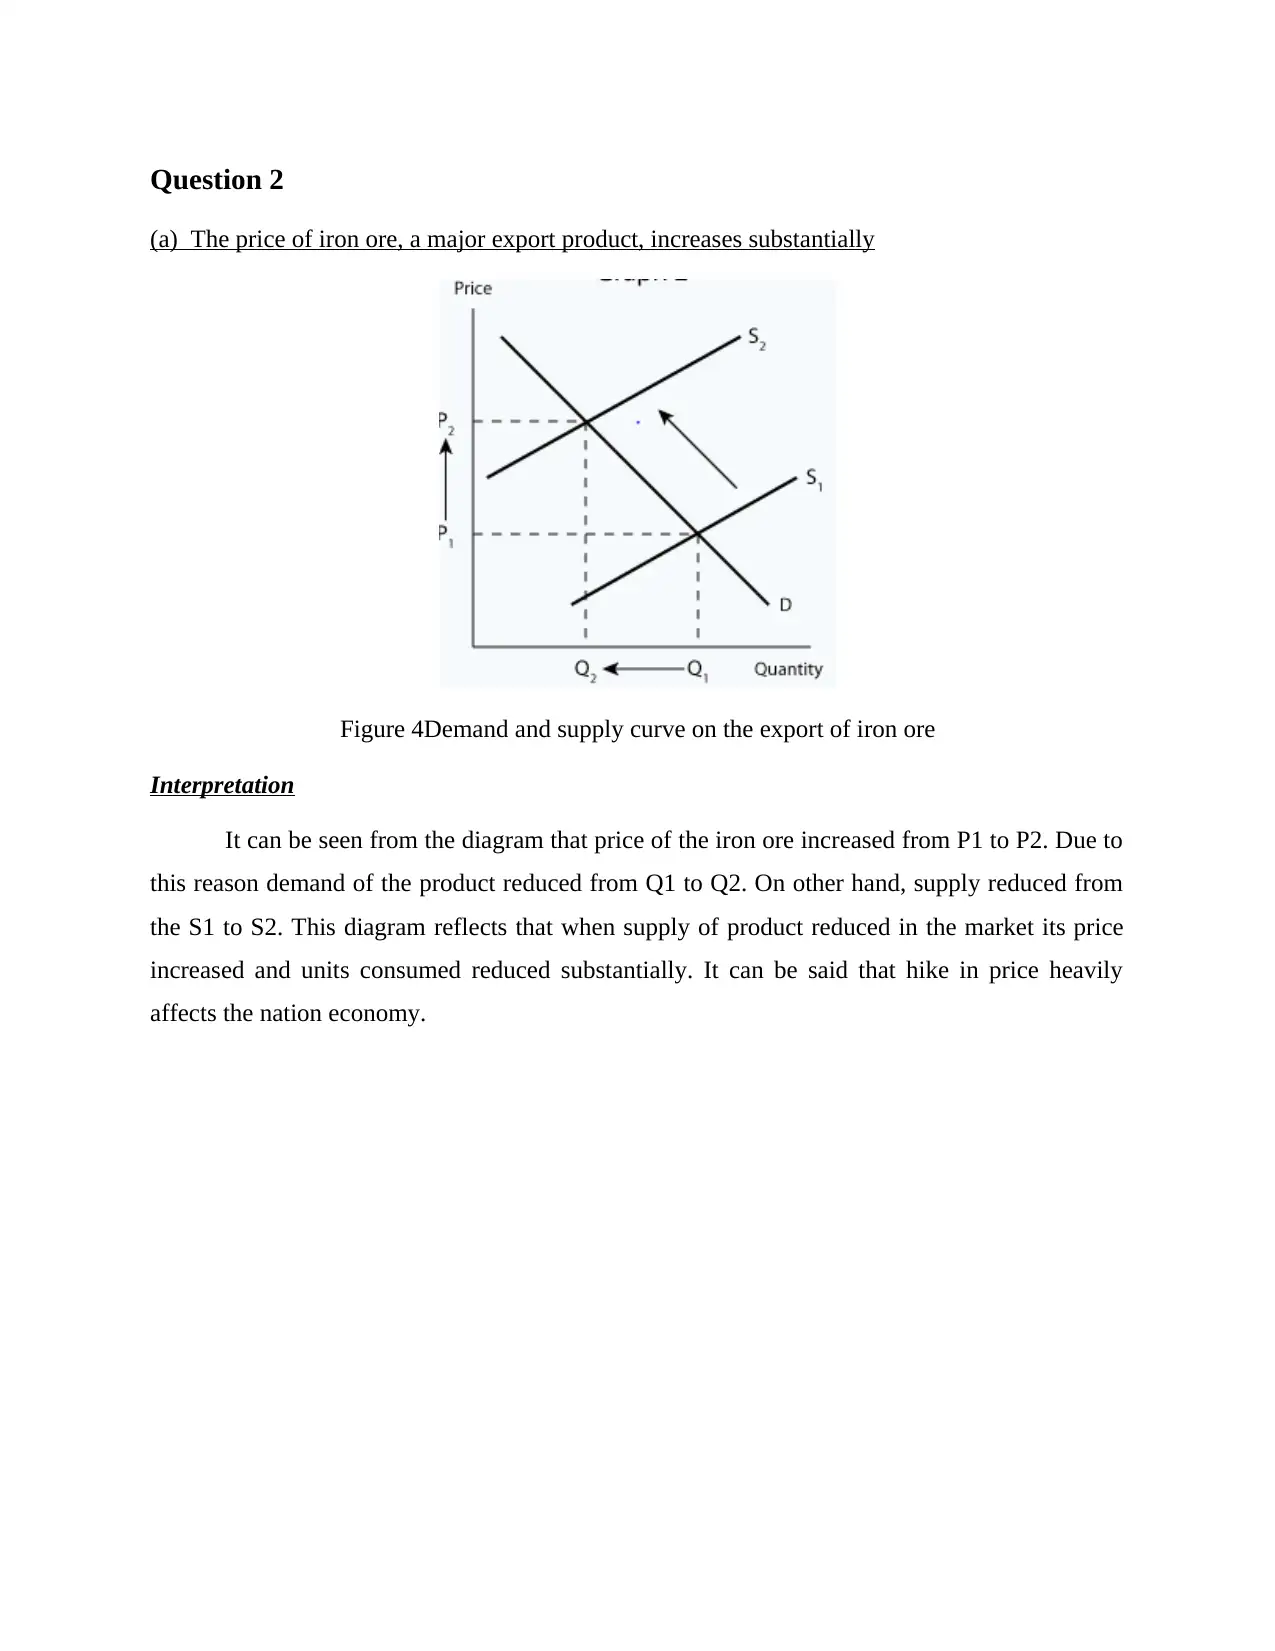
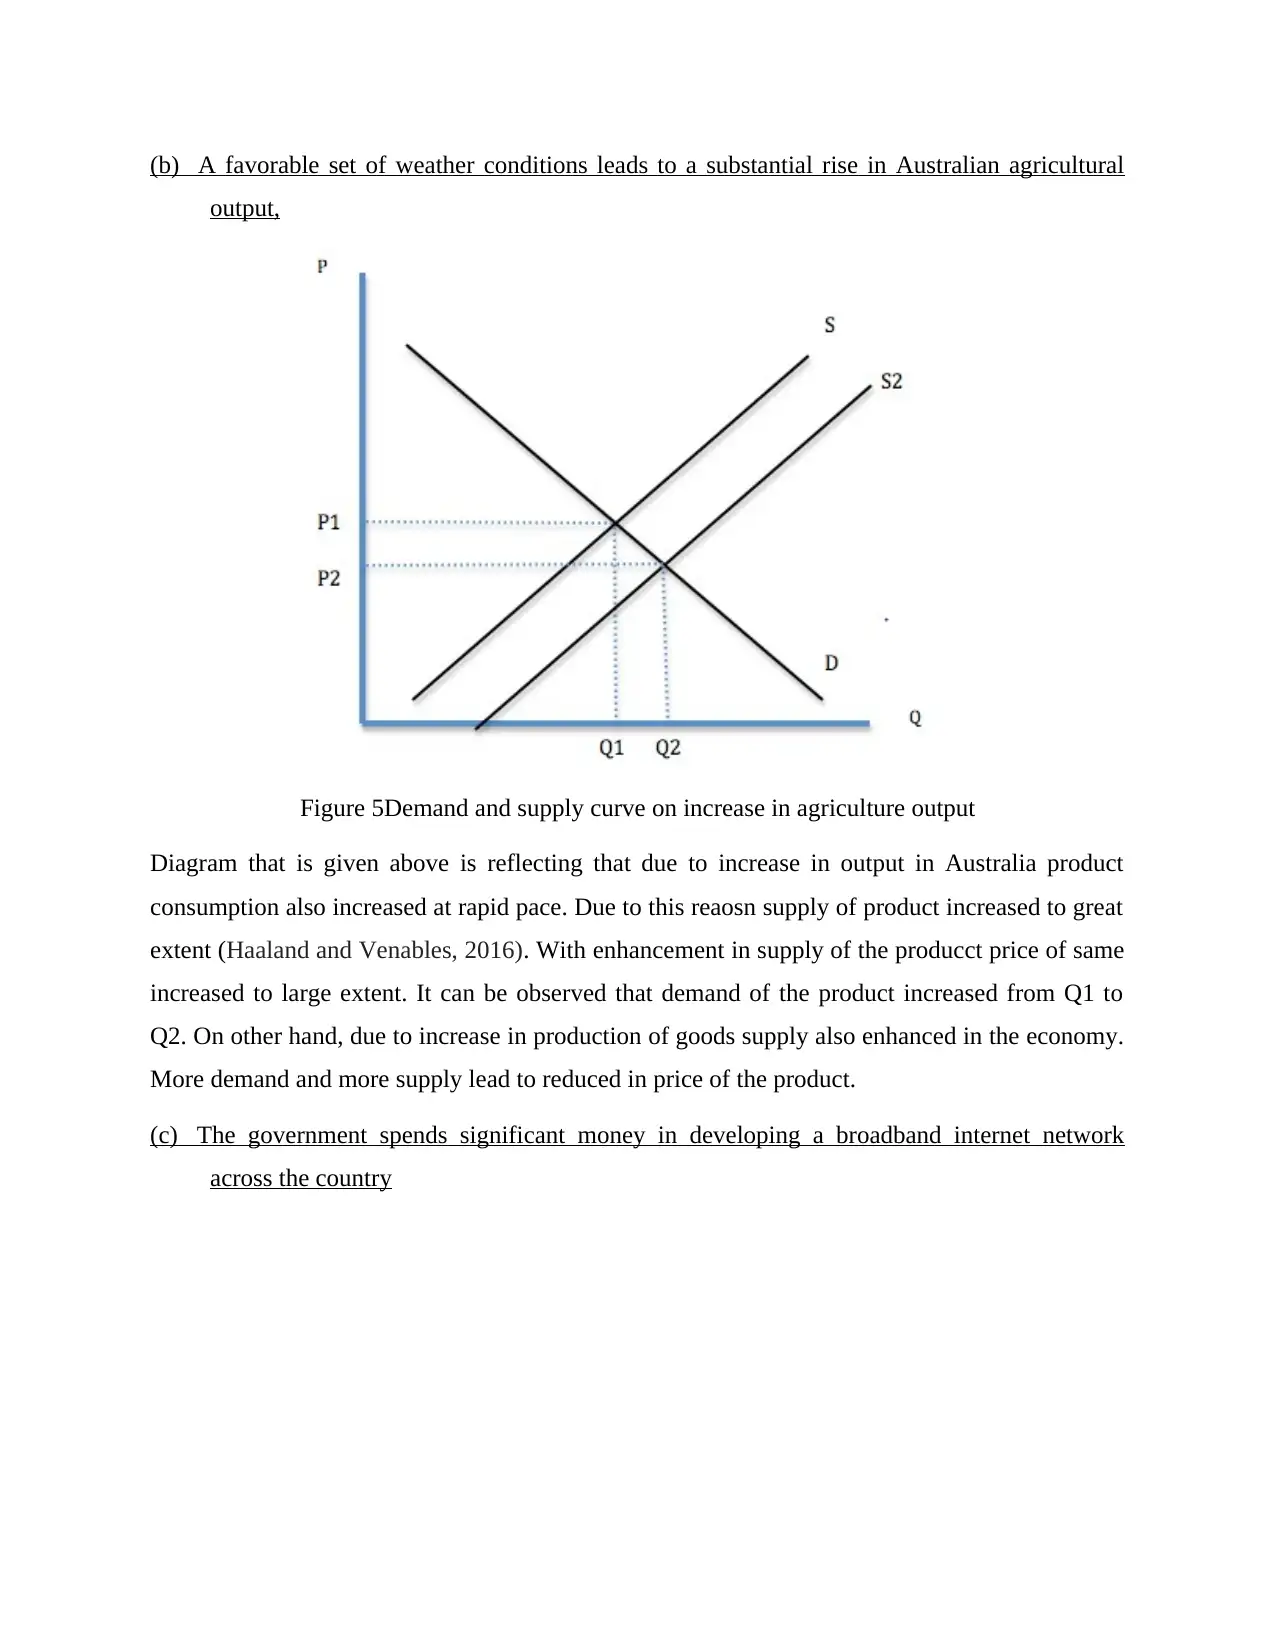
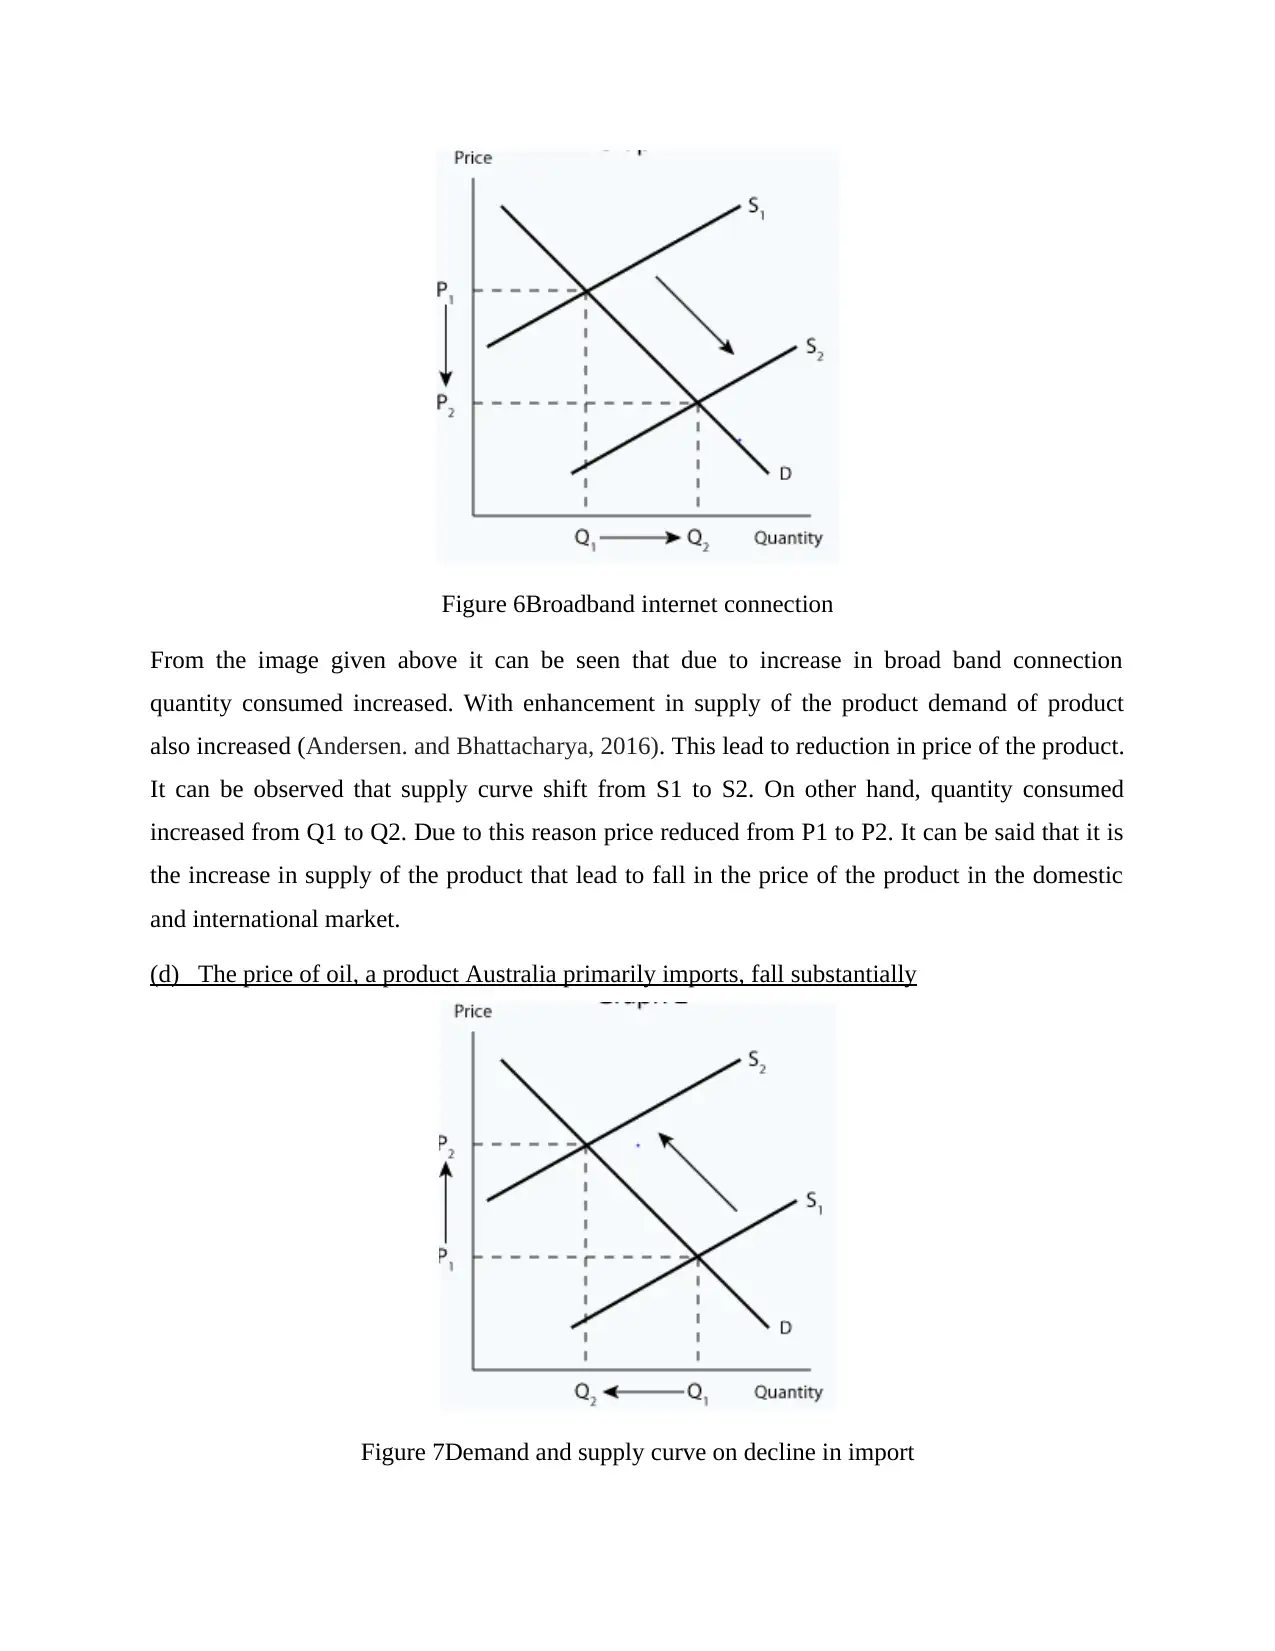
This report analyzes Australia's economic performance from 2005 to 2015, focusing on inflation rates, weekly earnings, and the impact of various economic factors. It examines the relationship between consumer price index (CPI) inflation and average weekly earnings, noting a decline in both. The report then uses demand and supply curves to illustrate the effects of changes in iron ore prices (a major export), agricultural output, government investment in broadband infrastructure, and oil import prices. The analysis reveals that fluctuations in supply and demand significantly impact prices and overall economic growth. The conclusion highlights the challenges faced by the Australian economy during this period, emphasizing the need for strategies to improve economic growth and stability.

AUSTRALIA BUREAU OF
STATISTICS
STATISTICS
Secure Best Marks with AI Grader
Need help grading? Try our AI Grader for instant feedback on your assignments.

TABLE OF CONTENTS
INTRODUCTION...........................................................................................................................3
Question 1........................................................................................................................................3
Consumer price index and weekly income rate from 2005 to 2015............................................3
Question 2........................................................................................................................................6
(a) The price of iron ore, a major export product, increases substantially.................................6
(b) A favorable set of weather conditions leads to a substantial rise in Australian agricultural
output,..........................................................................................................................................7
(c) The government spends significant money in developing a broadband internet network
across the country........................................................................................................................7
(d) The price of oil, a product Australia primarily imports, fall substantially...........................8
CONCLUSION................................................................................................................................9
REFERENCES..............................................................................................................................10
Figure 1Weekly earning and inflation rate charting........................................................................3
Figure 2Australia GDP....................................................................................................................4
Figure 3Australia GDP....................................................................................................................5
Figure 4Demand and supply curve on the export of iron ore..........................................................6
Figure 5Demand and supply curve on increase in agriculture output.............................................7
Figure 6Broadband internet connection...........................................................................................8
Figure 7Demand and supply curve on decline in import.................................................................8
Table 1Inflation and weekly earning data.......................................................................................3

INTRODUCTION
Economies is the one of the domain that heavily affect the nation. In the current report,
inflation rate and weekly earnings data is analyzed. Reasons behind trends are identified. In
second part of the report, demand and supply curve are prepared and interpretation are made. In
this way, conclusion is prepared in the report.
Question 1
Consumer price index and weekly income rate from 2005 to 2015
Table 1Inflation and weekly earning data
Year
CPI inflation
rate
Average weekly
earnings
Dec-2005 3% 2%
Dec-2006 3% 2%
Dec-2007 4% 2%
Dec-2008 2% 1%
Dec-2009 3% 1%
Dec-2010 3% 2%
Dec-2011 2% 1%
Dec-2012 3% 1%
Dec-2013 2% 1%
Dec-2014 2% 1%
Figure 1Weekly earning and inflation rate charting

On analysis of charts it can be observed that consumer price index inflation rate declined
from 3% to 2%. Along with this, average weekly earnings rate also reduced from 2% to 1%.
Results are reflecting that inflation rate and earning rate both remain in the specific range.
However, inflation rate declined at slow pace from 3% to 2%. It can be observed that inflation
rate keeps on fluctuating consistently and sometimes it was 3%, 4% and 2%. On other hand, in
case of weekly earning rate reduction from 2% to 1% is observed. These facts reflects that wage
level instead of increased decreases in last couple of years. Due to this reason demand for the
products reduced sharply. Due to less demand in the economy less consumption happened and
due to this reason instead of elevation price of products declined sharply in the market. It can be
said that economy of Australia face huge problem (Australia average weekly rate, 2017). Due to
uncertain economic conditions economy was in trouble and due to this reason weekly wages
grew at slow pace. Consequently, people purchasing power declined sharply. There may be
number of reasons due to which such kind of condition comes in existence. Australia is one of
the developed economy and due to this reason it is highly integrated to the globe. It is the
integration and globalization of the business due to which turmoil in the global economy have
direct impact on the Australia. This heavily affect its economy.
Figure 2Australia GDP
Secure Best Marks with AI Grader
Need help grading? Try our AI Grader for instant feedback on your assignments.

Figure 3Australia GDP
Interpretation
Charts that are given above are reflecting that from 2005 to 2015 Australia GDP grow at
small rate. In most of years after 2008 either it remain negative or increased upto 1%. Thus, it
can be said that Australia economy struggle continuously to enhance its growth rate. Moreover,
same rate declined sharply which reflects that during the period of 2005 to 2015 gross production
almost remain same. Even same declined in couple of years. This reflects that firm that are in
Australia consistently produce less output and due to this reason less sales made by the firms in
their business. Hence, they were unable to give big or moderate hike to the employees on wages.
Due to this reason saving rate increased and consumption reduced. This lead to decline in
inflation rate in the Australia.

Question 2
(a) The price of iron ore, a major export product, increases substantially
Figure 4Demand and supply curve on the export of iron ore
Interpretation
It can be seen from the diagram that price of the iron ore increased from P1 to P2. Due to
this reason demand of the product reduced from Q1 to Q2. On other hand, supply reduced from
the S1 to S2. This diagram reflects that when supply of product reduced in the market its price
increased and units consumed reduced substantially. It can be said that hike in price heavily
affects the nation economy.

(b) A favorable set of weather conditions leads to a substantial rise in Australian agricultural
output,
Figure 5Demand and supply curve on increase in agriculture output
Diagram that is given above is reflecting that due to increase in output in Australia product
consumption also increased at rapid pace. Due to this reaosn supply of product increased to great
extent (Haaland and Venables, 2016). With enhancement in supply of the producct price of same
increased to large extent. It can be observed that demand of the product increased from Q1 to
Q2. On other hand, due to increase in production of goods supply also enhanced in the economy.
More demand and more supply lead to reduced in price of the product.
(c) The government spends significant money in developing a broadband internet network
across the country
Paraphrase This Document
Need a fresh take? Get an instant paraphrase of this document with our AI Paraphraser

Figure 6Broadband internet connection
From the image given above it can be seen that due to increase in broad band connection
quantity consumed increased. With enhancement in supply of the product demand of product
also increased (Andersen. and Bhattacharya, 2016). This lead to reduction in price of the product.
It can be observed that supply curve shift from S1 to S2. On other hand, quantity consumed
increased from Q1 to Q2. Due to this reason price reduced from P1 to P2. It can be said that it is
the increase in supply of the product that lead to fall in the price of the product in the domestic
and international market.
(d) The price of oil, a product Australia primarily imports, fall substantially
Figure 7Demand and supply curve on decline in import

From the chart it can be observed that due to decline in import supply of the product reduced
substantially. Due to less supply consumption of oil reduced in the economy. Due to less supply
price of product increase from P1 to P2. It can be said that due to decline in import supply curve
shift from S1 to S2 and quantity consumed reduced from Q1 to Q2. Thus, due to decline in
import price increased.
CONCLUSION
On the basis of above discussion it is concluded that Australia economy is in big problem
as its economic growth rate was low for past years and currently also same reduced at same rate.
Due to this reason weekly income growth rate reduced to some extent. It can be said that there is
need to take strong steps to bring economy on track. With reduction in supply price increased or
vice versa. In case of demand this rule become inverse. Thus, it can be said that demand and
supply heavily affect economy.

REFERENCES
Books and conclusion
Andersen, T.M. and Bhattacharya, J., (2016). The Intergenerational Welfare State and the Rise
and Fall of Pay‐as‐you‐go Pensions. The Economic Journal.
Haaland, J. I. and Venables, A. J., (2016). Optimal trade policy with monopolistic competition
and heterogeneous firms. Journal of International Economics. 102. pp.85-95.
Online
Australia average weekly rate, (2017). [Online]. Available through :<
http://www.tradingeconomics.com/australia/wages>. [Accessed on 15th May 2017].
1 out of 10
Related Documents

Your All-in-One AI-Powered Toolkit for Academic Success.
+13062052269
info@desklib.com
Available 24*7 on WhatsApp / Email
Unlock your academic potential
© 2024 | Zucol Services PVT LTD | All rights reserved.