FNSINC601 S1 2018: Determining Australia's Economic Cycle Stage
VerifiedAdded on 2023/05/31
|14
|2485
|239
Report
AI Summary
This report assesses the current stage of the economic cycle in Australia, referencing macroeconomic factors such as GDP growth, unemployment trends, inflation rates, consumer and business confidence, and interest rate trends. It utilizes data from the Australian Bureau of Statistics (ABS), Reserve Bank of Australia (RBA), and other sources to determine whether the Australian economy is in a phase of expansion, peak, contraction, or trough. The analysis incorporates components of aggregate demand and the RBA’s current policy stance to provide a comprehensive overview of the Australian economic climate and its implications for investment and business prospects, concluding that the Australian economy is in a recovery phase, moving towards expansion.
Running head: ECONOMICS
Economics
Name of the Student
Nam of the University
Author’s Note
Economics
Name of the Student
Nam of the University
Author’s Note
Paraphrase This Document
Need a fresh take? Get an instant paraphrase of this document with our AI Paraphraser
1ECONOMICS
Table of Contents
Introduction......................................................................................................................................1
Stage of economic cycle..................................................................................................................2
GDP growth of the Australian economy.........................................................................................3
Unemployment trends in the Australian economy..........................................................................5
Inflation trends in Australian...........................................................................................................6
Consumer and business confidence.................................................................................................7
Interest rate trends............................................................................................................................9
Economic cycle phase in Australia is at present............................................................................10
Conclusion.....................................................................................................................................10
References......................................................................................................................................11
2ECONOMICS
Introduction
The present essay intends to analyze on which stage of economic cycle do the Australian
economy is at present. The economic cycle relates to the economic fluctuation in trade,
production and other economic activities between the periods of contraction and recession. It is
also refereed to as business cycle, which has four phases such as- expansion, peak, contraction
and trough. Several macroeconomic factors including- GDP, unemployment level, rate of
interest, inflation rate, consumer and business confidence helps to determine the present stage of
economic cycle in an economy. This study focuses on these macroeconomic factors for
determining the stage of economic cycle at which the Australian economy exists. This study will
help to provide an overview on how economic climate impact the prospects of a company.
Overall, this essay will highlight how the investors make investment for purchasing enterprises
technology and other capital products.
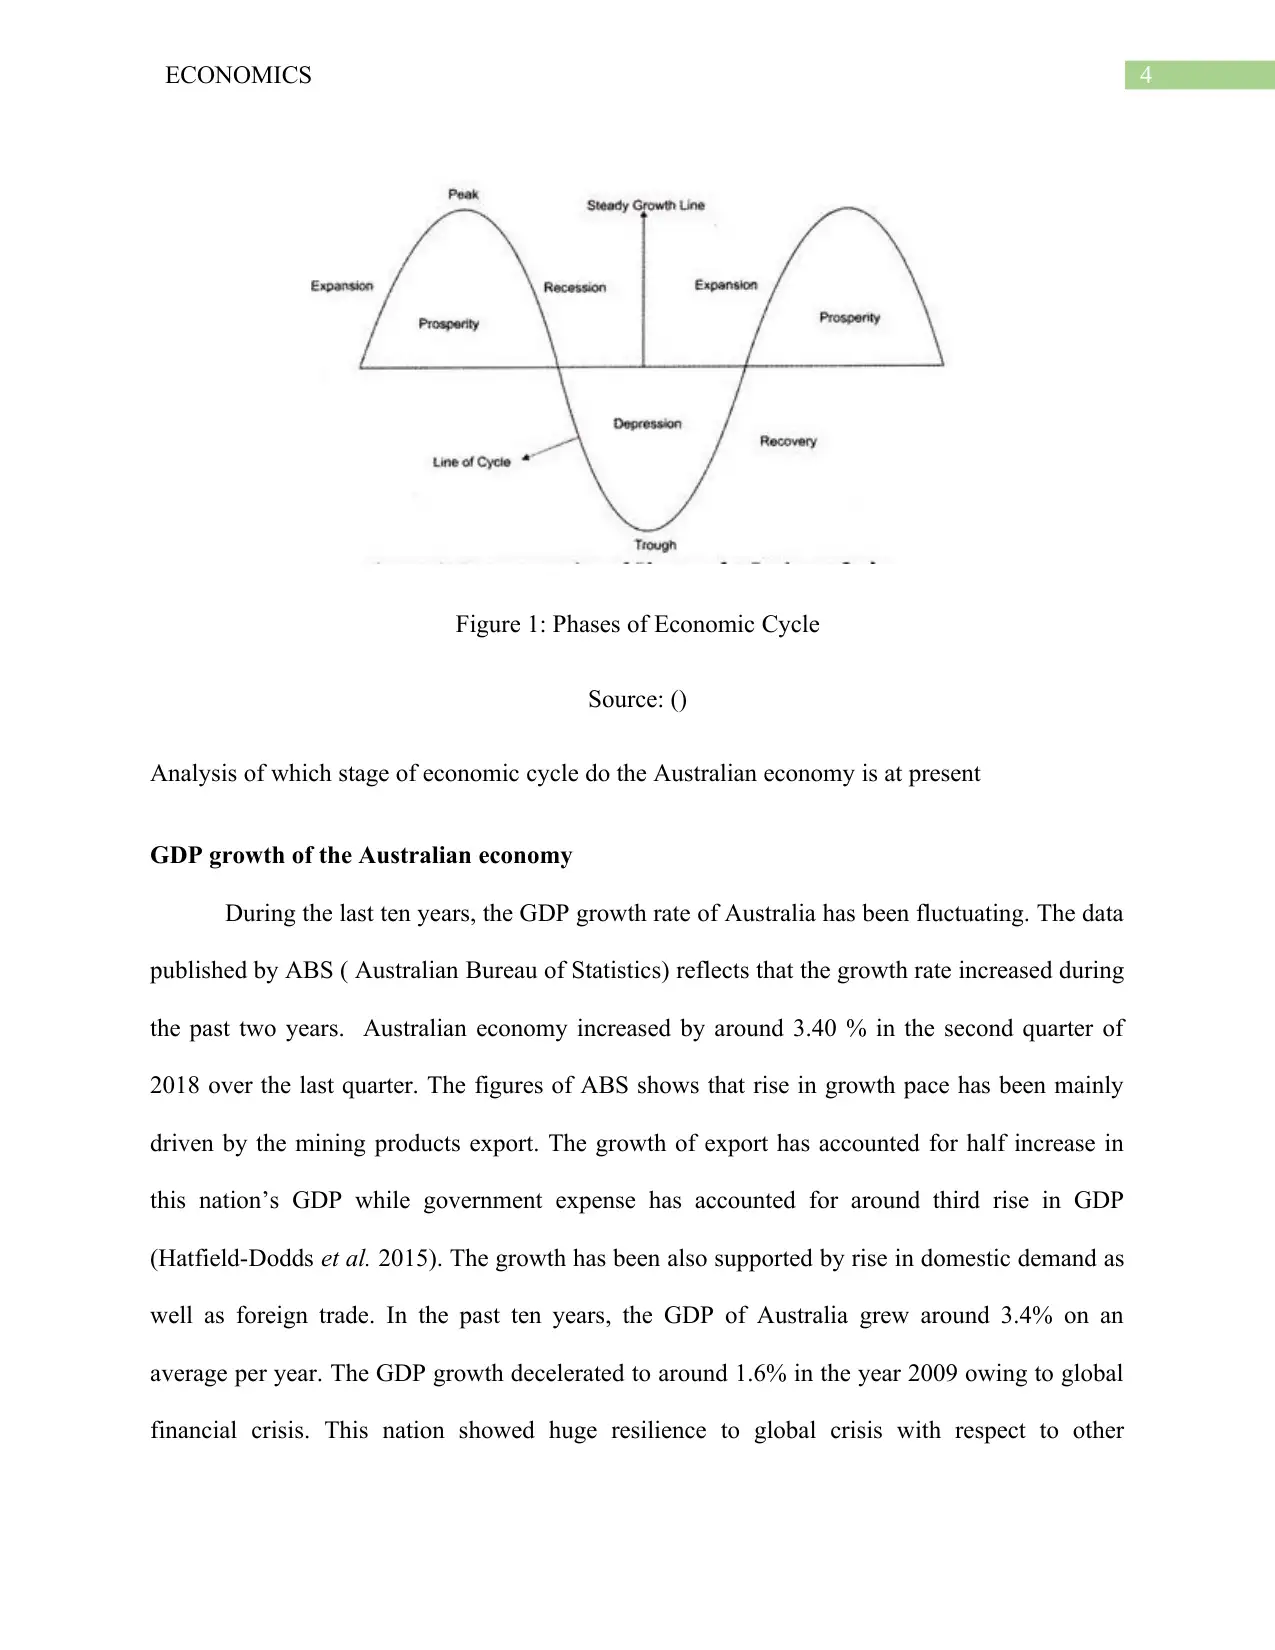
Stage of economic cycle
There are four stages of economic cycles such as- expansion, contraction, peak and
trough. All nations across the globe experience ups and downs in growth of jobs, output,
consumers spending and income. The economic cycle mainly begins from trough, passes
through recovery phase, followed by expansion and then reaches peak. After reaching peak
point, there comes the declining stage of recession. In this way the economic cycle continues
with ups and downs (Taussig 2013).
Expansion- In this stage, there is rise in different factors that includes- employment, wages,
employment, output and economic growth. Besides this, price of certain factors of production as
well as output enhances simultaneously. In this stage, the debtors are in better financial condition
for repaying their debts and thus creditors lend fund at high interest rate. Moreover, there is also
Introduction
The present essay intends to analyze on which stage of economic cycle do the Australian
economy is at present. The economic cycle relates to the economic fluctuation in trade,
production and other economic activities between the periods of contraction and recession. It is
also refereed to as business cycle, which has four phases such as- expansion, peak, contraction
and trough. Several macroeconomic factors including- GDP, unemployment level, rate of
interest, inflation rate, consumer and business confidence helps to determine the present stage of
economic cycle in an economy. This study focuses on these macroeconomic factors for
determining the stage of economic cycle at which the Australian economy exists. This study will
help to provide an overview on how economic climate impact the prospects of a company.
Overall, this essay will highlight how the investors make investment for purchasing enterprises
technology and other capital products.
Stage of economic cycle
There are four stages of economic cycles such as- expansion, contraction, peak and
trough. All nations across the globe experience ups and downs in growth of jobs, output,
consumers spending and income. The economic cycle mainly begins from trough, passes
through recovery phase, followed by expansion and then reaches peak. After reaching peak
point, there comes the declining stage of recession. In this way the economic cycle continues
with ups and downs (Taussig 2013).
Expansion- In this stage, there is rise in different factors that includes- employment, wages,
employment, output and economic growth. Besides this, price of certain factors of production as
well as output enhances simultaneously. In this stage, the debtors are in better financial condition
for repaying their debts and thus creditors lend fund at high interest rate. Moreover, there is also
⊘ This is a preview!⊘
Do you want full access?
Subscribe today to unlock all pages.
Trusted by 1+ million students worldwide
3ECONOMICS
rise in investment opportunities and thus some funds of an enterprise are used for different
investment purposes. This phase continues in an economy until economic conditions becomes
favorable.
Peak- Growth in expansion phase slows down and afterwards reach to peak stage. This is highest
point in economic cycle when an economy is manufacturing at maximum output or above full
employment. In this stage, the economic factors including production, employment, sales
becomes high. In this stage, there is gradual decline in demand for goods owing to rise in input
prices.
Recession- After the peak stage, there occurs gradual decline in demand for different goods
owing to rise in input prices. When decline in demand for goods becomes high, the recessionary
stage occurs. In this phase, all economic factors including prices, investment begins to fall. The
producers becomes unaware of decline in product demand and thus they continue to manufacture
products. In this situation, supply of goods exceeds that of demand for goods (Sloman, Norris
and Garrett 2013).
Trough- During this stage, economic activities of the nation decrease below normal level. In this
stage, growth rate of specific economy becomes negative. Moreover, in this stage, there occurs
huge decrease in national income as well as expenditure. Besides this, the economic output of the
nation also becomes low as well as unemployment becomes high.
Paraphrase This Document
Need a fresh take? Get an instant paraphrase of this document with our AI Paraphraser
4ECONOMICS
Figure 1: Phases of Economic Cycle
Source: ()
Analysis of which stage of economic cycle do the Australian economy is at present
GDP growth of the Australian economy
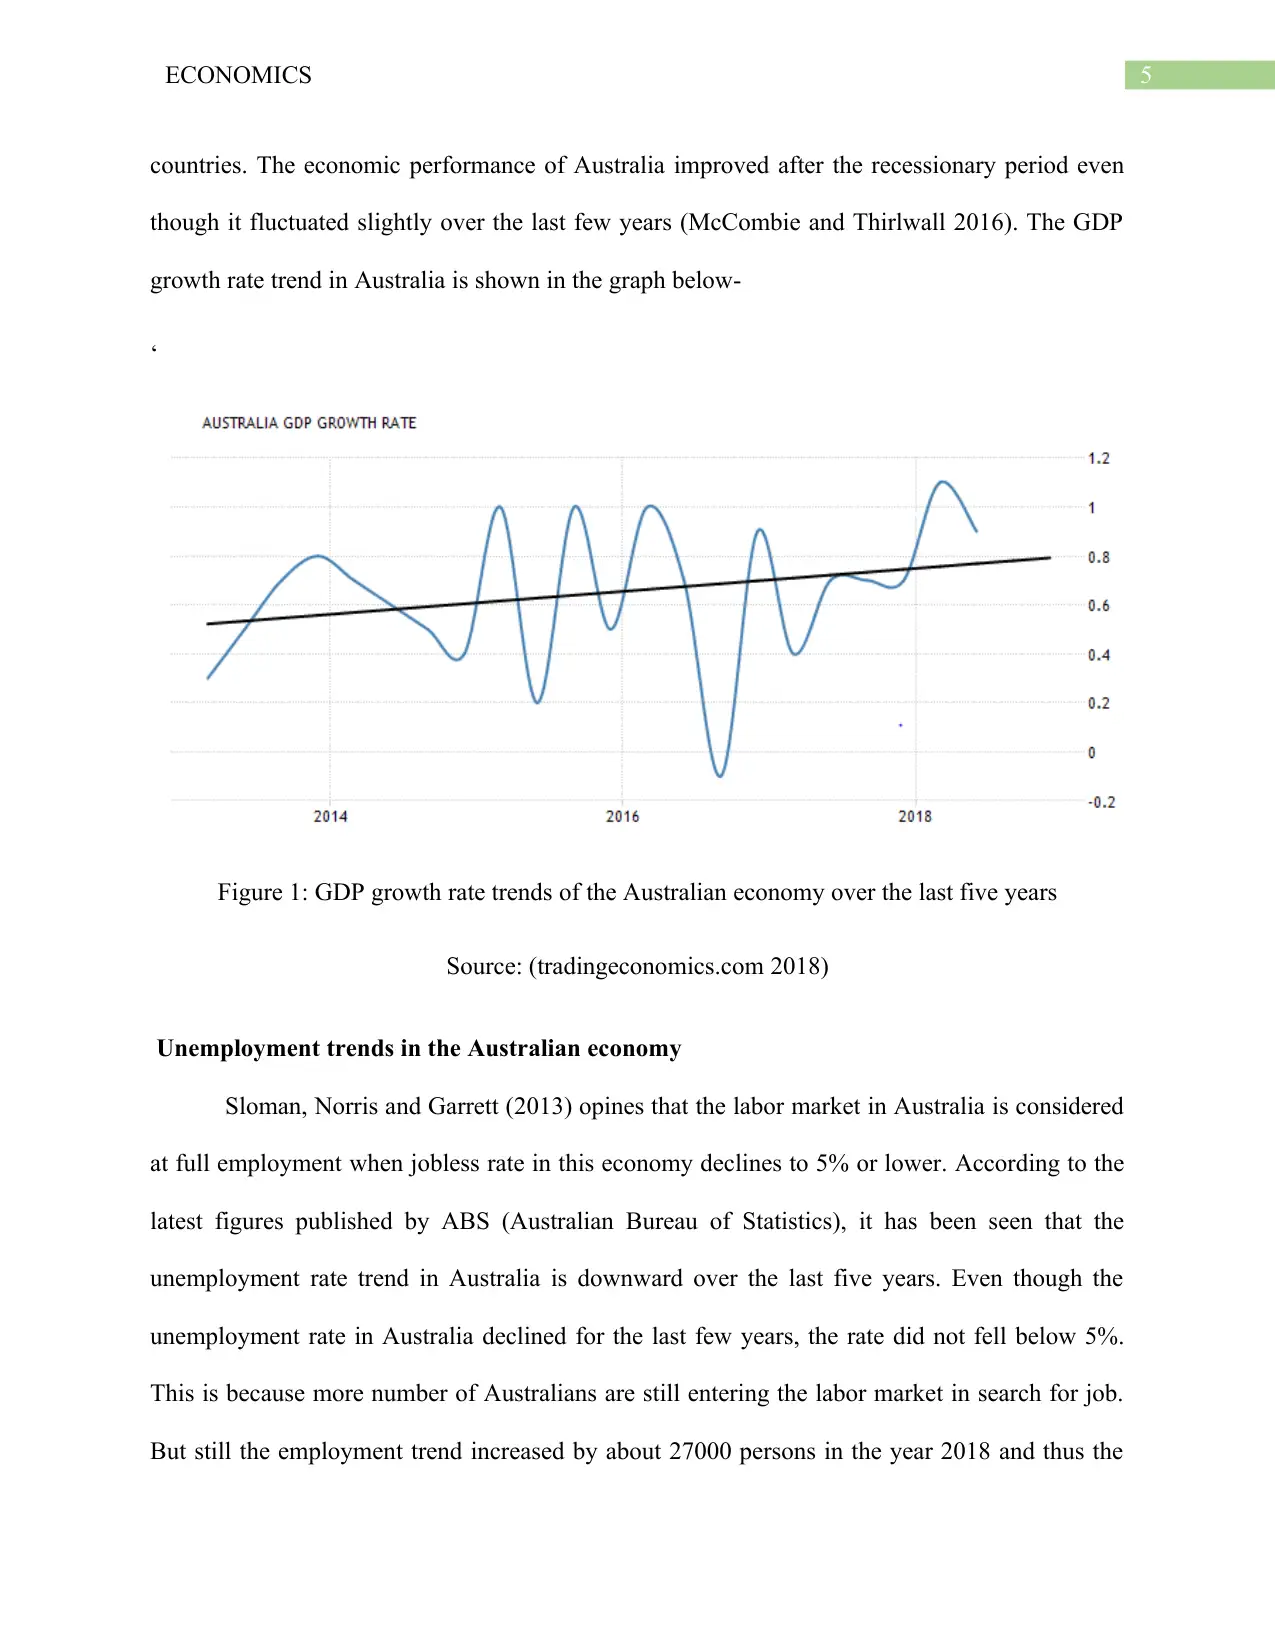
During the last ten years, the GDP growth rate of Australia has been fluctuating. The data
published by ABS ( Australian Bureau of Statistics) reflects that the growth rate increased during
the past two years. Australian economy increased by around 3.40 % in the second quarter of
2018 over the last quarter. The figures of ABS shows that rise in growth pace has been mainly
driven by the mining products export. The growth of export has accounted for half increase in
this nation’s GDP while government expense has accounted for around third rise in GDP
(Hatfield-Dodds et al. 2015). The growth has been also supported by rise in domestic demand as
well as foreign trade. In the past ten years, the GDP of Australia grew around 3.4% on an
average per year. The GDP growth decelerated to around 1.6% in the year 2009 owing to global
financial crisis. This nation showed huge resilience to global crisis with respect to other
Figure 1: Phases of Economic Cycle
Source: ()
Analysis of which stage of economic cycle do the Australian economy is at present
GDP growth of the Australian economy
During the last ten years, the GDP growth rate of Australia has been fluctuating. The data
published by ABS ( Australian Bureau of Statistics) reflects that the growth rate increased during
the past two years. Australian economy increased by around 3.40 % in the second quarter of
2018 over the last quarter. The figures of ABS shows that rise in growth pace has been mainly
driven by the mining products export. The growth of export has accounted for half increase in
this nation’s GDP while government expense has accounted for around third rise in GDP
(Hatfield-Dodds et al. 2015). The growth has been also supported by rise in domestic demand as
well as foreign trade. In the past ten years, the GDP of Australia grew around 3.4% on an
average per year. The GDP growth decelerated to around 1.6% in the year 2009 owing to global
financial crisis. This nation showed huge resilience to global crisis with respect to other
5ECONOMICS
countries. The economic performance of Australia improved after the recessionary period even
though it fluctuated slightly over the last few years (McCombie and Thirlwall 2016). The GDP
growth rate trend in Australia is shown in the graph below-
‘
Figure 1: GDP growth rate trends of the Australian economy over the last five years
Source: (tradingeconomics.com 2018)
Unemployment trends in the Australian economy
Sloman, Norris and Garrett (2013) opines that the labor market in Australia is considered
at full employment when jobless rate in this economy declines to 5% or lower. According to the
latest figures published by ABS (Australian Bureau of Statistics), it has been seen that the
unemployment rate trend in Australia is downward over the last five years. Even though the
unemployment rate in Australia declined for the last few years, the rate did not fell below 5%.
This is because more number of Australians are still entering the labor market in search for job.
But still the employment trend increased by about 27000 persons in the year 2018 and thus the
⊘ This is a preview!⊘
Do you want full access?
Subscribe today to unlock all pages.
Trusted by 1+ million students worldwide
6ECONOMICS
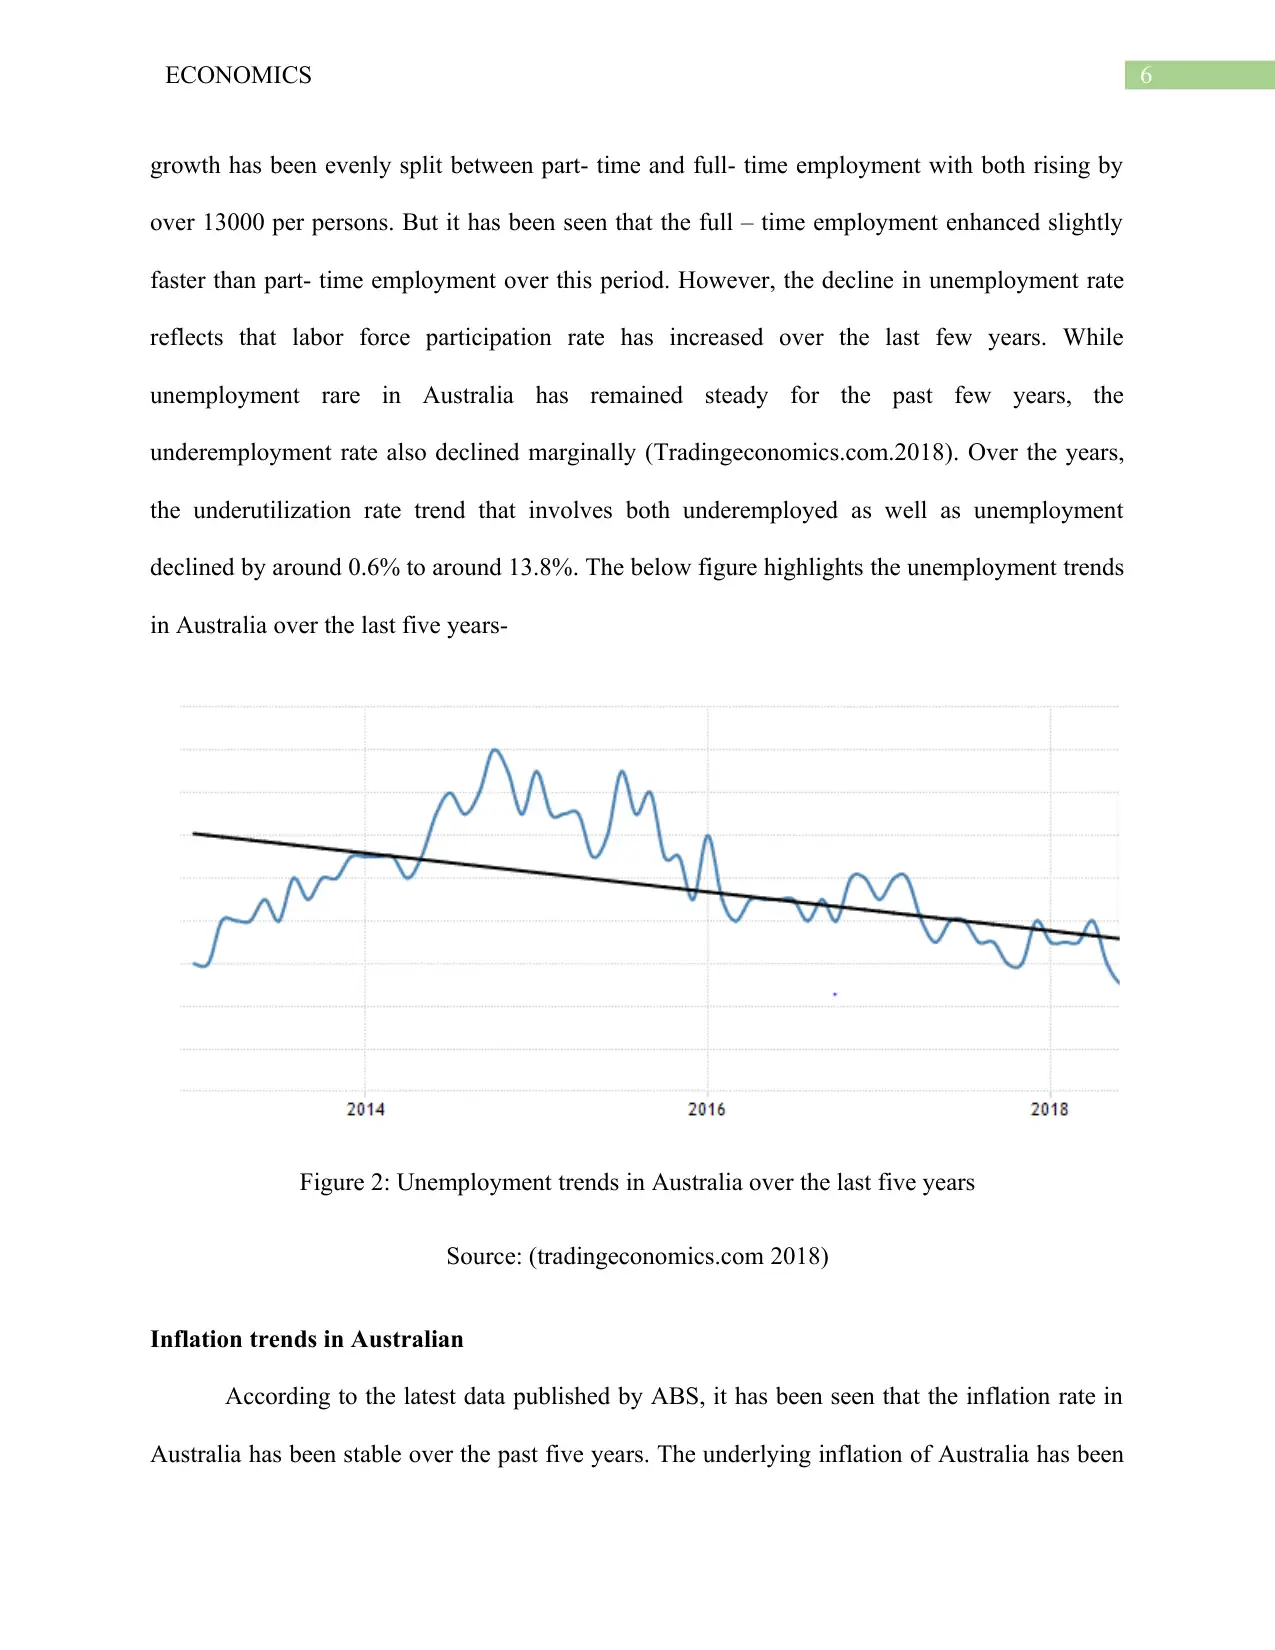
growth has been evenly split between part- time and full- time employment with both rising by
over 13000 per persons. But it has been seen that the full – time employment enhanced slightly
faster than part- time employment over this period. However, the decline in unemployment rate
reflects that labor force participation rate has increased over the last few years. While
unemployment rare in Australia has remained steady for the past few years, the
underemployment rate also declined marginally (Tradingeconomics.com.2018). Over the years,
the underutilization rate trend that involves both underemployed as well as unemployment
declined by around 0.6% to around 13.8%. The below figure highlights the unemployment trends
in Australia over the last five years-
Figure 2: Unemployment trends in Australia over the last five years
Source: (tradingeconomics.com 2018)
Inflation trends in Australian
According to the latest data published by ABS, it has been seen that the inflation rate in
Australia has been stable over the past five years. The underlying inflation of Australia has been
Paraphrase This Document
Need a fresh take? Get an instant paraphrase of this document with our AI Paraphraser
7ECONOMICS
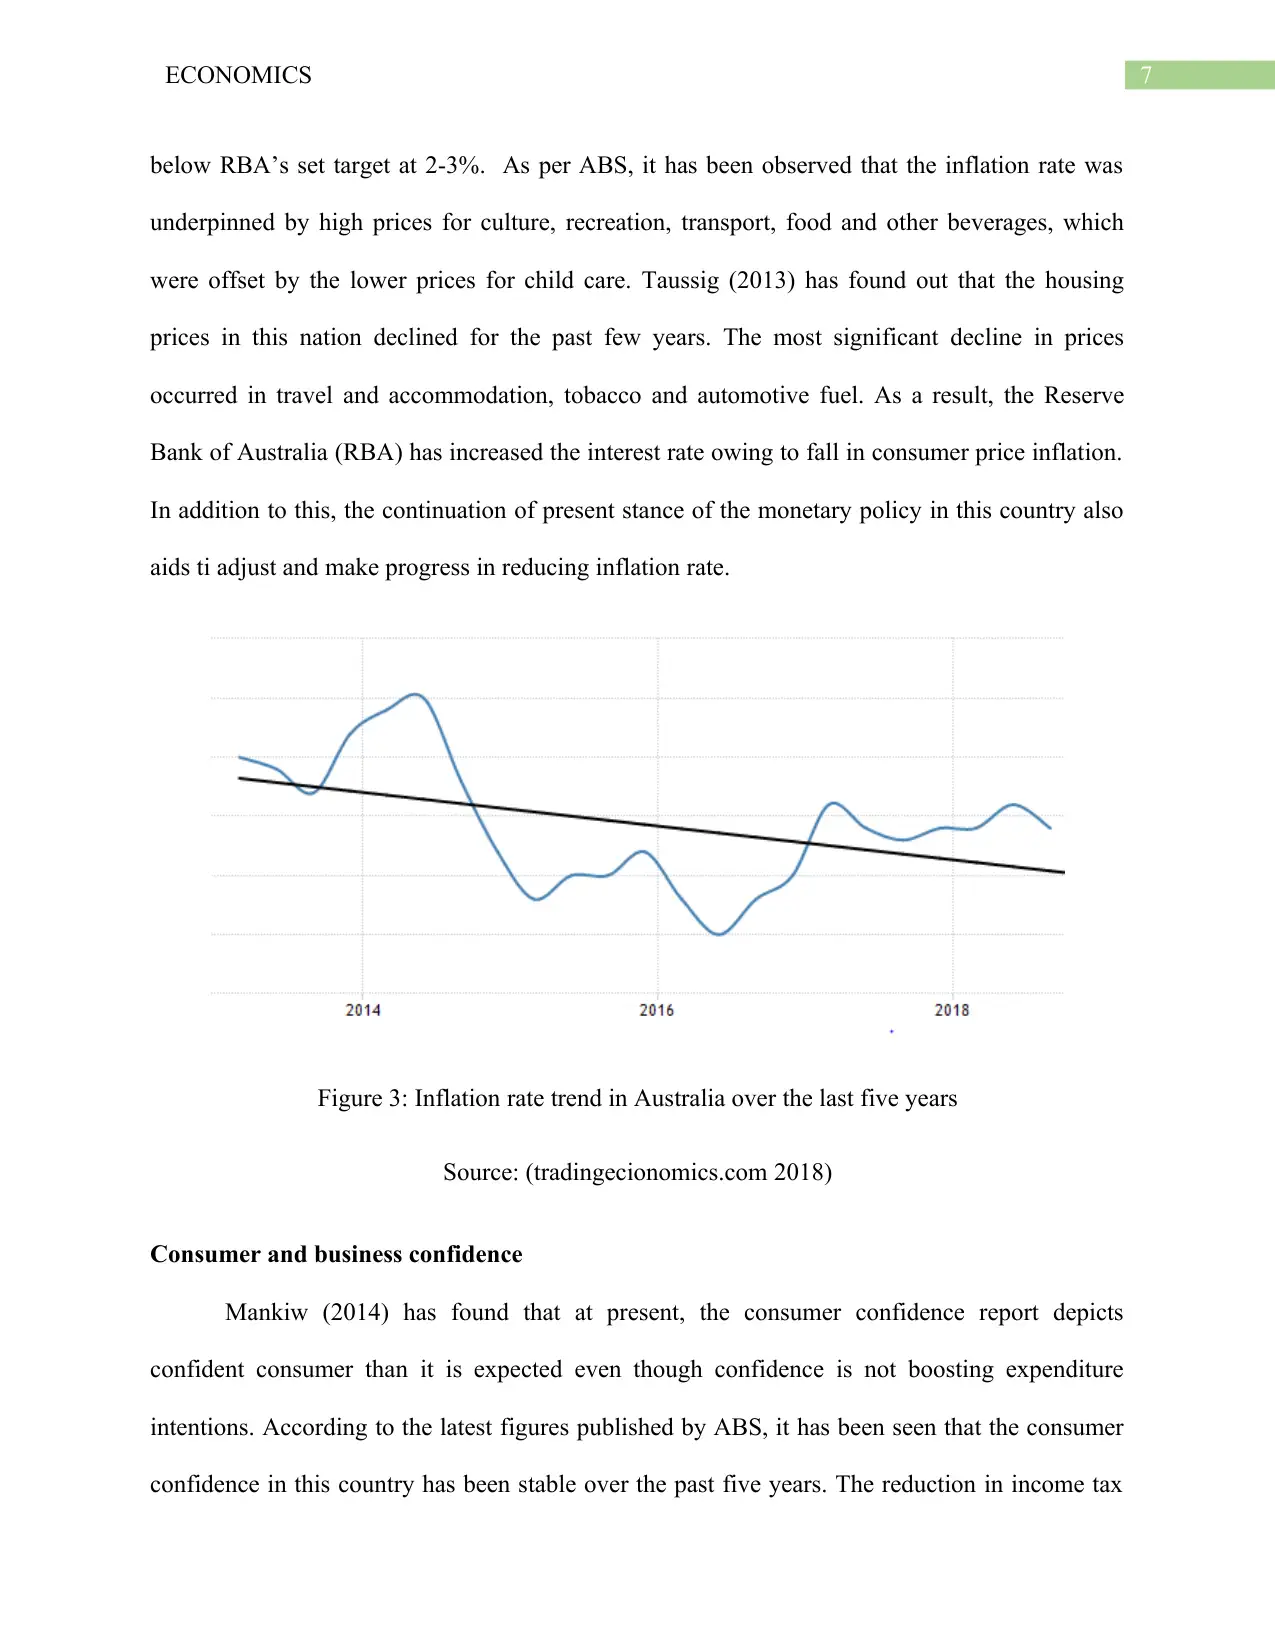
below RBA’s set target at 2-3%. As per ABS, it has been observed that the inflation rate was
underpinned by high prices for culture, recreation, transport, food and other beverages, which
were offset by the lower prices for child care. Taussig (2013) has found out that the housing
prices in this nation declined for the past few years. The most significant decline in prices
occurred in travel and accommodation, tobacco and automotive fuel. As a result, the Reserve
Bank of Australia (RBA) has increased the interest rate owing to fall in consumer price inflation.
In addition to this, the continuation of present stance of the monetary policy in this country also
aids ti adjust and make progress in reducing inflation rate.
Figure 3: Inflation rate trend in Australia over the last five years
Source: (tradingecionomics.com 2018)
Consumer and business confidence
Mankiw (2014) has found that at present, the consumer confidence report depicts
confident consumer than it is expected even though confidence is not boosting expenditure
intentions. According to the latest figures published by ABS, it has been seen that the consumer
confidence in this country has been stable over the past five years. The reduction in income tax
8ECONOMICS
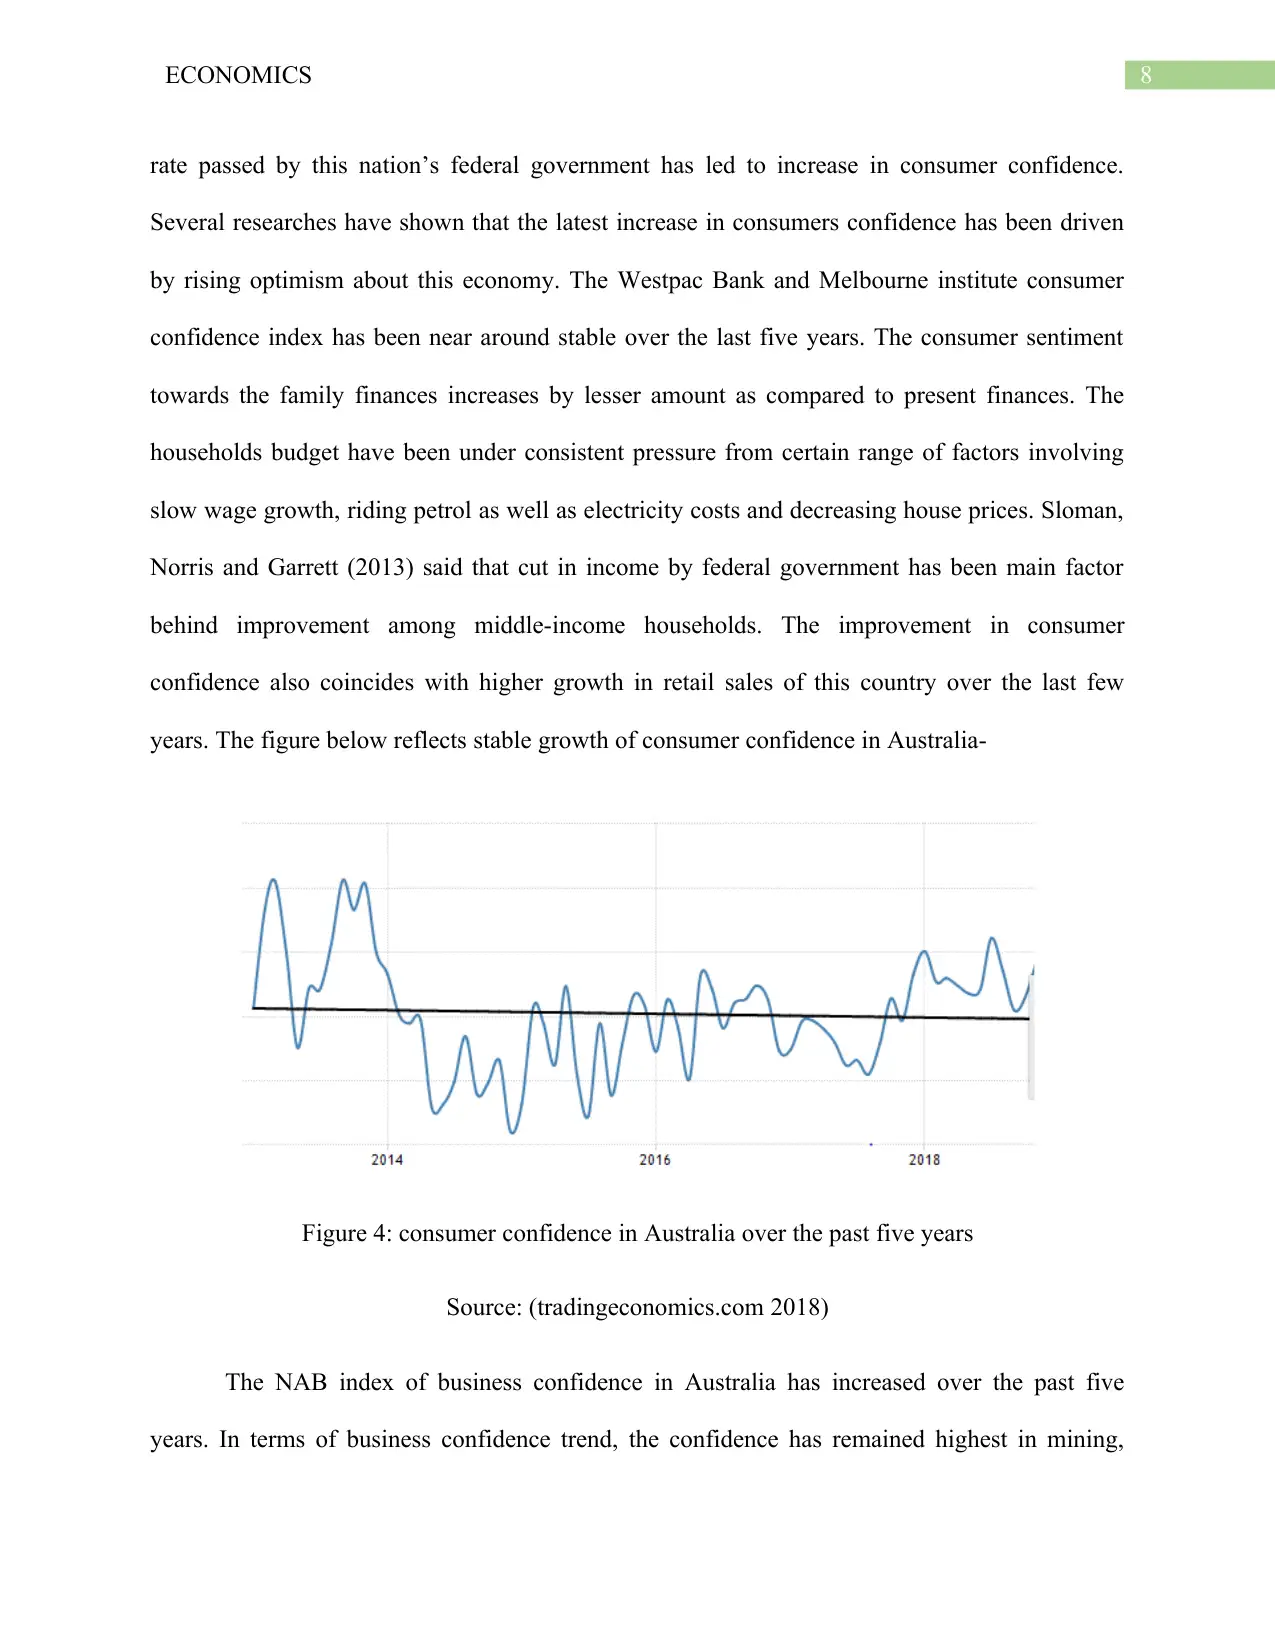
rate passed by this nation’s federal government has led to increase in consumer confidence.
Several researches have shown that the latest increase in consumers confidence has been driven
by rising optimism about this economy. The Westpac Bank and Melbourne institute consumer
confidence index has been near around stable over the last five years. The consumer sentiment
towards the family finances increases by lesser amount as compared to present finances. The
households budget have been under consistent pressure from certain range of factors involving
slow wage growth, riding petrol as well as electricity costs and decreasing house prices. Sloman,
Norris and Garrett (2013) said that cut in income by federal government has been main factor
behind improvement among middle-income households. The improvement in consumer
confidence also coincides with higher growth in retail sales of this country over the last few
years. The figure below reflects stable growth of consumer confidence in Australia-
Figure 4: consumer confidence in Australia over the past five years
Source: (tradingeconomics.com 2018)
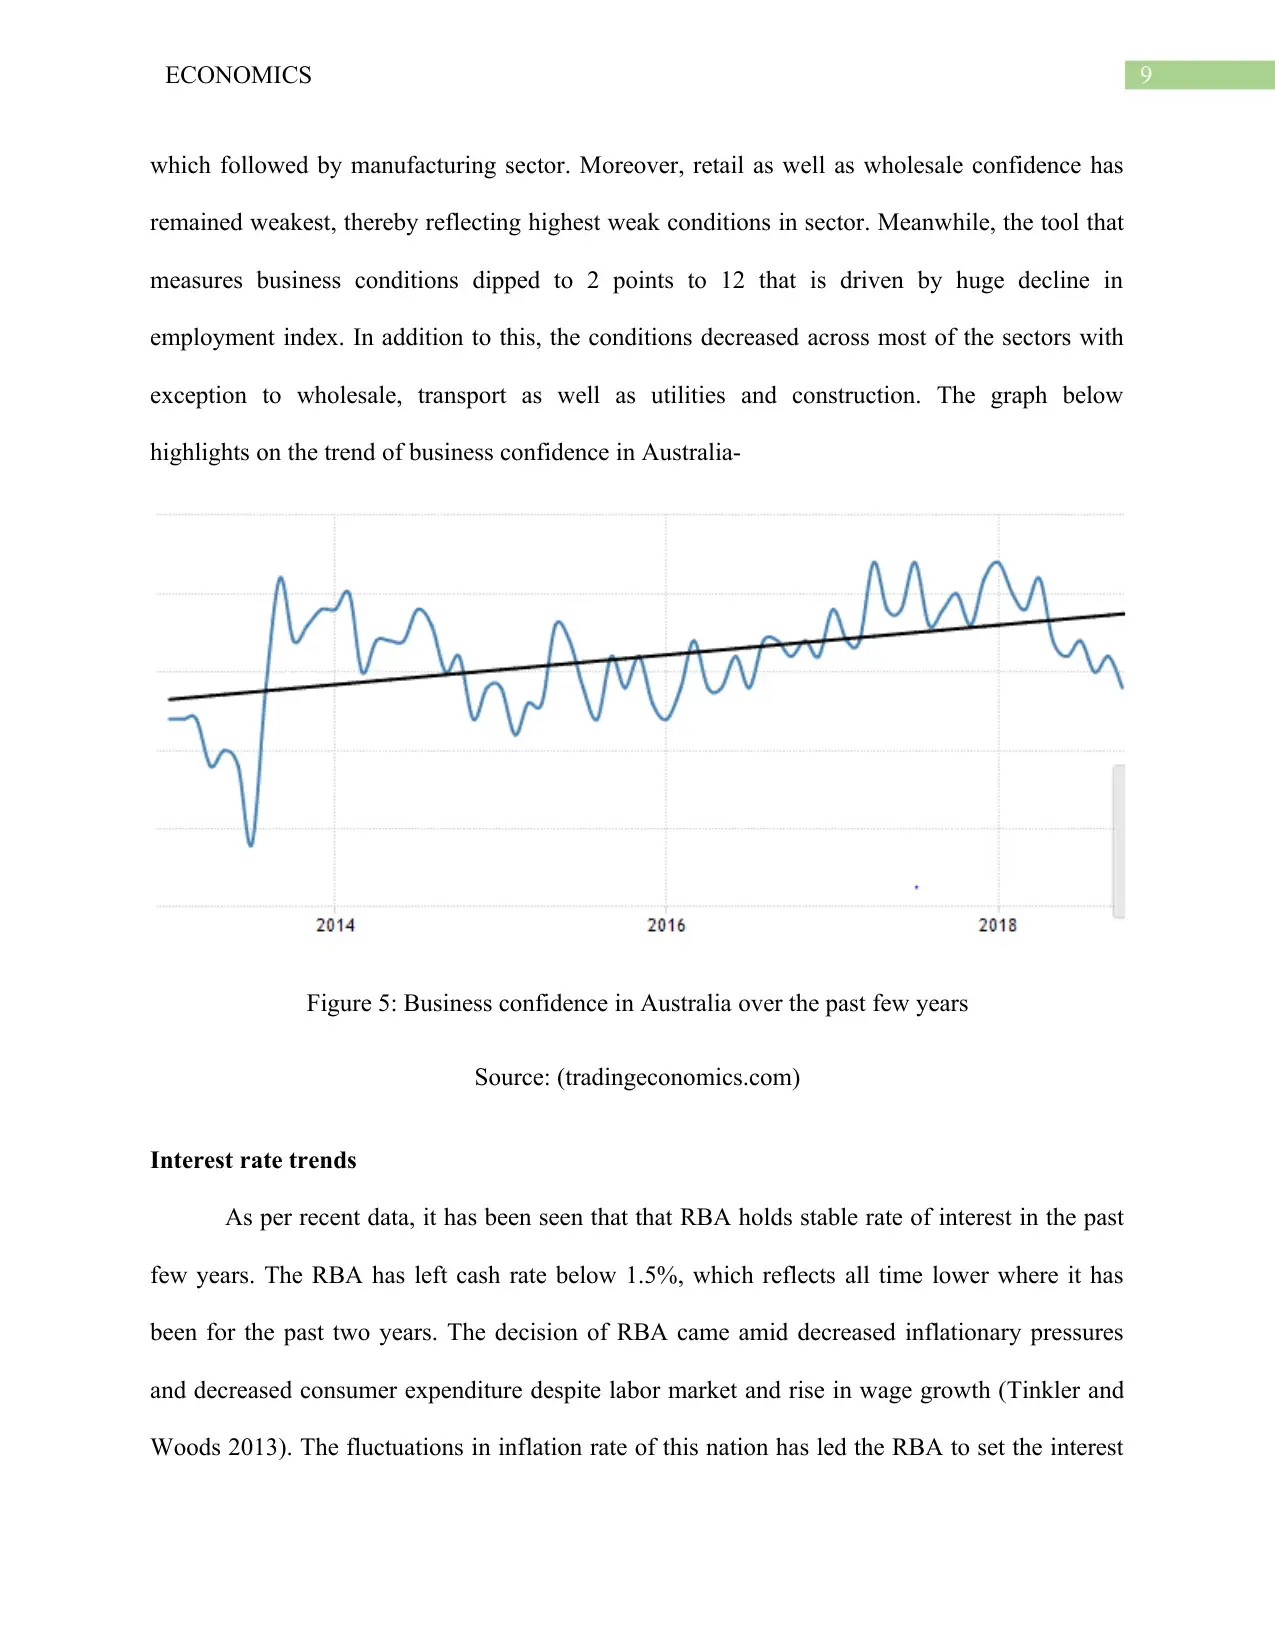
The NAB index of business confidence in Australia has increased over the past five
years. In terms of business confidence trend, the confidence has remained highest in mining,
rate passed by this nation’s federal government has led to increase in consumer confidence.
Several researches have shown that the latest increase in consumers confidence has been driven
by rising optimism about this economy. The Westpac Bank and Melbourne institute consumer
confidence index has been near around stable over the last five years. The consumer sentiment
towards the family finances increases by lesser amount as compared to present finances. The
households budget have been under consistent pressure from certain range of factors involving
slow wage growth, riding petrol as well as electricity costs and decreasing house prices. Sloman,
Norris and Garrett (2013) said that cut in income by federal government has been main factor
behind improvement among middle-income households. The improvement in consumer
confidence also coincides with higher growth in retail sales of this country over the last few
years. The figure below reflects stable growth of consumer confidence in Australia-
Figure 4: consumer confidence in Australia over the past five years
Source: (tradingeconomics.com 2018)
The NAB index of business confidence in Australia has increased over the past five
years. In terms of business confidence trend, the confidence has remained highest in mining,
⊘ This is a preview!⊘
Do you want full access?
Subscribe today to unlock all pages.
Trusted by 1+ million students worldwide
9ECONOMICS
which followed by manufacturing sector. Moreover, retail as well as wholesale confidence has
remained weakest, thereby reflecting highest weak conditions in sector. Meanwhile, the tool that
measures business conditions dipped to 2 points to 12 that is driven by huge decline in
employment index. In addition to this, the conditions decreased across most of the sectors with
exception to wholesale, transport as well as utilities and construction. The graph below
highlights on the trend of business confidence in Australia-
Figure 5: Business confidence in Australia over the past few years
Source: (tradingeconomics.com)
Interest rate trends
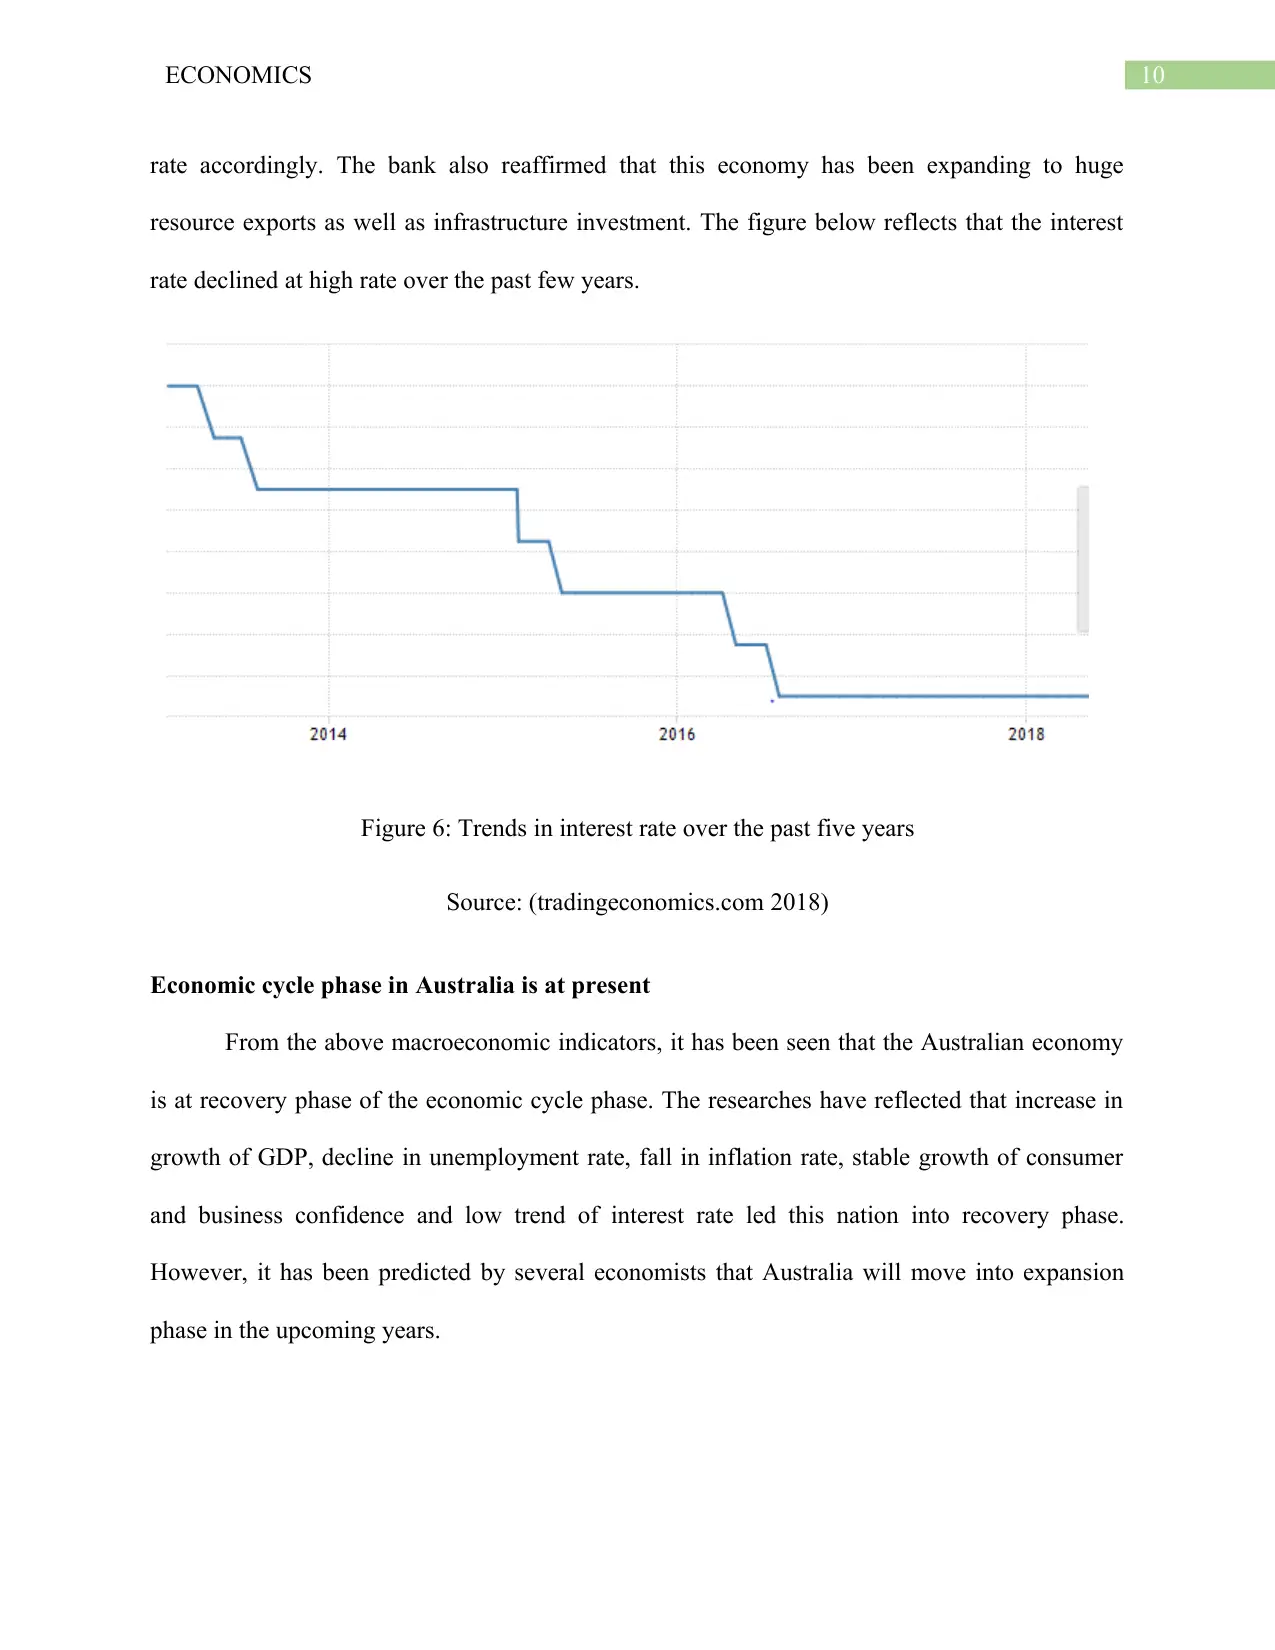
As per recent data, it has been seen that that RBA holds stable rate of interest in the past
few years. The RBA has left cash rate below 1.5%, which reflects all time lower where it has
been for the past two years. The decision of RBA came amid decreased inflationary pressures
and decreased consumer expenditure despite labor market and rise in wage growth (Tinkler and
Woods 2013). The fluctuations in inflation rate of this nation has led the RBA to set the interest
which followed by manufacturing sector. Moreover, retail as well as wholesale confidence has
remained weakest, thereby reflecting highest weak conditions in sector. Meanwhile, the tool that
measures business conditions dipped to 2 points to 12 that is driven by huge decline in
employment index. In addition to this, the conditions decreased across most of the sectors with
exception to wholesale, transport as well as utilities and construction. The graph below
highlights on the trend of business confidence in Australia-
Figure 5: Business confidence in Australia over the past few years
Source: (tradingeconomics.com)
Interest rate trends
As per recent data, it has been seen that that RBA holds stable rate of interest in the past
few years. The RBA has left cash rate below 1.5%, which reflects all time lower where it has
been for the past two years. The decision of RBA came amid decreased inflationary pressures
and decreased consumer expenditure despite labor market and rise in wage growth (Tinkler and
Woods 2013). The fluctuations in inflation rate of this nation has led the RBA to set the interest
Paraphrase This Document
Need a fresh take? Get an instant paraphrase of this document with our AI Paraphraser
10ECONOMICS
rate accordingly. The bank also reaffirmed that this economy has been expanding to huge
resource exports as well as infrastructure investment. The figure below reflects that the interest
rate declined at high rate over the past few years.
Figure 6: Trends in interest rate over the past five years
Source: (tradingeconomics.com 2018)
Economic cycle phase in Australia is at present
From the above macroeconomic indicators, it has been seen that the Australian economy
is at recovery phase of the economic cycle phase. The researches have reflected that increase in
growth of GDP, decline in unemployment rate, fall in inflation rate, stable growth of consumer
and business confidence and low trend of interest rate led this nation into recovery phase.
However, it has been predicted by several economists that Australia will move into expansion
phase in the upcoming years.
11ECONOMICS
Conclusion
From the above discussion, it can be conclusion that the Australian economy has
improved after the recessionary period (2008-2009). After this period, the economy again dipped
into low growth during the year 2016 but the growth trend again increased after 2016. At present,
the Australian economy has been in recovery phase and is moving towards expansion stage of
the economic cycle.
⊘ This is a preview!⊘
Do you want full access?
Subscribe today to unlock all pages.
Trusted by 1+ million students worldwide
1 out of 14
Related Documents


Your All-in-One AI-Powered Toolkit for Academic Success.
+13062052269
info@desklib.com
Available 24*7 on WhatsApp / Email
![[object Object]](/_next/static/media/star-bottom.7253800d.svg)
Unlock your academic potential
Copyright © 2020–2026 A2Z Services. All Rights Reserved. Developed and managed by ZUCOL.