Economic Principles & Decision Making: Australia's GDP Analysis
VerifiedAdded on 2023/04/06
|18
|3242
|366
Report
AI Summary
This report provides a critical evaluation of Australia's projected slow economic growth, focusing on the impact of a sluggish housing market and China's economic slowdown. It examines historical GDP trends, the share of various components in Australia's GDP (consumption, investment, government expenditure, and net export), and the significance of the housing market and its projected growth rate. Furthermore, it analyzes Australia's trade relationship with China, highlighting China's substantial share in Australia's exports and the potential consequences of China's economic downturn on Australia's export demand and overall economic growth. The report concludes that the slowdown in the domestic housing market and economic challenges in China contribute significantly to the projected below-average growth rate for Australia.
Running head: ECONOMIC PRINCIPLES AND DECISION MAKING
Economic Principles and Decision Making
Name of the Student
Name of the University
Student ID
Economic Principles and Decision Making
Name of the Student
Name of the University
Student ID
Paraphrase This Document
Need a fresh take? Get an instant paraphrase of this document with our AI Paraphraser
1ECONOMIC PRINCIPLES AND DECISION MAKING
Executive summary
The report critically evaluates projected slow economic growth less than 3 percent. Two crucial
factors discussed for slow economic growth of Australia are slow growth of housing market and
slow growth of China’s economy. The growth analysis of Australia has been done in a
systematic way. The report first discusses historical trend in economic growth of Australia.
There are several components of Australia’s GDP. The report finds share of each of the
components in GDP of Australia. Investment in housing market and associated growth of
housing play an important role in Australian economy. Below average growth rate of housing
leads to an overall decline in economic growth of Australia. The trade relation with Australia is a
significant contributor of Australia’s economic expansion. China accounts a considerably large
share in total Australia’s export. Slow growth in China means a relatively smaller demand for
Australia’s export resulting in a low growth of Australia. The finding suggest that slowdown of
domestic housing market and economic downturn in China leads to a below average projected
growth rate for Australia.
2ECONOMIC PRINCIPLES AND DECISION MAKING
Table of Contents
Introduction......................................................................................................................................3
Historical GDP growth....................................................................................................................4
Components of Australian GDP......................................................................................................5
Share of different components in GDP............................................................................................6
Consumption................................................................................................................................6
Investment....................................................................................................................................6
Government expenditure.............................................................................................................6
Net export....................................................................................................................................7
Housing market in Australia............................................................................................................7
Slowdown in China’s economy.......................................................................................................9
Australia’s export.........................................................................................................................9
Australia’s import......................................................................................................................10
China’s share in Australia’s export............................................................................................10
Conclusion.....................................................................................................................................13
References......................................................................................................................................15
⊘ This is a preview!⊘
Do you want full access?
Subscribe today to unlock all pages.
Trusted by 1+ million students worldwide
3ECONOMIC PRINCIPLES AND DECISION MAKING
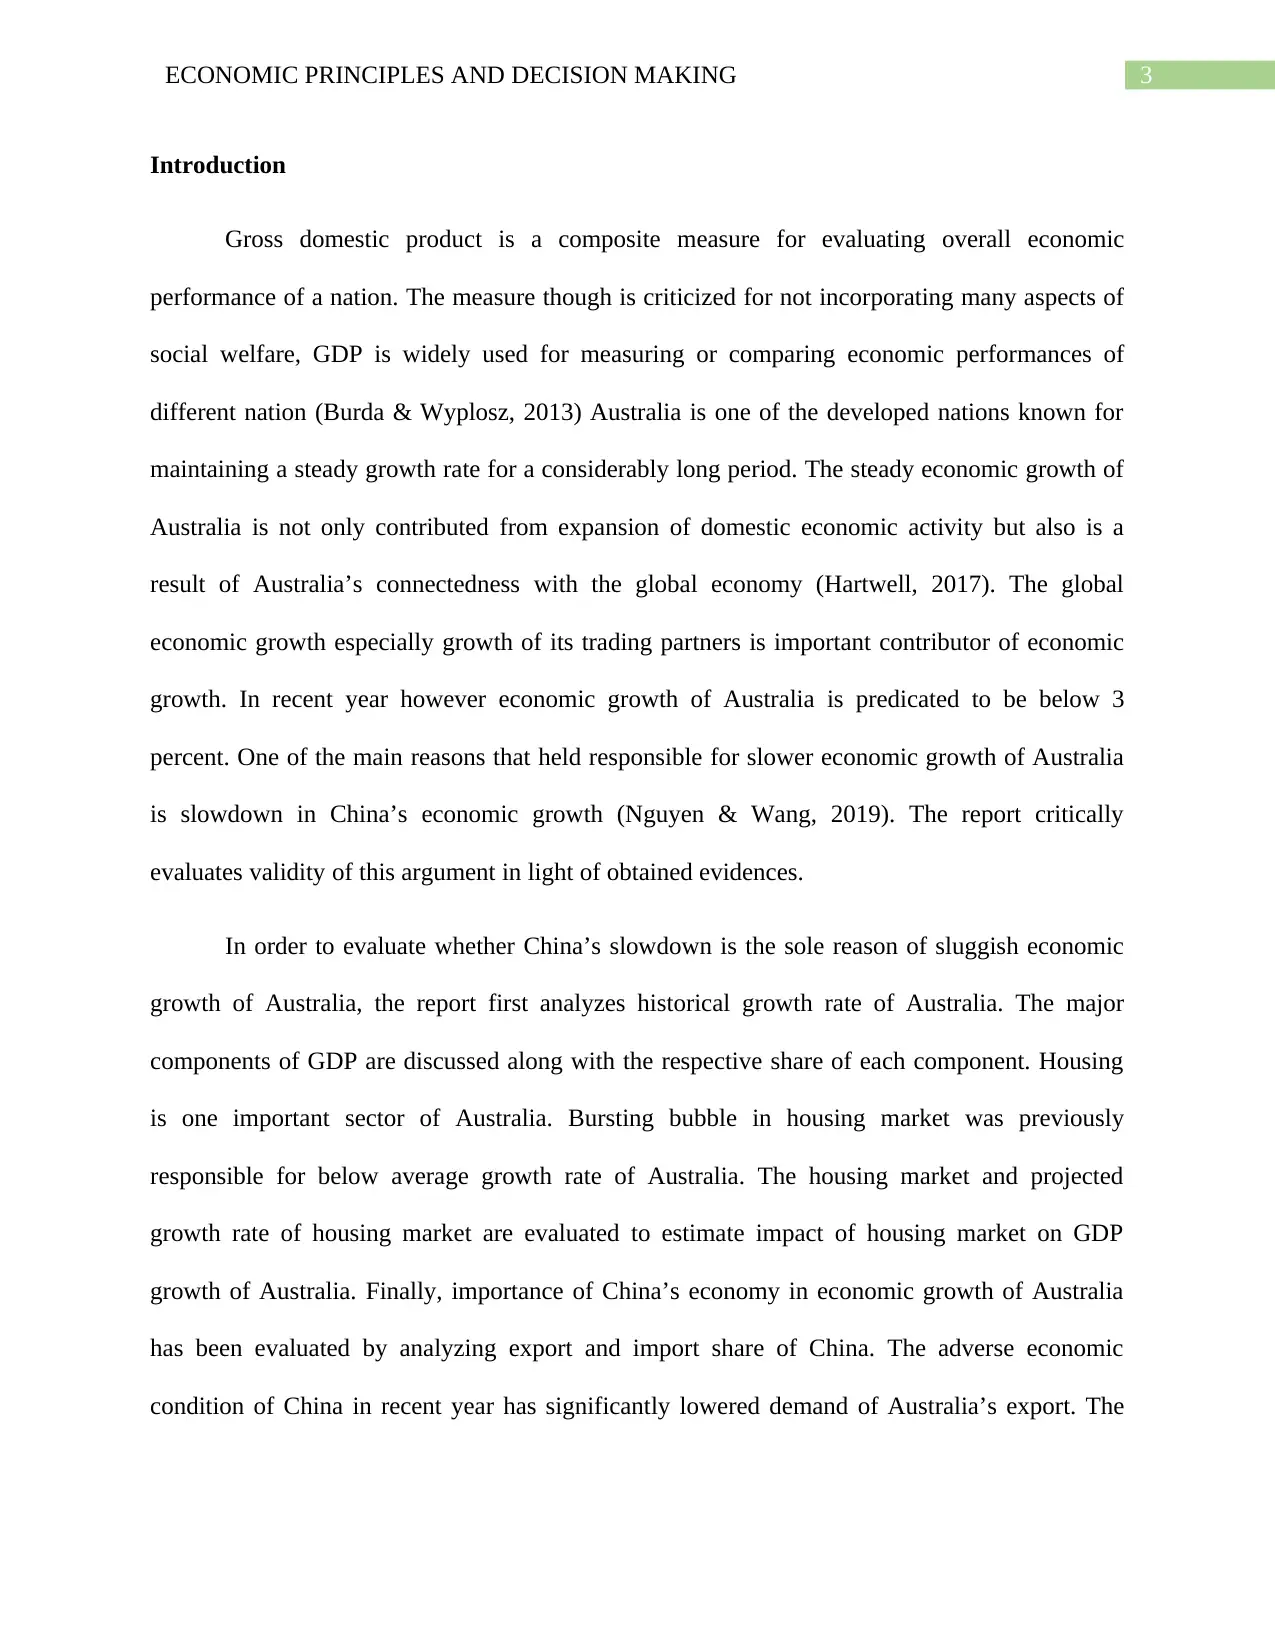
Introduction
Gross domestic product is a composite measure for evaluating overall economic
performance of a nation. The measure though is criticized for not incorporating many aspects of
social welfare, GDP is widely used for measuring or comparing economic performances of
different nation (Burda & Wyplosz, 2013) Australia is one of the developed nations known for
maintaining a steady growth rate for a considerably long period. The steady economic growth of
Australia is not only contributed from expansion of domestic economic activity but also is a
result of Australia’s connectedness with the global economy (Hartwell, 2017). The global
economic growth especially growth of its trading partners is important contributor of economic
growth. In recent year however economic growth of Australia is predicated to be below 3
percent. One of the main reasons that held responsible for slower economic growth of Australia
is slowdown in China’s economic growth (Nguyen & Wang, 2019). The report critically
evaluates validity of this argument in light of obtained evidences.
In order to evaluate whether China’s slowdown is the sole reason of sluggish economic
growth of Australia, the report first analyzes historical growth rate of Australia. The major
components of GDP are discussed along with the respective share of each component. Housing
is one important sector of Australia. Bursting bubble in housing market was previously
responsible for below average growth rate of Australia. The housing market and projected
growth rate of housing market are evaluated to estimate impact of housing market on GDP
growth of Australia. Finally, importance of China’s economy in economic growth of Australia
has been evaluated by analyzing export and import share of China. The adverse economic
condition of China in recent year has significantly lowered demand of Australia’s export. The
Paraphrase This Document
Need a fresh take? Get an instant paraphrase of this document with our AI Paraphraser
4ECONOMIC PRINCIPLES AND DECISION MAKING
impact of China’s slowdown on Australia’s economy has been evaluated by estimating the
projected impact of contraction of net export on economic growth.
Historical GDP growth
The historical growth record of Australia’s GDP revealed that Australia has maintained
an average economic growth rate of 3.2 percent from 1991-92 to 2017-18. With a recorded
growth rate of 2.9 percent in 2017-18, the Australian economy entered to 28th year of
uninterrupted growth. Economic growth in Australia remained higher by the standard of most of
the developed nations in world. The historical growth rate of Australia in last 27 years (from
1992 to 2018) in almost above all the developed nations such as US, UK, Germany, France and
Japan (Boubtane, Dumont & Rault, 2016). The historical GDP growth of Australia is mostly
based on expansion of major sectors of the China. 12 out of 90 priority sectors expanded at a
minimum rate of 3 percent. The growth of service sectors exceeded that of growth of non-service
sectors. The average growth rate of service sector was 3.4 percent as against average growth of
2.1 percent in non-service industries. Industries such as information, media, professional,
scientific and technical service and telecommunication grew by an average rate of over 5%
during this time. Services such as financial or insurance service, health care and social services
grew at a rate of nearly 4.5 percent.
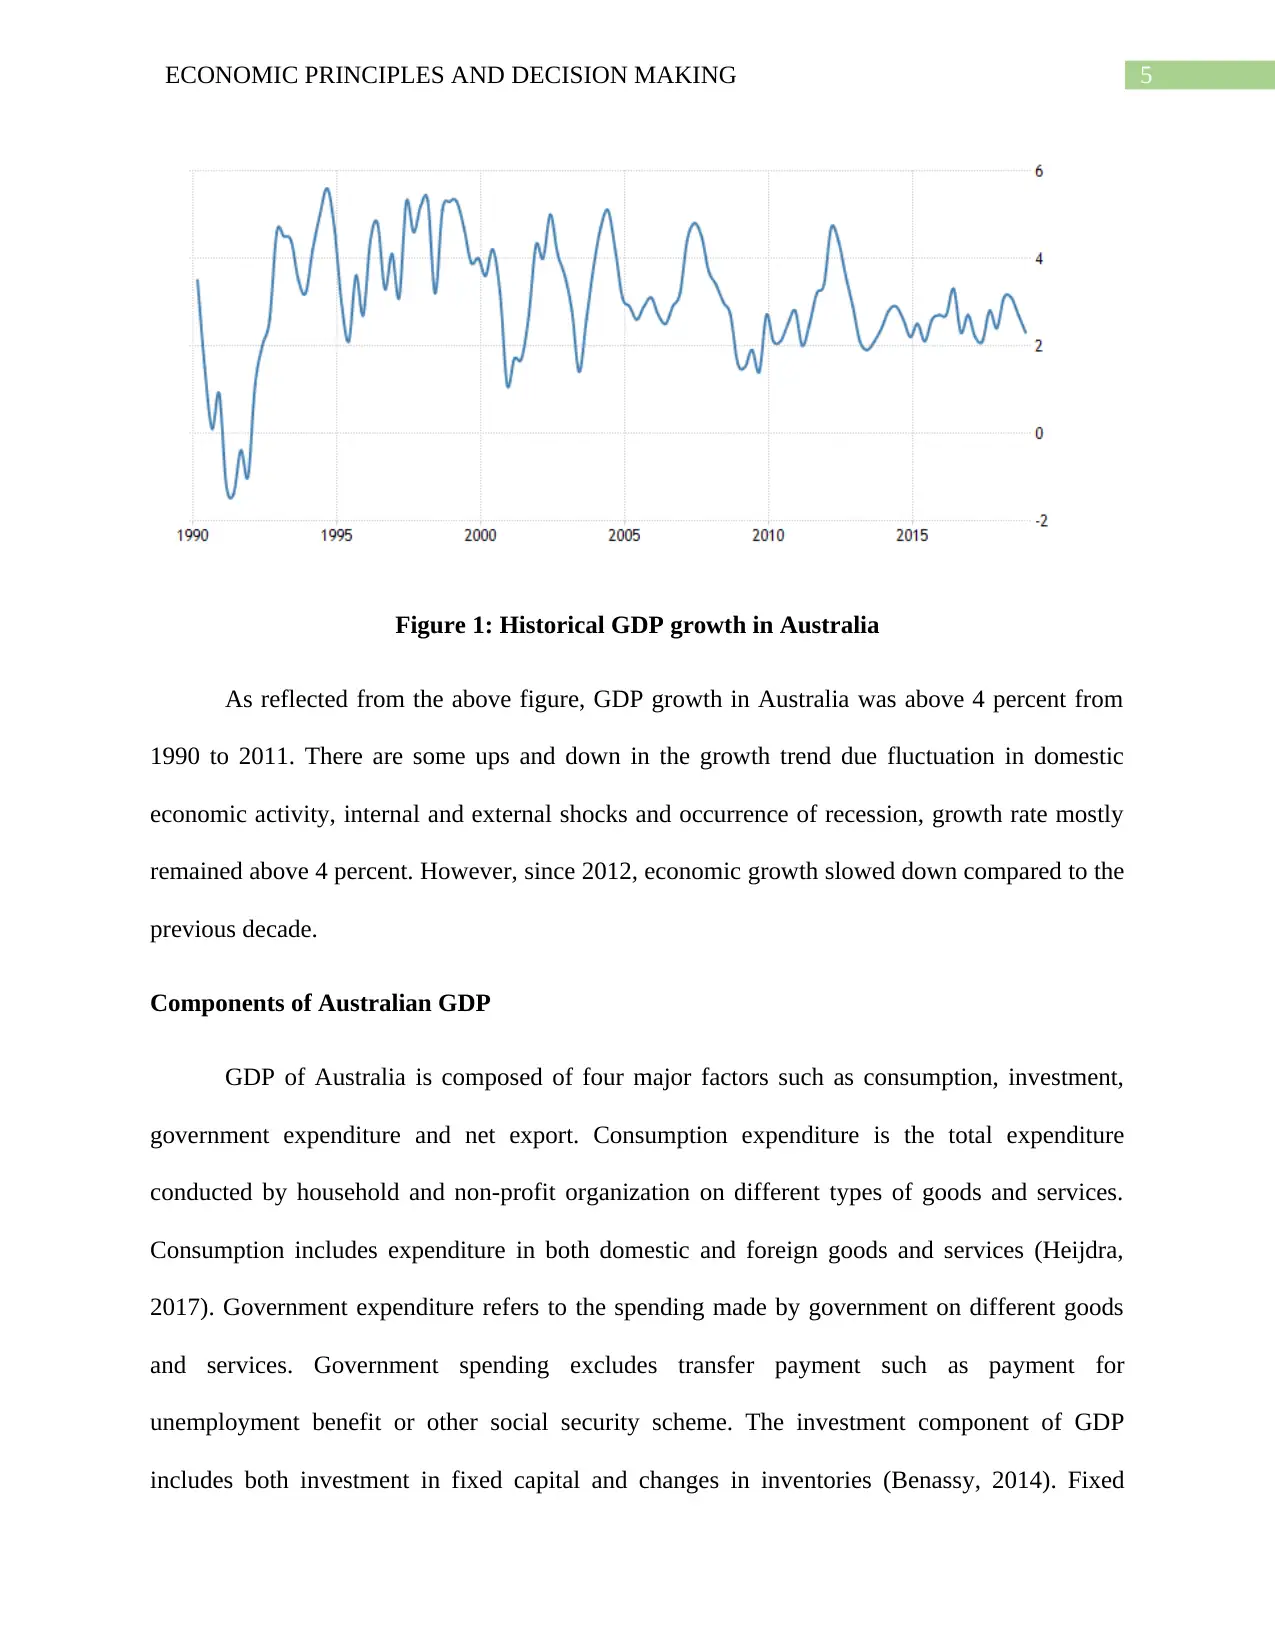
Mining and resources are considered as most important sector of the economy. Service
sector generates more than 75 percent of economy’s output. The most important service in
Australia is financial service with the single sector accounting 9.5 percent of GDP. The figure
below shows trend in historical GDP growth of Australia. IMF has projected that GDP growth
will remain 2.8 percent that is below the average growth of 3 percent in the next five years
(Bjornland, Ravazzolo & Thorsrud, 2017)
impact of China’s slowdown on Australia’s economy has been evaluated by estimating the
projected impact of contraction of net export on economic growth.
Historical GDP growth
The historical growth record of Australia’s GDP revealed that Australia has maintained
an average economic growth rate of 3.2 percent from 1991-92 to 2017-18. With a recorded
growth rate of 2.9 percent in 2017-18, the Australian economy entered to 28th year of
uninterrupted growth. Economic growth in Australia remained higher by the standard of most of
the developed nations in world. The historical growth rate of Australia in last 27 years (from
1992 to 2018) in almost above all the developed nations such as US, UK, Germany, France and
Japan (Boubtane, Dumont & Rault, 2016). The historical GDP growth of Australia is mostly
based on expansion of major sectors of the China. 12 out of 90 priority sectors expanded at a
minimum rate of 3 percent. The growth of service sectors exceeded that of growth of non-service
sectors. The average growth rate of service sector was 3.4 percent as against average growth of
2.1 percent in non-service industries. Industries such as information, media, professional,
scientific and technical service and telecommunication grew by an average rate of over 5%
during this time. Services such as financial or insurance service, health care and social services
grew at a rate of nearly 4.5 percent.
Mining and resources are considered as most important sector of the economy. Service
sector generates more than 75 percent of economy’s output. The most important service in
Australia is financial service with the single sector accounting 9.5 percent of GDP. The figure
below shows trend in historical GDP growth of Australia. IMF has projected that GDP growth
will remain 2.8 percent that is below the average growth of 3 percent in the next five years
(Bjornland, Ravazzolo & Thorsrud, 2017)
5ECONOMIC PRINCIPLES AND DECISION MAKING
Figure 1: Historical GDP growth in Australia
As reflected from the above figure, GDP growth in Australia was above 4 percent from
1990 to 2011. There are some ups and down in the growth trend due fluctuation in domestic
economic activity, internal and external shocks and occurrence of recession, growth rate mostly
remained above 4 percent. However, since 2012, economic growth slowed down compared to the
previous decade.
Components of Australian GDP
GDP of Australia is composed of four major factors such as consumption, investment,
government expenditure and net export. Consumption expenditure is the total expenditure
conducted by household and non-profit organization on different types of goods and services.
Consumption includes expenditure in both domestic and foreign goods and services (Heijdra,
2017). Government expenditure refers to the spending made by government on different goods
and services. Government spending excludes transfer payment such as payment for
unemployment benefit or other social security scheme. The investment component of GDP
includes both investment in fixed capital and changes in inventories (Benassy, 2014). Fixed
⊘ This is a preview!⊘
Do you want full access?
Subscribe today to unlock all pages.
Trusted by 1+ million students worldwide
6ECONOMIC PRINCIPLES AND DECISION MAKING
capital investment indicates investment in machinery, equipment, raw materials and such others
that are useful for future production. Inventory investment on the other hand include stock of
goods kept by sellers. The net export component includes both export and import of goods and
services from different nation (Gottheil, 2013) The trade balance obtained as export less import
included in the GDP.
Share of different components in GDP
Consumption
Consumption accounts largest share in Australia’s GDP with the share being 56.1
percent. consumption expenditure include purchase made by household on all products, payment
given to government such as license fee, spending on durable and non-durable goods and
services and other expenditure.
Investment
The average share of investment in Australia’s GDP is 27.4% from September 1959 to
December 2018. The share reached to an all-time high of 35.7% in December 1968. The lowest
share accounted in the year 1992 with the share being 21.2 percent. Contribution of investment
in GDP is computed by estimating the percentage share of investment in GDP (Findlay &
Garnaut, 2017). Gross fixed capital formation is estimated by adding gross fixed capital
formation and changes in inventories.
Government expenditure
On an average government spending accounts 18.6 percent share in GDP. Government
spending includes expenditures on healthcare facilities, spending on defense, building of road,
Paraphrase This Document
Need a fresh take? Get an instant paraphrase of this document with our AI Paraphraser
7ECONOMIC PRINCIPLES AND DECISION MAKING
museums, maintenance of heritage building, national park and other social expenditure (Makin,
Pearce & Ratnasiri, 2019).
Net export
In addition to expansion of domestic sectors, external sectors play an important role in
national accounts of Australia. The share of net export in GDP though is only 0.6 percent,
fluctuation in net export significantly influences net export of Australia. The main exports of
Australia include iron ore, gold, wheat, coal briquettes, copper ore, wool, aluminum, wine and
others (Rahman & Mamun, 2016) Top five imports of Australia include refined petroleum, crude
petroleum, diamonds, gold and coffee. Other imports of Australia include computers, car,
broadcasting equipment, delivery truck and packaged medicament.
Housing market in Australia
Australia is highly dependent on the construction sector. In the last five years till 2017,
housing prices in Australia increased by almost 50 percent. Since then housing price seems to be
falling by 9 percent (Gurran & Phibbs, 2015) The slump in housing market is often blamed as the
biggest reason for recent slowdown in Australia’s economy.
8ECONOMIC PRINCIPLES AND DECISION MAKING
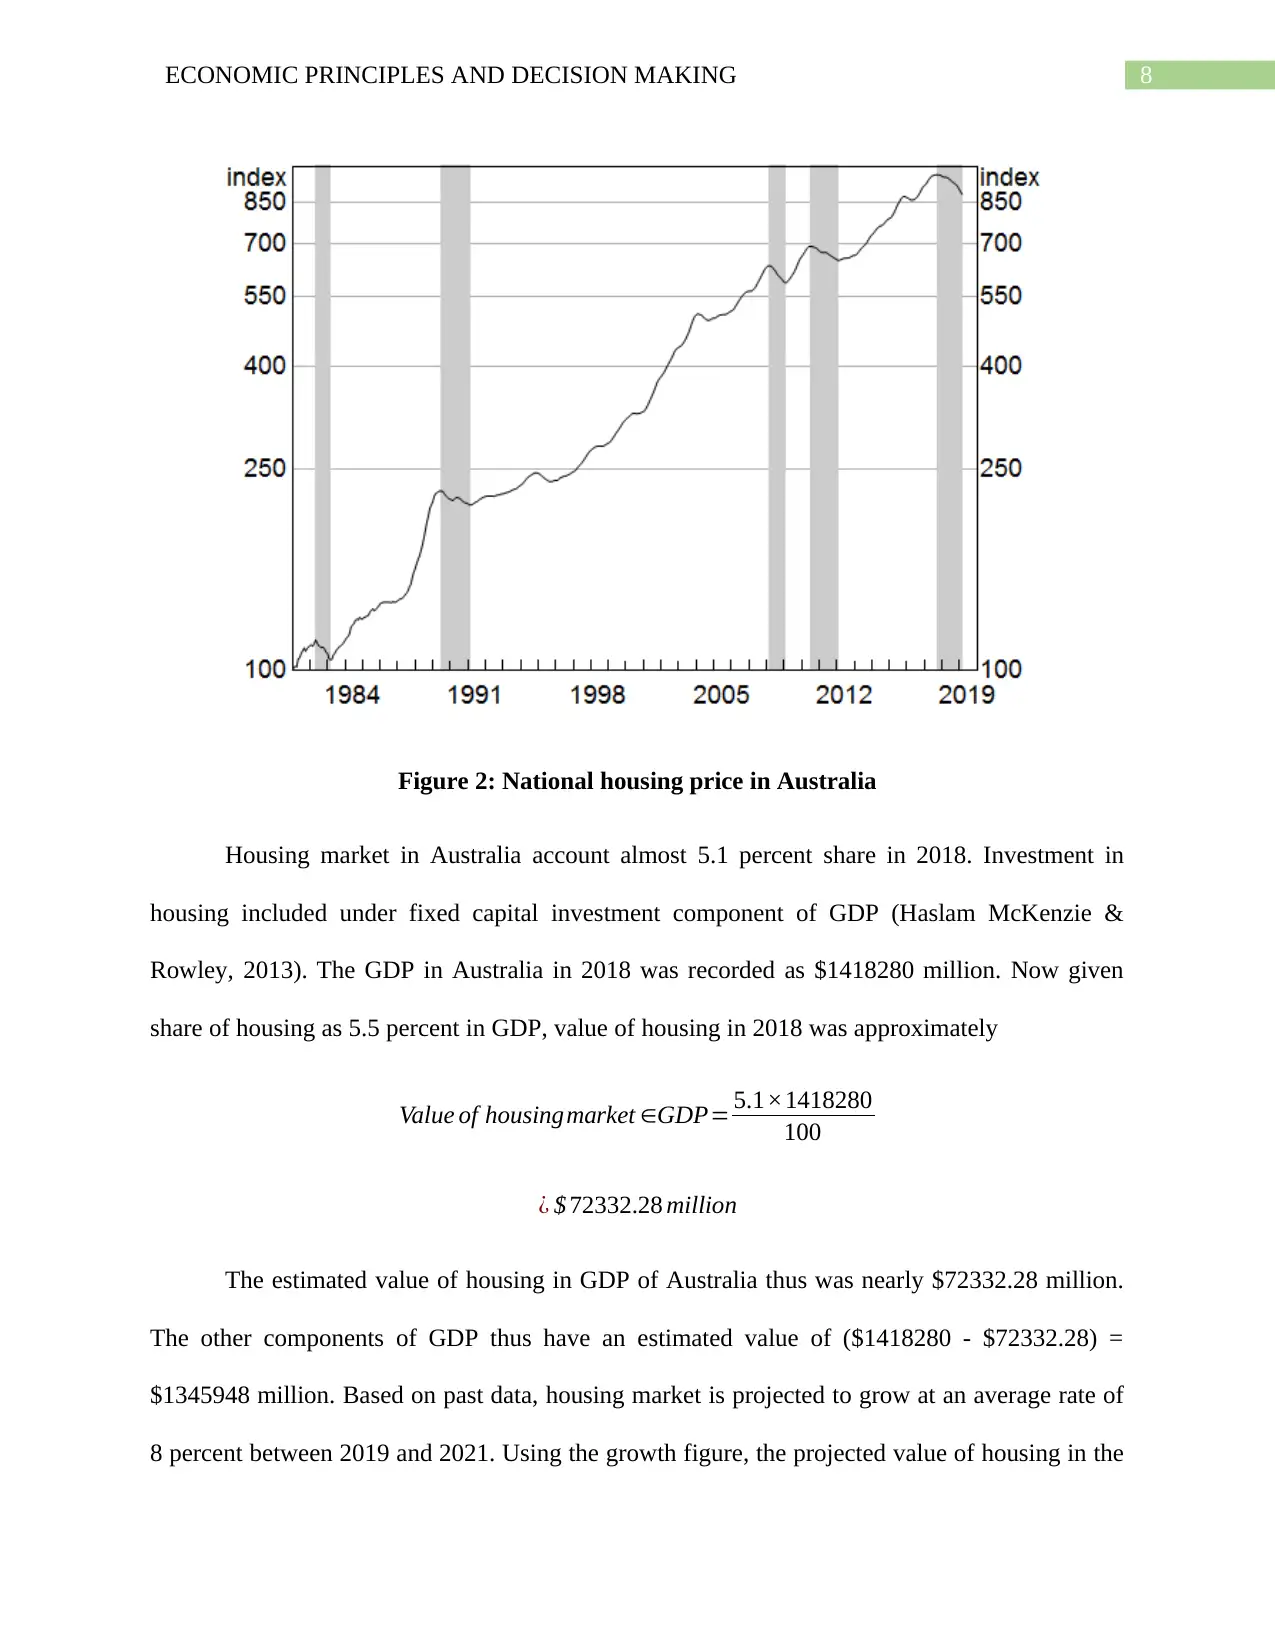
Figure 2: National housing price in Australia
Housing market in Australia account almost 5.1 percent share in 2018. Investment in
housing included under fixed capital investment component of GDP (Haslam McKenzie &
Rowley, 2013). The GDP in Australia in 2018 was recorded as $1418280 million. Now given
share of housing as 5.5 percent in GDP, value of housing in 2018 was approximately
Value of housingmarket ∈GDP= 5.1×1418280
100
¿ $ 72332.28 million
The estimated value of housing in GDP of Australia thus was nearly $72332.28 million.
The other components of GDP thus have an estimated value of ($1418280 - $72332.28) =
$1345948 million. Based on past data, housing market is projected to grow at an average rate of
8 percent between 2019 and 2021. Using the growth figure, the projected value of housing in the
⊘ This is a preview!⊘
Do you want full access?
Subscribe today to unlock all pages.
Trusted by 1+ million students worldwide
9ECONOMIC PRINCIPLES AND DECISION MAKING
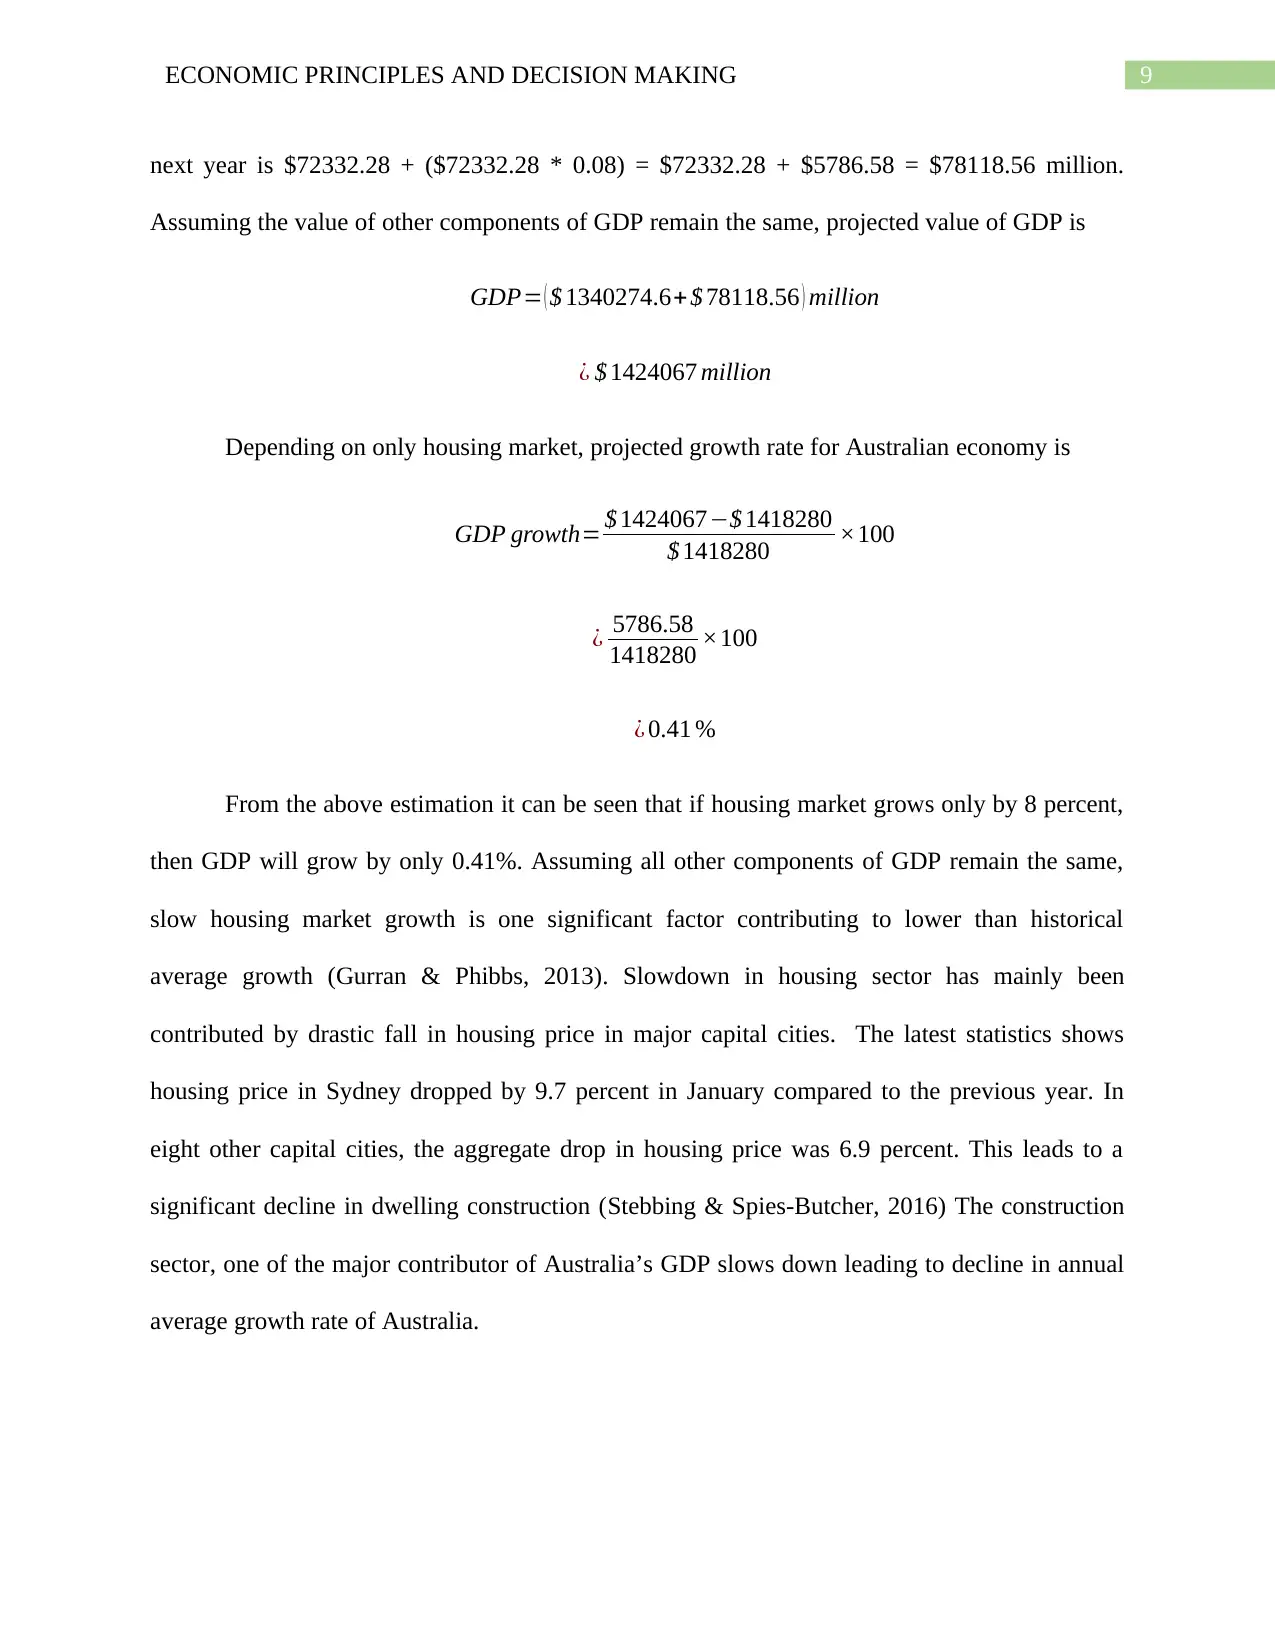
next year is $72332.28 + ($72332.28 * 0.08) = $72332.28 + $5786.58 = $78118.56 million.
Assuming the value of other components of GDP remain the same, projected value of GDP is
GDP= ( $ 1340274.6+ $ 78118.56 ) million
¿ $ 1424067 million
Depending on only housing market, projected growth rate for Australian economy is
GDP growth= $ 1424067−$ 1418280
$ 1418280 ×100
¿ 5786.58
1418280 ×100
¿ 0.41 %
From the above estimation it can be seen that if housing market grows only by 8 percent,
then GDP will grow by only 0.41%. Assuming all other components of GDP remain the same,
slow housing market growth is one significant factor contributing to lower than historical
average growth (Gurran & Phibbs, 2013). Slowdown in housing sector has mainly been
contributed by drastic fall in housing price in major capital cities. The latest statistics shows
housing price in Sydney dropped by 9.7 percent in January compared to the previous year. In
eight other capital cities, the aggregate drop in housing price was 6.9 percent. This leads to a
significant decline in dwelling construction (Stebbing & Spies-Butcher, 2016) The construction
sector, one of the major contributor of Australia’s GDP slows down leading to decline in annual
average growth rate of Australia.
Paraphrase This Document
Need a fresh take? Get an instant paraphrase of this document with our AI Paraphraser
10ECONOMIC PRINCIPLES AND DECISION MAKING
Slowdown in China’s economy
Australia’s export
Australia is considered as 23rd largest exporting nation. Export earnings of Australia in
2018 amounts to be $253.8 billion. China is one of leading trading partners of Australia. One
third of Australia’s exports is shipped to China. Two most important export commodities of
Australia are iron ore and coal, together worth nearly $120 billion. The share of iron ore and
coals in total Australian export is 30 percent. The next vital export component of Australian
export is education service accounting 8 percent of total export. Major exportable of Australia
are mineral fuels, ores, gems and precious metals, meat, inorganic chemicals, cereals, aluminum,
machinery, optical, technical and medical equipment. Major export market of Australia is China,
United State, United Kingdom, South Korea, Japan and others. Among these nations, China
accounts the largest share in export with the value of export to China is $74 billion.
Australia’s import
Australia mainly imports machinery, mineral fuel, vehicles, electric machinery, gems and
precious metals, plastic articles, iron ore, steel and others. The top 10 imports of Australia
account nearly 69.2 percent of total import. Total value of imports in Australia is recorded as
$227.3 billion.
China’s share in Australia’s export
11ECONOMIC PRINCIPLES AND DECISION MAKING
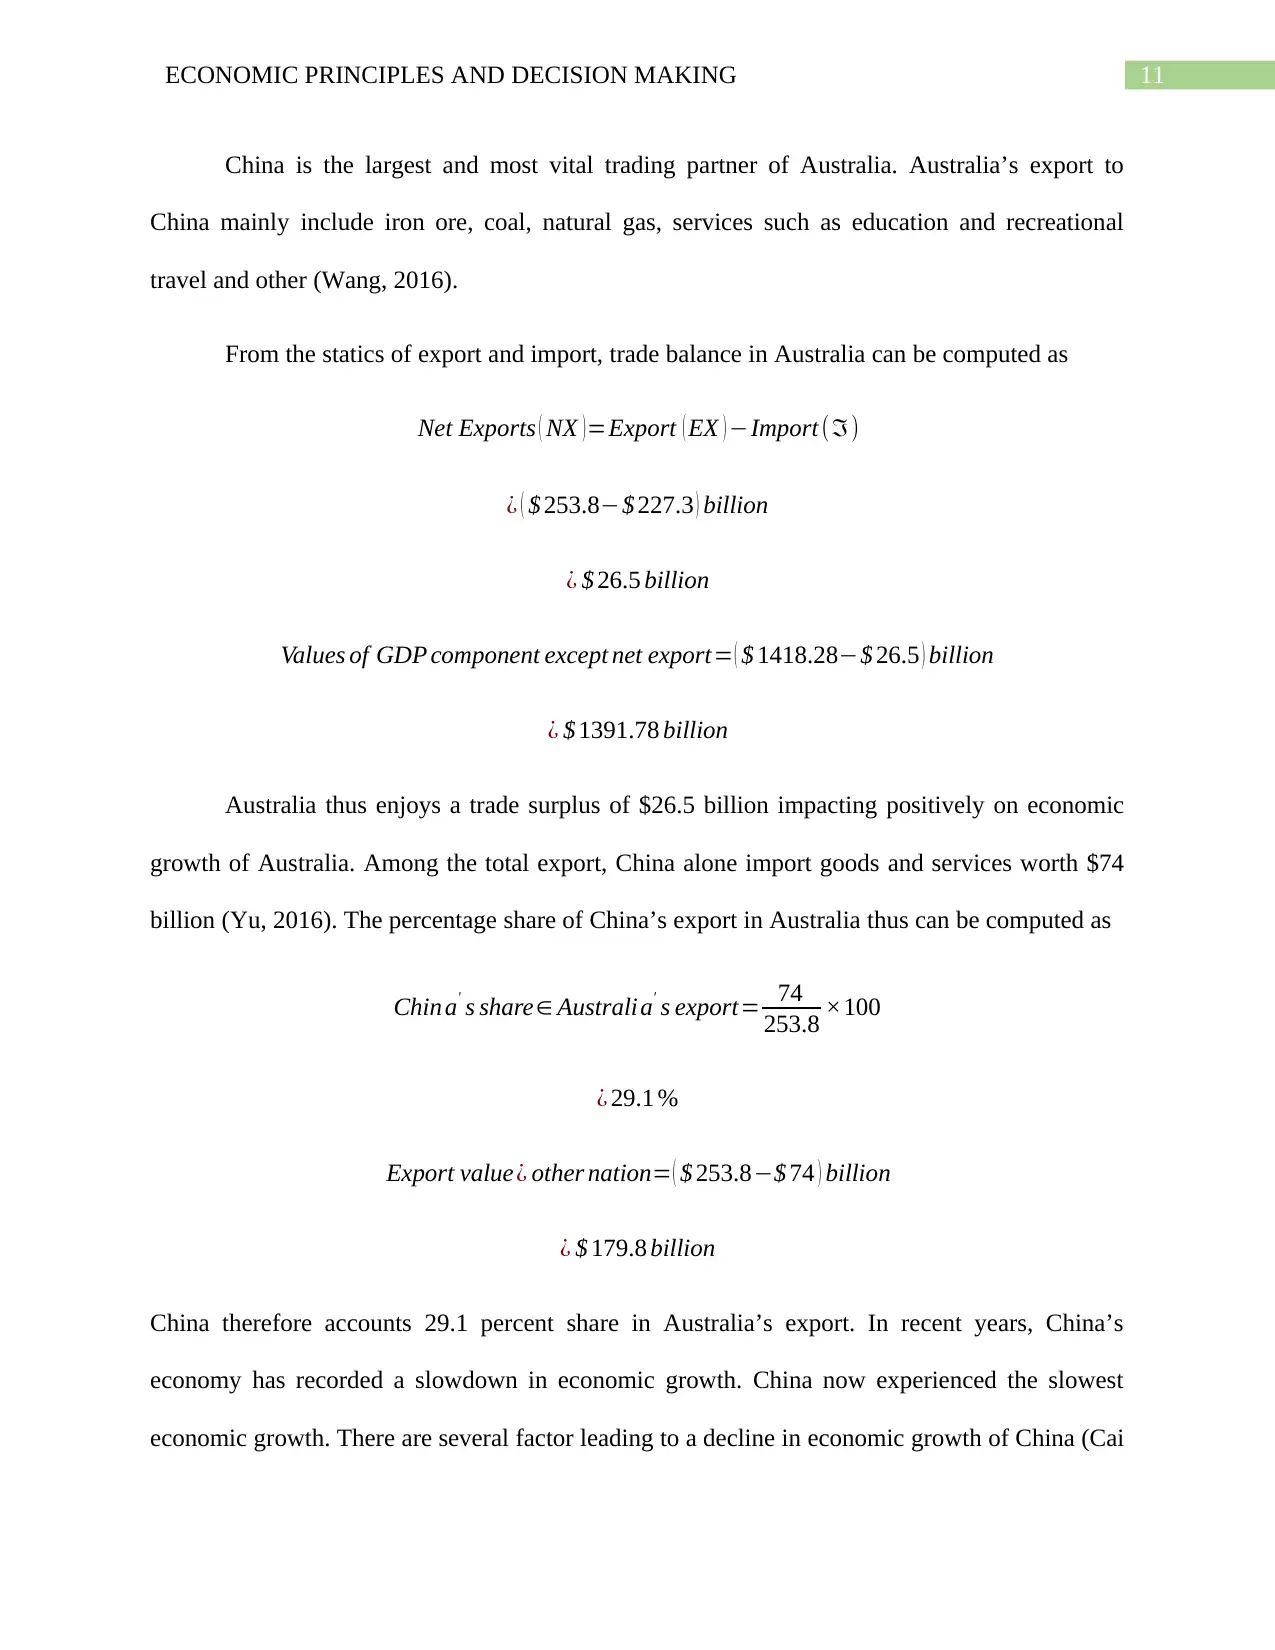
China is the largest and most vital trading partner of Australia. Australia’s export to
China mainly include iron ore, coal, natural gas, services such as education and recreational
travel and other (Wang, 2016).
From the statics of export and import, trade balance in Australia can be computed as
Net Exports ( NX ) =Export ( EX ) −Import (ℑ)
¿ ( $ 253.8−$ 227.3 ) billion
¿ $ 26.5 billion
Values of GDP component except net export= ( $ 1418.28−$ 26.5 ) billion
¿ $ 1391.78 billion
Australia thus enjoys a trade surplus of $26.5 billion impacting positively on economic
growth of Australia. Among the total export, China alone import goods and services worth $74
billion (Yu, 2016). The percentage share of China’s export in Australia thus can be computed as
Chin a' s share∈ Australia' s export= 74
253.8 ×100
¿ 29.1 %
Export value¿ other nation= ( $ 253.8−$ 74 ) billion
¿ $ 179.8 billion
China therefore accounts 29.1 percent share in Australia’s export. In recent years, China’s
economy has recorded a slowdown in economic growth. China now experienced the slowest
economic growth. There are several factor leading to a decline in economic growth of China (Cai
⊘ This is a preview!⊘
Do you want full access?
Subscribe today to unlock all pages.
Trusted by 1+ million students worldwide
1 out of 18
Related Documents


Your All-in-One AI-Powered Toolkit for Academic Success.
+13062052269
info@desklib.com
Available 24*7 on WhatsApp / Email
![[object Object]](/_next/static/media/star-bottom.7253800d.svg)
Unlock your academic potential
Copyright © 2020–2026 A2Z Services. All Rights Reserved. Developed and managed by ZUCOL.