Evaluating Economic Conditions and Financial System of Australia
VerifiedAdded on 2023/06/13
|14
|2870
|436
Report
AI Summary
This report provides an overview of Australia's economic conditions and financial system, covering aspects such as GDP growth, inflation, and employment statistics. It delves into the business cycle, highlighting Australia's current expansion phase, and examines the structure of the financial system, including currency, government debt, stock exchanges, and regulatory bodies. The report also discusses the size of capital and money markets in US dollars, along with over-the-counter derivatives. Practical examples illustrate financial products and their applications, while the concluding section addresses market risk. Desklib provides access to similar solved assignments and past papers for students seeking further assistance.

Business
Paraphrase This Document
Need a fresh take? Get an instant paraphrase of this document with our AI Paraphraser
Business 1
Contents
Economic conditions.......................................................................................................................2
Business cycle..............................................................................................................................4
Overview of financial system..........................................................................................................5
Currency......................................................................................................................................5
Government debt.........................................................................................................................5
Stock exchanges...........................................................................................................................6
Regulators in the financial system...............................................................................................6
Size of capital markets in US $....................................................................................................7
Size of Money markets in US$....................................................................................................7
Size of over the counter derivatives in the US$..........................................................................7
Product examples.............................................................................................................................7
Market risk.....................................................................................................................................11
References......................................................................................................................................12
Business 2
The company that has been selected for this assessment is Australia. The country is sovereign
that comprises of the mainland of the Australian continent with the island of Tasmania and
numerous smaller islands. Australia is the largest country in Oceania and world’s sixth largest
country by total area.
Economic conditions
The Australian economy is growing and has enjoyed a success in the recent decades that reflects
that the company has a strong macroeconomic policy, structural reform, and the long commodity
boom. The economy of the country grew by 2 ½ percent over 2016. In the year 2016, the GDP of
the country was 1204.62 billion US dollars (Reserve Bank of Australia, 2017). The GDP value of
the country reflects 1.94% of the world economy (Trading Economics, 2018).
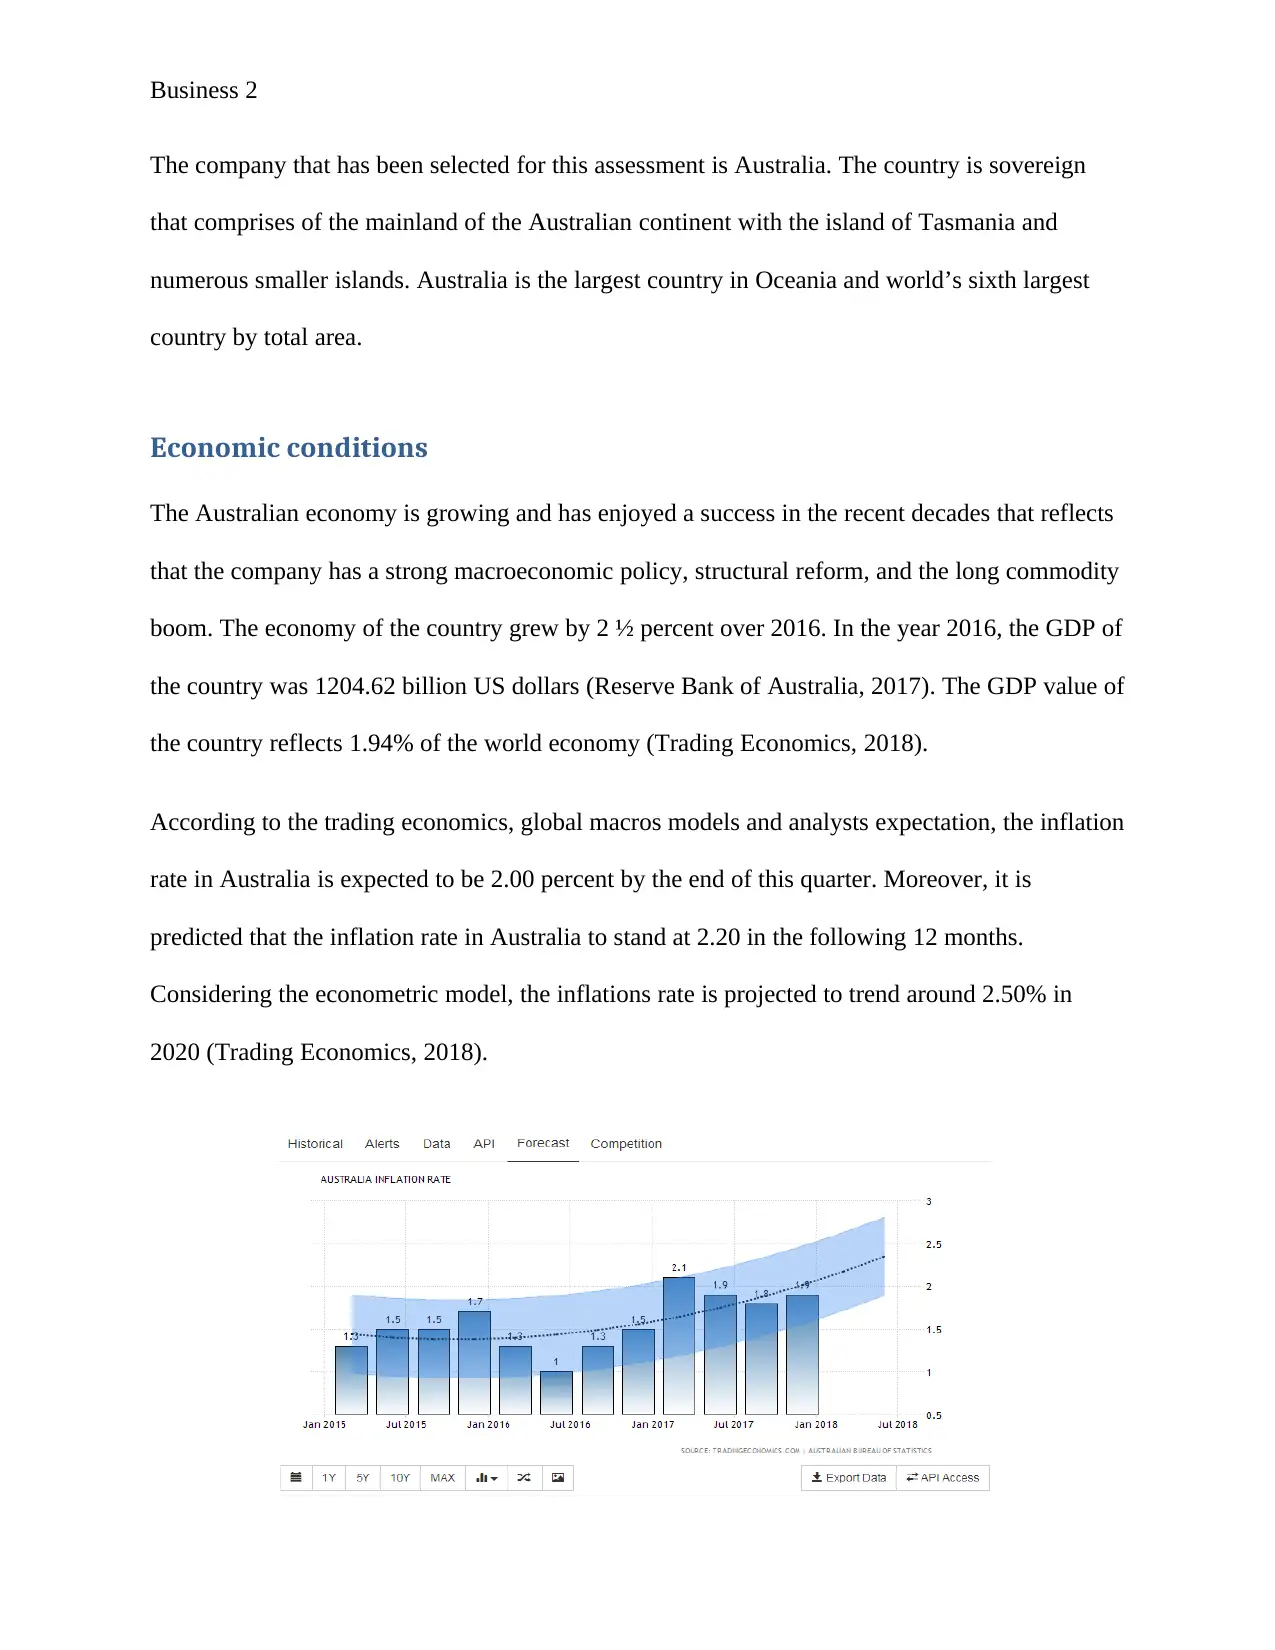
According to the trading economics, global macros models and analysts expectation, the inflation
rate in Australia is expected to be 2.00 percent by the end of this quarter. Moreover, it is
predicted that the inflation rate in Australia to stand at 2.20 in the following 12 months.
Considering the econometric model, the inflations rate is projected to trend around 2.50% in
2020 (Trading Economics, 2018).
The company that has been selected for this assessment is Australia. The country is sovereign
that comprises of the mainland of the Australian continent with the island of Tasmania and
numerous smaller islands. Australia is the largest country in Oceania and world’s sixth largest
country by total area.
Economic conditions
The Australian economy is growing and has enjoyed a success in the recent decades that reflects
that the company has a strong macroeconomic policy, structural reform, and the long commodity
boom. The economy of the country grew by 2 ½ percent over 2016. In the year 2016, the GDP of
the country was 1204.62 billion US dollars (Reserve Bank of Australia, 2017). The GDP value of
the country reflects 1.94% of the world economy (Trading Economics, 2018).
According to the trading economics, global macros models and analysts expectation, the inflation
rate in Australia is expected to be 2.00 percent by the end of this quarter. Moreover, it is
predicted that the inflation rate in Australia to stand at 2.20 in the following 12 months.
Considering the econometric model, the inflations rate is projected to trend around 2.50% in
2020 (Trading Economics, 2018).
⊘ This is a preview!⊘
Do you want full access?
Subscribe today to unlock all pages.
Trusted by 1+ million students worldwide
Business 3
(Source: Trading Economics, 2018)
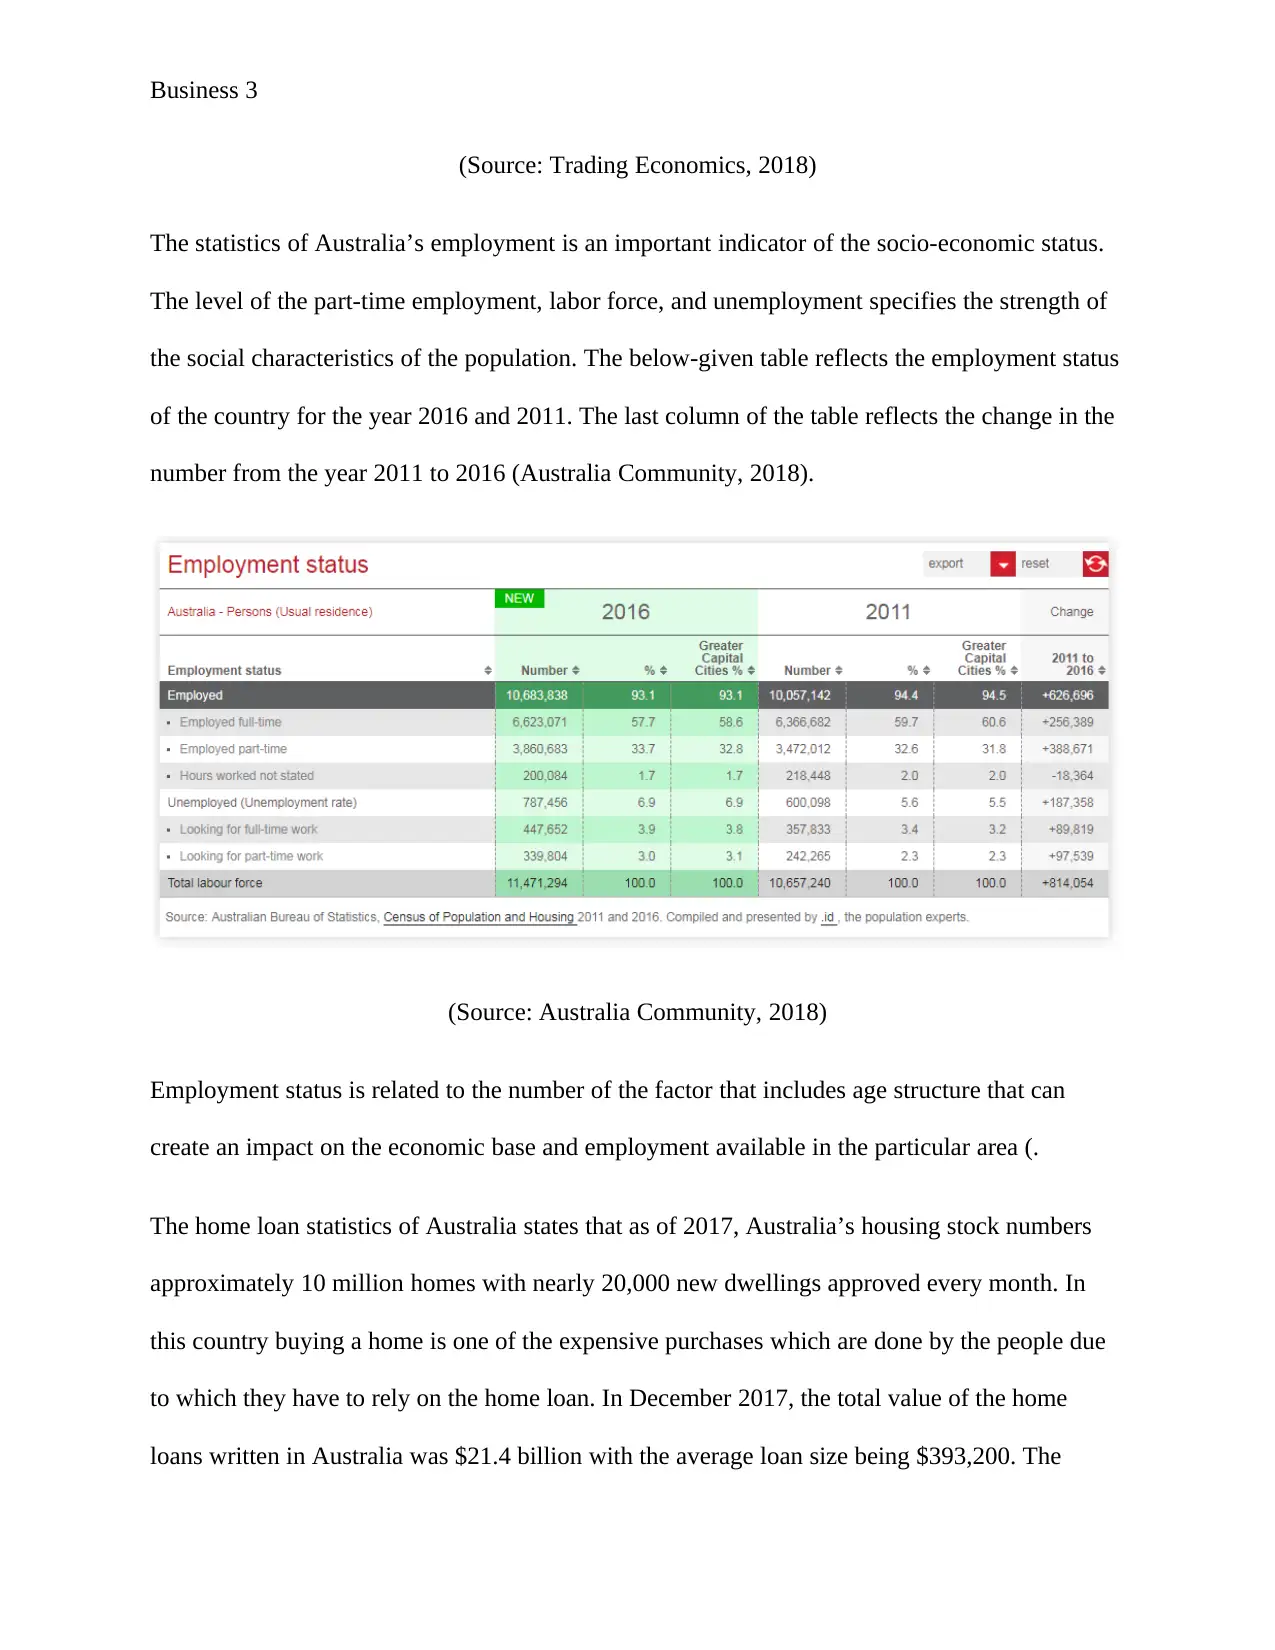
The statistics of Australia’s employment is an important indicator of the socio-economic status.
The level of the part-time employment, labor force, and unemployment specifies the strength of
the social characteristics of the population. The below-given table reflects the employment status
of the country for the year 2016 and 2011. The last column of the table reflects the change in the
number from the year 2011 to 2016 (Australia Community, 2018).
(Source: Australia Community, 2018)
Employment status is related to the number of the factor that includes age structure that can
create an impact on the economic base and employment available in the particular area (.
The home loan statistics of Australia states that as of 2017, Australia’s housing stock numbers
approximately 10 million homes with nearly 20,000 new dwellings approved every month. In
this country buying a home is one of the expensive purchases which are done by the people due
to which they have to rely on the home loan. In December 2017, the total value of the home
loans written in Australia was $21.4 billion with the average loan size being $393,200. The
(Source: Trading Economics, 2018)
The statistics of Australia’s employment is an important indicator of the socio-economic status.
The level of the part-time employment, labor force, and unemployment specifies the strength of
the social characteristics of the population. The below-given table reflects the employment status
of the country for the year 2016 and 2011. The last column of the table reflects the change in the
number from the year 2011 to 2016 (Australia Community, 2018).
(Source: Australia Community, 2018)
Employment status is related to the number of the factor that includes age structure that can
create an impact on the economic base and employment available in the particular area (.
The home loan statistics of Australia states that as of 2017, Australia’s housing stock numbers
approximately 10 million homes with nearly 20,000 new dwellings approved every month. In
this country buying a home is one of the expensive purchases which are done by the people due
to which they have to rely on the home loan. In December 2017, the total value of the home
loans written in Australia was $21.4 billion with the average loan size being $393,200. The
Paraphrase This Document
Need a fresh take? Get an instant paraphrase of this document with our AI Paraphraser
Business 4
average loan decreases to $334,700 for the first home buyers. In the country, New South Wales
State has the highest average loan at $460,100 compared with any other state (Finder, 2018).
Considering the data, it has been analyzed that the home loan falls in Australia than previous.
Business cycle
The business cycle refers to as the economy-wide fluctuation in production, general economic
activity, and trade. This business cycle has four distinct phases which include expansion, peak,
contraction and tough (Kent, 2014).
Currently, Australia is in expansion phase because of the following reasons: -
Increase in employment: - Considering the analysis conducted it has been found that
there is growth in the employment with the rise in the labor force that shows that
expansion of the company brought a rise in the opportunities for candidates.
Rise in prices: - there is a rise in the inflation of the country which shows that the prices
of the products are increasing due to which the phase of the country is expansion.
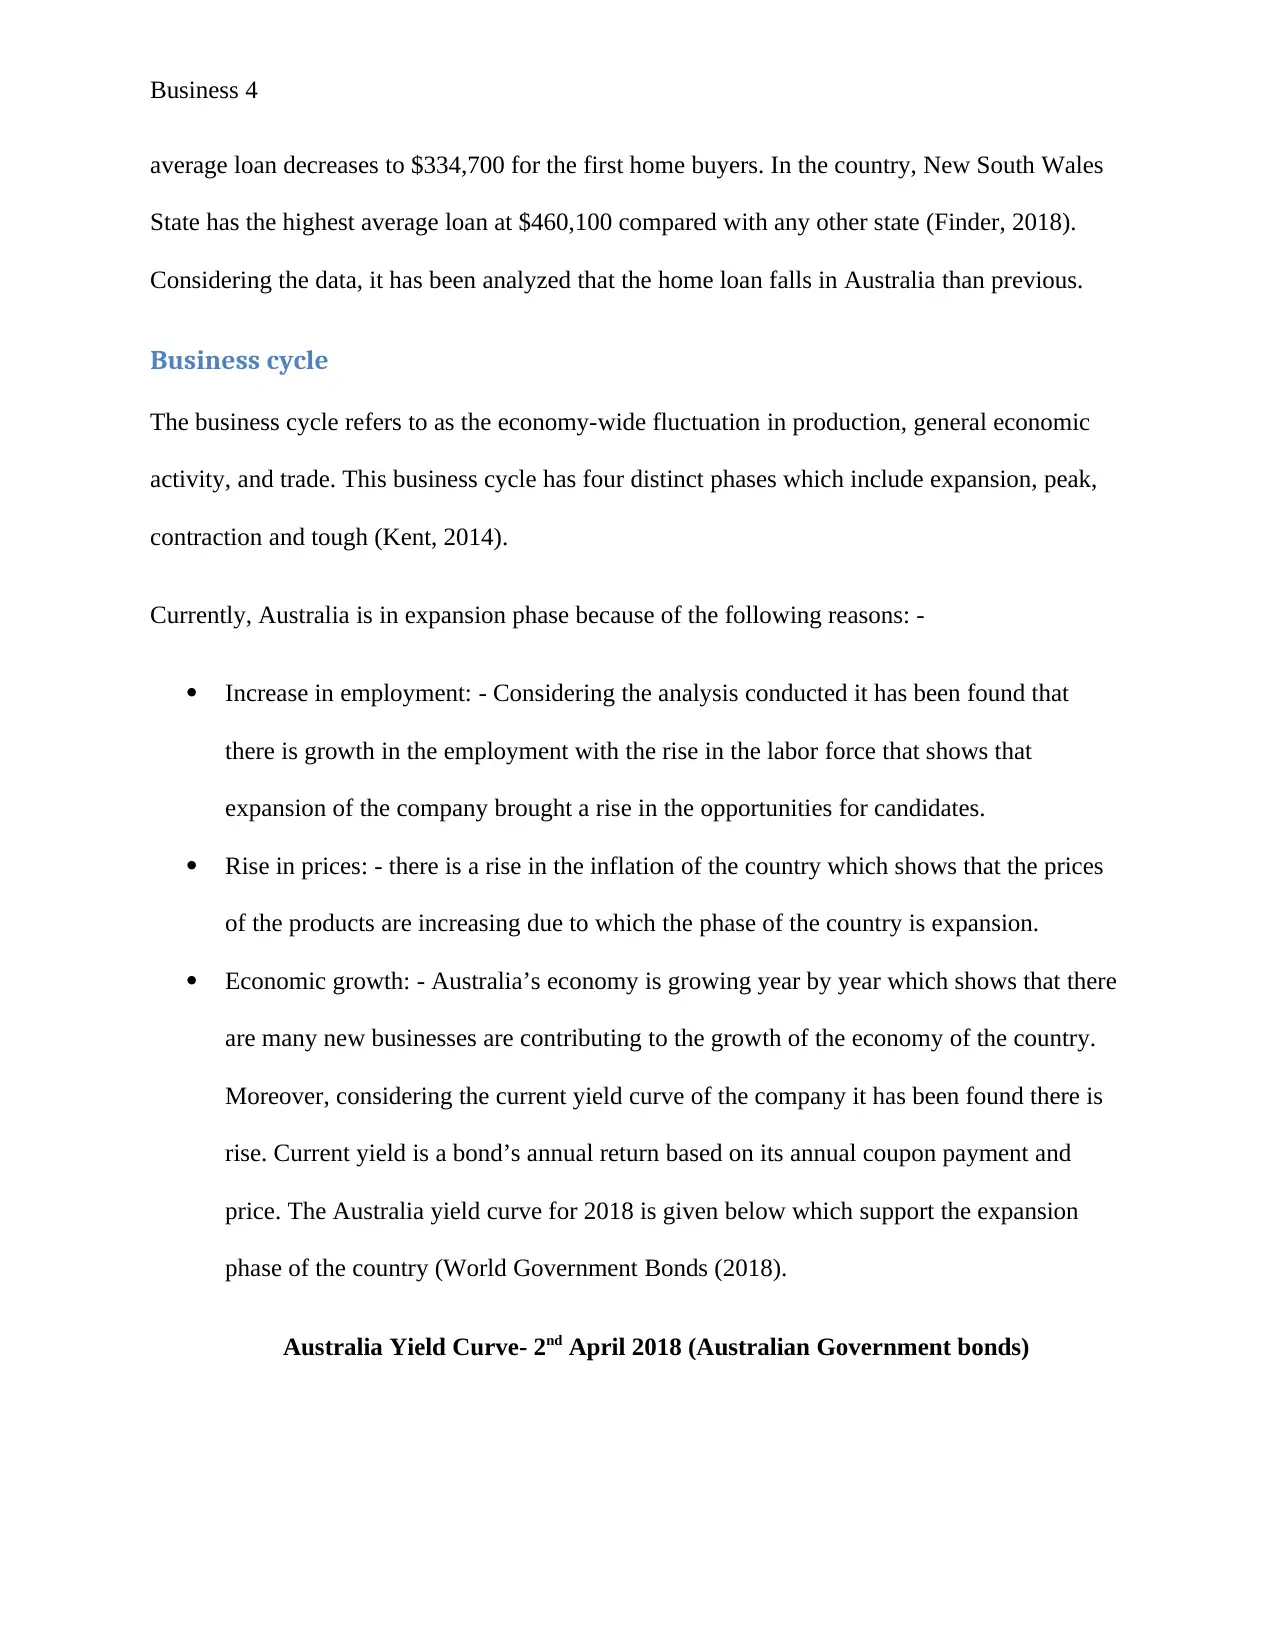
Economic growth: - Australia’s economy is growing year by year which shows that there
are many new businesses are contributing to the growth of the economy of the country.
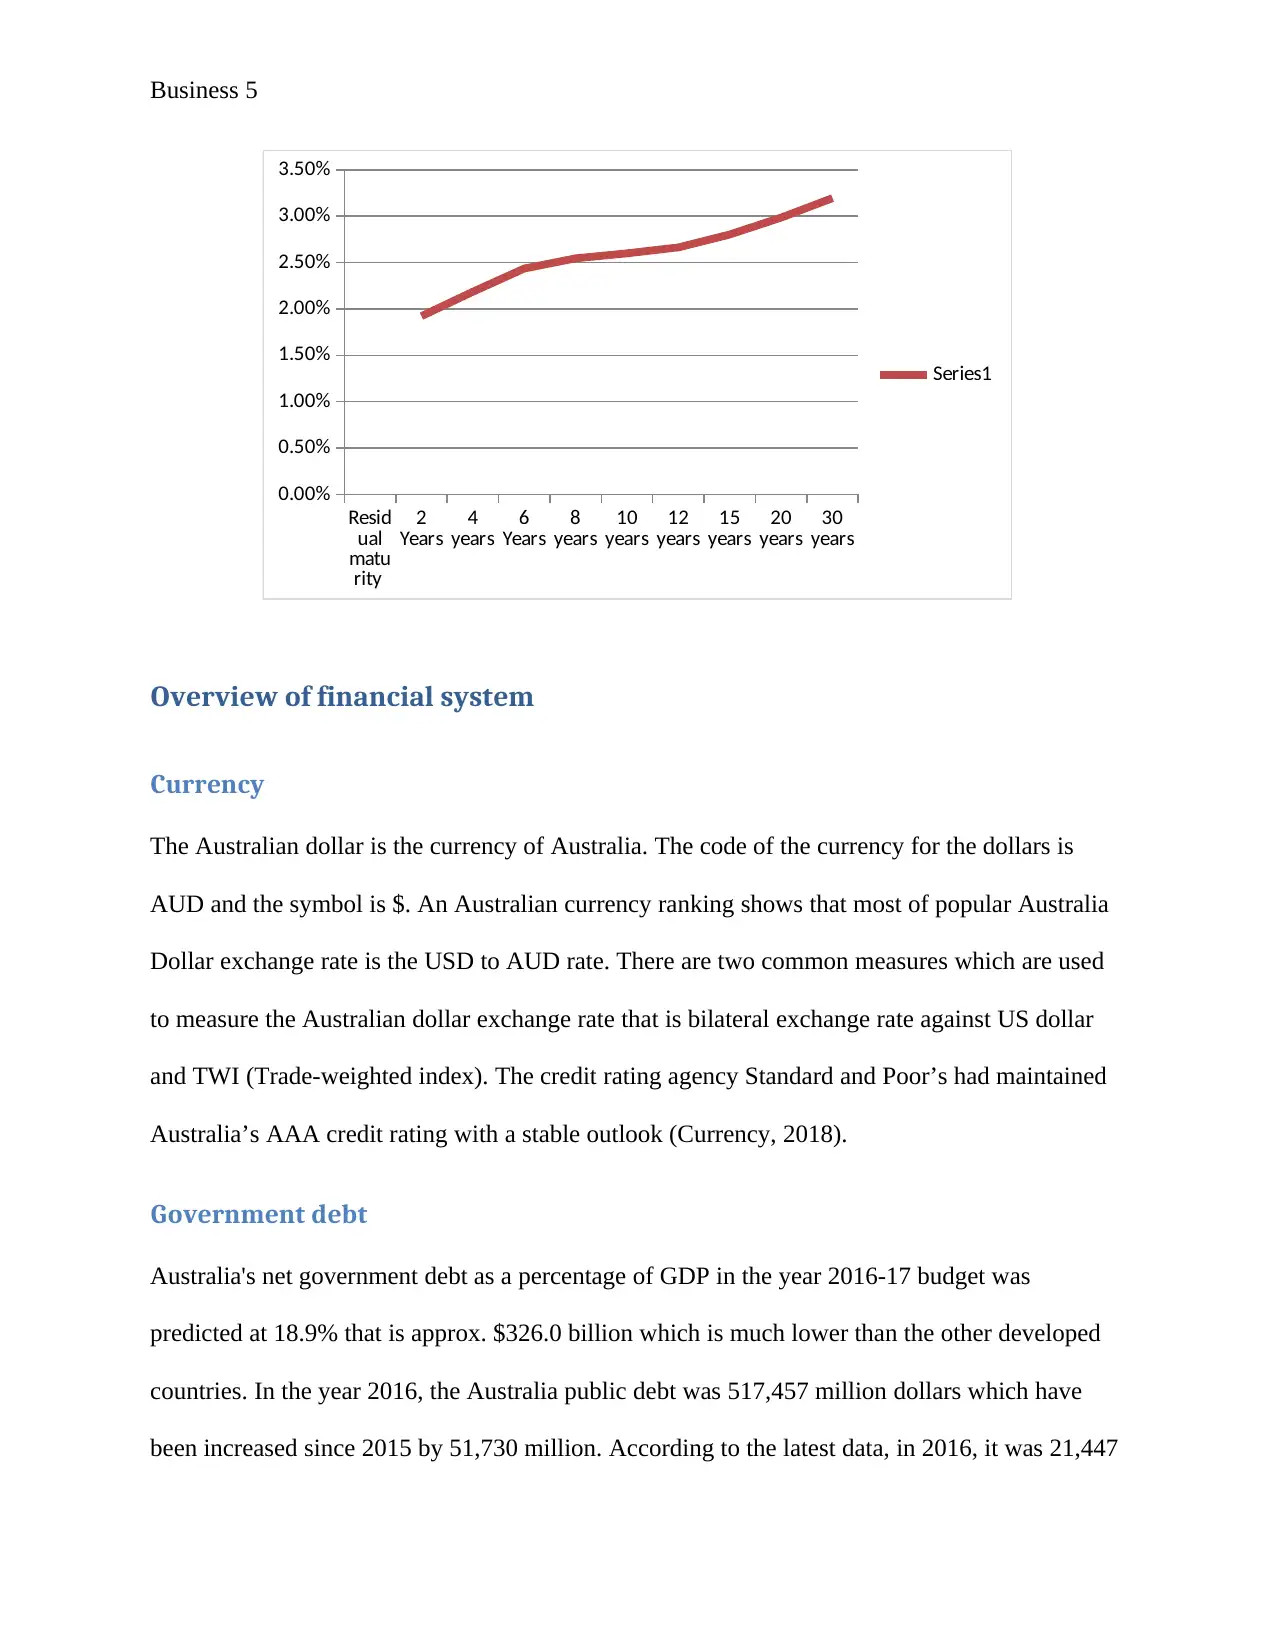
Moreover, considering the current yield curve of the company it has been found there is
rise. Current yield is a bond’s annual return based on its annual coupon payment and
price. The Australia yield curve for 2018 is given below which support the expansion
phase of the country (World Government Bonds (2018).
Australia Yield Curve- 2nd April 2018 (Australian Government bonds)
average loan decreases to $334,700 for the first home buyers. In the country, New South Wales
State has the highest average loan at $460,100 compared with any other state (Finder, 2018).
Considering the data, it has been analyzed that the home loan falls in Australia than previous.
Business cycle
The business cycle refers to as the economy-wide fluctuation in production, general economic
activity, and trade. This business cycle has four distinct phases which include expansion, peak,
contraction and tough (Kent, 2014).
Currently, Australia is in expansion phase because of the following reasons: -
Increase in employment: - Considering the analysis conducted it has been found that
there is growth in the employment with the rise in the labor force that shows that
expansion of the company brought a rise in the opportunities for candidates.
Rise in prices: - there is a rise in the inflation of the country which shows that the prices
of the products are increasing due to which the phase of the country is expansion.
Economic growth: - Australia’s economy is growing year by year which shows that there
are many new businesses are contributing to the growth of the economy of the country.
Moreover, considering the current yield curve of the company it has been found there is
rise. Current yield is a bond’s annual return based on its annual coupon payment and
price. The Australia yield curve for 2018 is given below which support the expansion
phase of the country (World Government Bonds (2018).
Australia Yield Curve- 2nd April 2018 (Australian Government bonds)
Business 5
Resid
ual
matu
rity
2
Years 4
years 6
Years 8
years 10
years 12
years 15
years 20
years 30
years
0.00%
0.50%
1.00%
1.50%
2.00%
2.50%
3.00%
3.50%
Series1
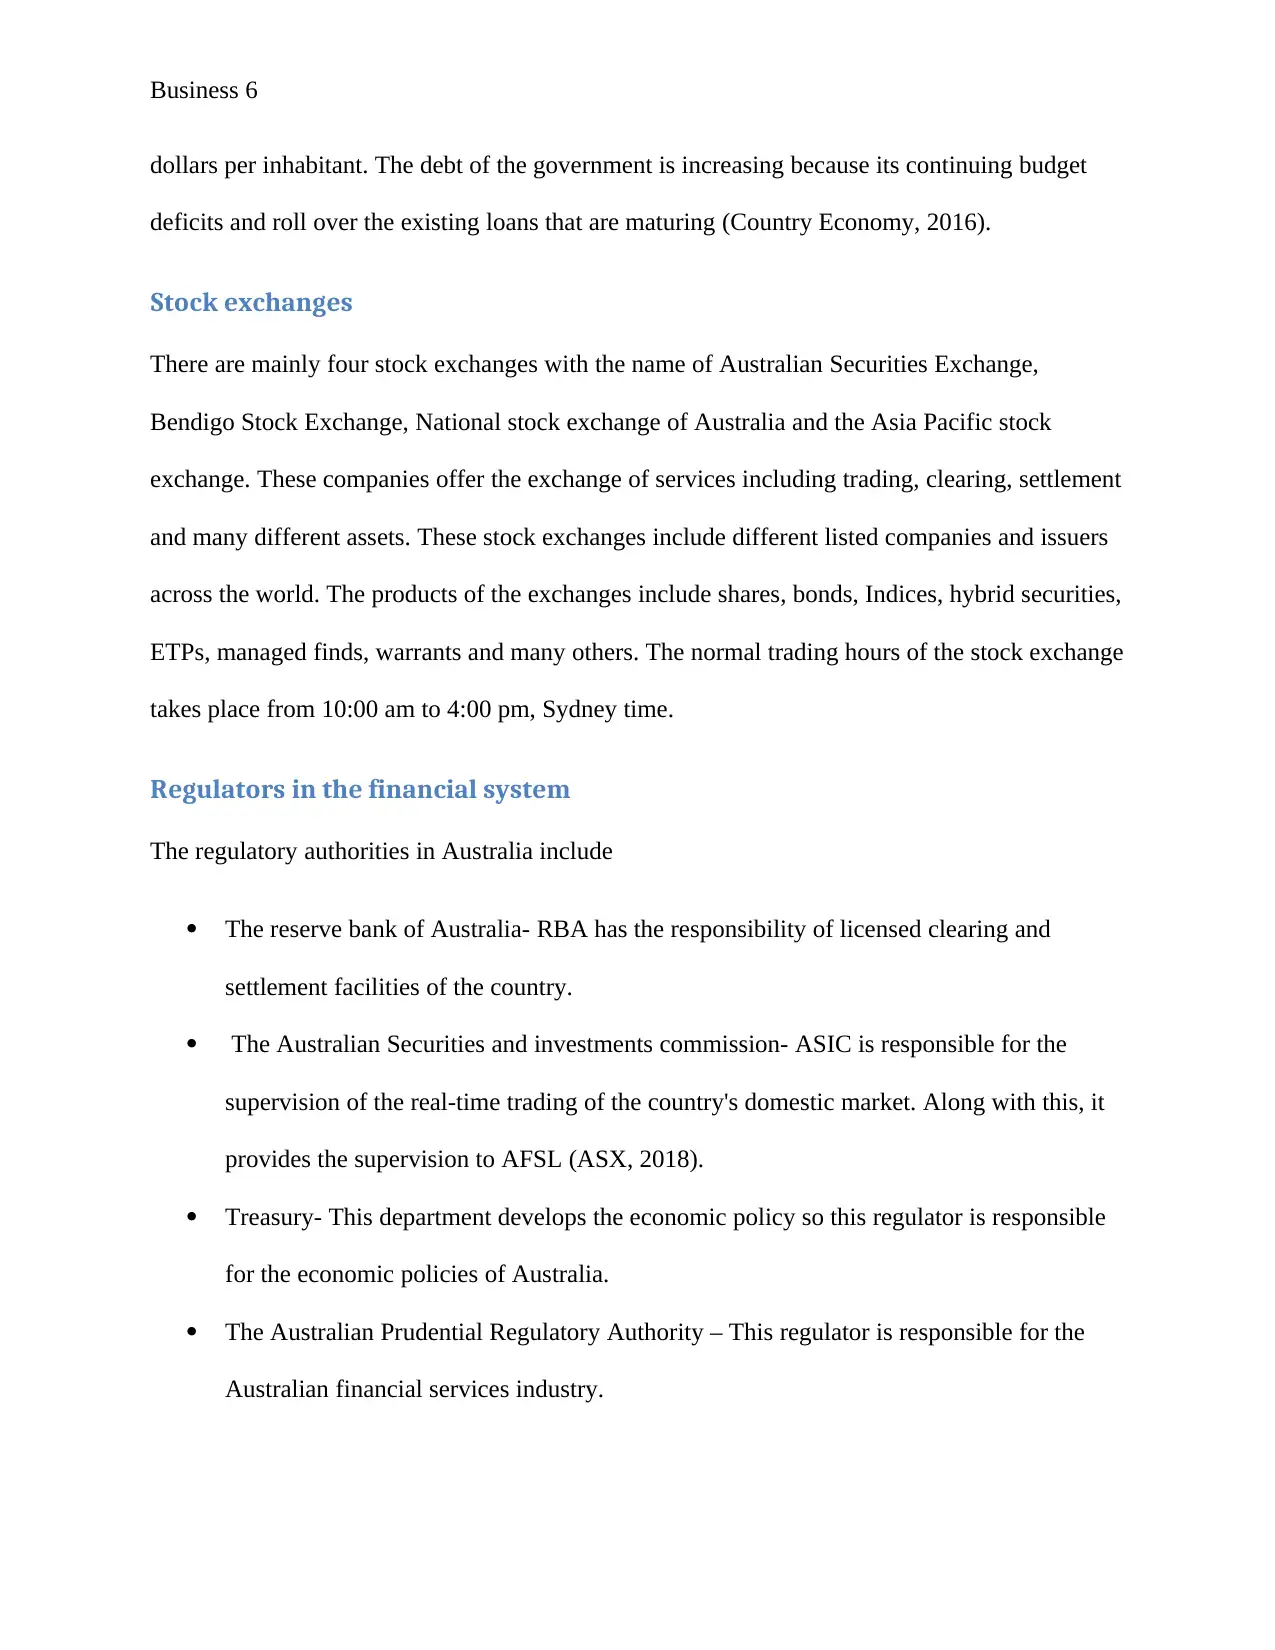
Overview of financial system
Currency
The Australian dollar is the currency of Australia. The code of the currency for the dollars is
AUD and the symbol is $. An Australian currency ranking shows that most of popular Australia
Dollar exchange rate is the USD to AUD rate. There are two common measures which are used
to measure the Australian dollar exchange rate that is bilateral exchange rate against US dollar
and TWI (Trade-weighted index). The credit rating agency Standard and Poor’s had maintained
Australia’s AAA credit rating with a stable outlook (Currency, 2018).
Government debt
Australia's net government debt as a percentage of GDP in the year 2016-17 budget was
predicted at 18.9% that is approx. $326.0 billion which is much lower than the other developed
countries. In the year 2016, the Australia public debt was 517,457 million dollars which have
been increased since 2015 by 51,730 million. According to the latest data, in 2016, it was 21,447
Resid
ual
matu
rity
2
Years 4
years 6
Years 8
years 10
years 12
years 15
years 20
years 30
years
0.00%
0.50%
1.00%
1.50%
2.00%
2.50%
3.00%
3.50%
Series1
Overview of financial system
Currency
The Australian dollar is the currency of Australia. The code of the currency for the dollars is
AUD and the symbol is $. An Australian currency ranking shows that most of popular Australia
Dollar exchange rate is the USD to AUD rate. There are two common measures which are used
to measure the Australian dollar exchange rate that is bilateral exchange rate against US dollar
and TWI (Trade-weighted index). The credit rating agency Standard and Poor’s had maintained
Australia’s AAA credit rating with a stable outlook (Currency, 2018).
Government debt
Australia's net government debt as a percentage of GDP in the year 2016-17 budget was
predicted at 18.9% that is approx. $326.0 billion which is much lower than the other developed
countries. In the year 2016, the Australia public debt was 517,457 million dollars which have
been increased since 2015 by 51,730 million. According to the latest data, in 2016, it was 21,447
⊘ This is a preview!⊘
Do you want full access?
Subscribe today to unlock all pages.
Trusted by 1+ million students worldwide
Business 6
dollars per inhabitant. The debt of the government is increasing because its continuing budget
deficits and roll over the existing loans that are maturing (Country Economy, 2016).
Stock exchanges
There are mainly four stock exchanges with the name of Australian Securities Exchange,
Bendigo Stock Exchange, National stock exchange of Australia and the Asia Pacific stock
exchange. These companies offer the exchange of services including trading, clearing, settlement
and many different assets. These stock exchanges include different listed companies and issuers
across the world. The products of the exchanges include shares, bonds, Indices, hybrid securities,
ETPs, managed finds, warrants and many others. The normal trading hours of the stock exchange
takes place from 10:00 am to 4:00 pm, Sydney time.
Regulators in the financial system
The regulatory authorities in Australia include
The reserve bank of Australia- RBA has the responsibility of licensed clearing and
settlement facilities of the country.
The Australian Securities and investments commission- ASIC is responsible for the
supervision of the real-time trading of the country's domestic market. Along with this, it
provides the supervision to AFSL (ASX, 2018).
Treasury- This department develops the economic policy so this regulator is responsible
for the economic policies of Australia.
The Australian Prudential Regulatory Authority – This regulator is responsible for the
Australian financial services industry.
Paraphrase This Document
Need a fresh take? Get an instant paraphrase of this document with our AI Paraphraser
Business 7
Council of financial regulators- CFR is the coordinating body for Australia's main
financial regulatory agencies. This regulator is responsible for the smooth financial
regulation and stability.
Size of capital markets in US $
The size of the capital market of the country can be reflected with the help of the Market
capitalization of the country that is 126.74 billion at present.
Size of Money markets in US$
The Size of the money market of Australia in US$ is expected to be 139, 80,000. The money
market of the industry has been volatile from the past five years but it has risen overall on the
back of stronger government debt securities over the period. Moreover, the industry revenue is
forecasted to rise at an annualized 2.5% over the 5 years (IBIS world, 2017).
Size of over the counter derivatives in the US$
The Australian OTC derivatives market is a comparatively small share of the global market with
the activity that mainly focuses on the Australian-dollar denominated contracts. In Australia,
most of the product class that is used include single-currency interest rate derivatives, cross-
currency swaps and the FX derivate (Reserve Bank of Australia, 2012).
Product examples
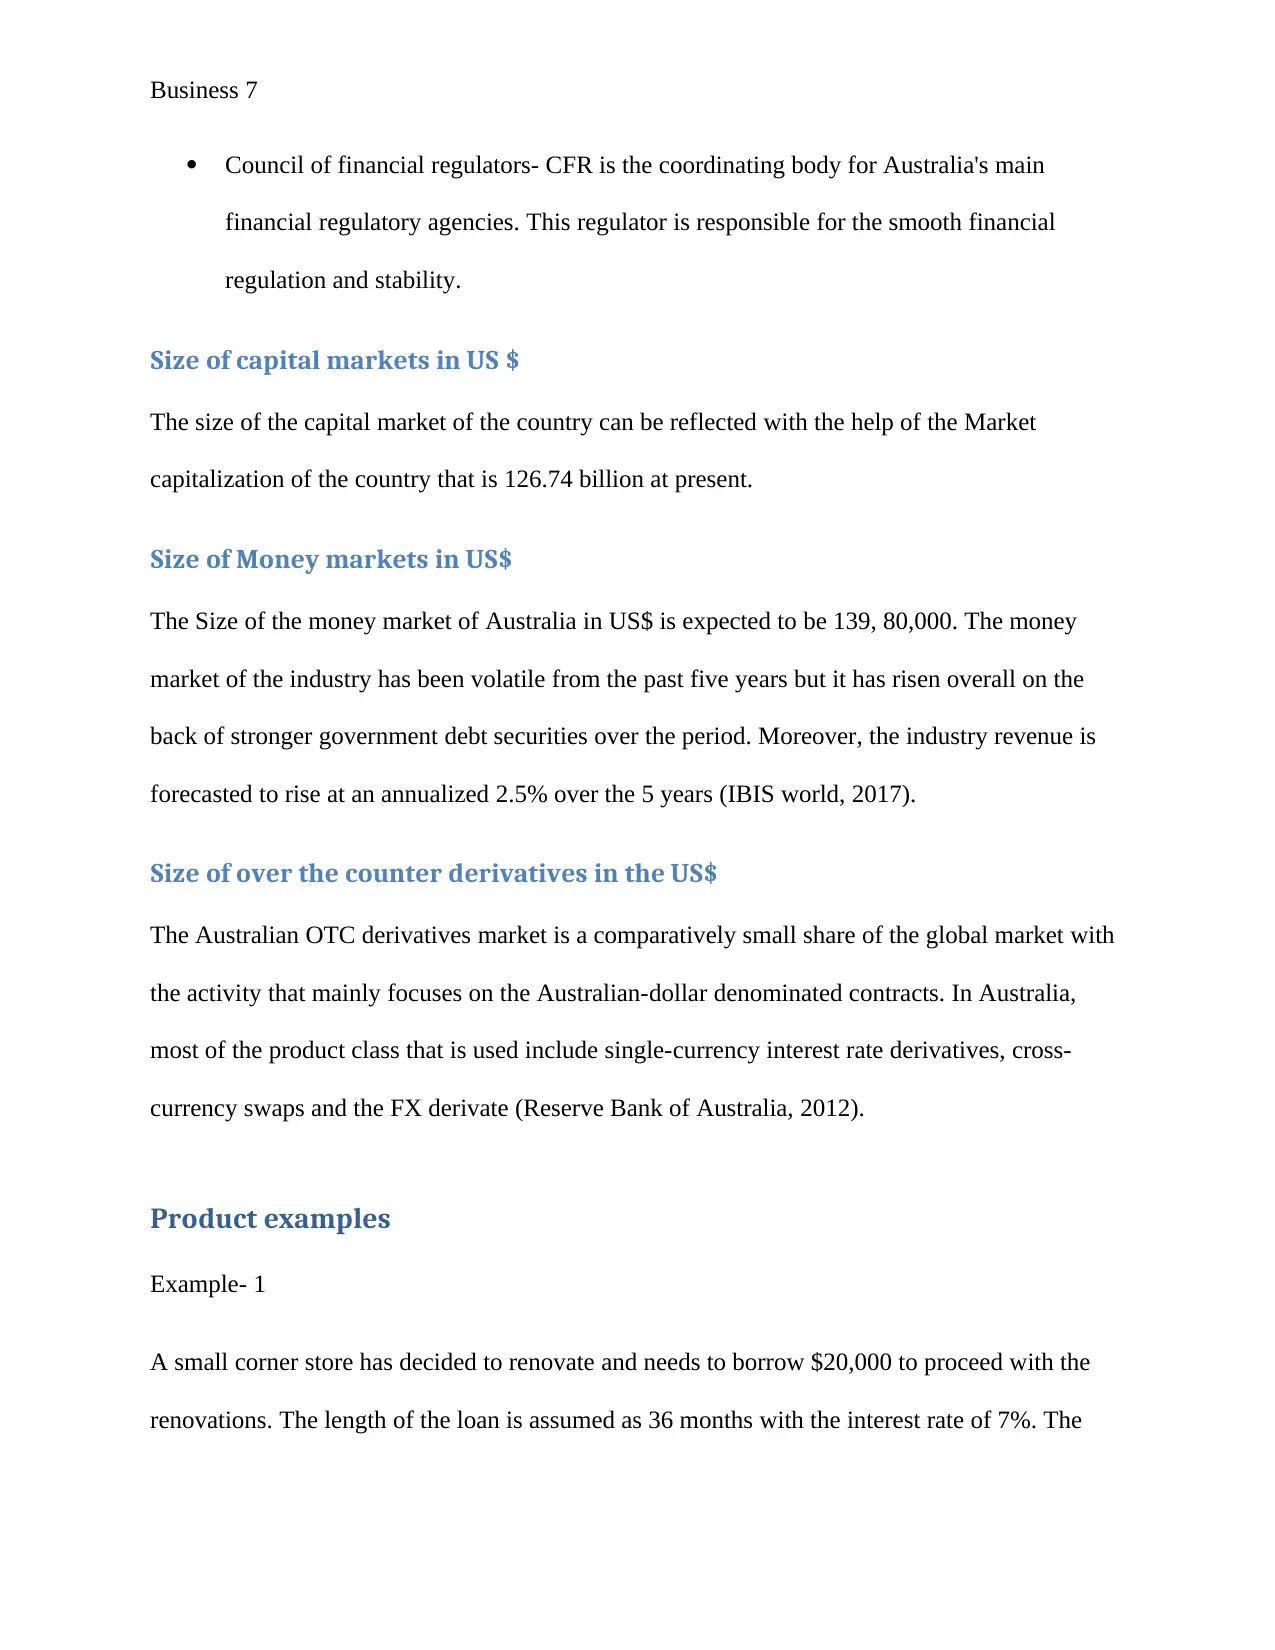
Example- 1
A small corner store has decided to renovate and needs to borrow $20,000 to proceed with the
renovations. The length of the loan is assumed as 36 months with the interest rate of 7%. The
Council of financial regulators- CFR is the coordinating body for Australia's main
financial regulatory agencies. This regulator is responsible for the smooth financial
regulation and stability.
Size of capital markets in US $
The size of the capital market of the country can be reflected with the help of the Market
capitalization of the country that is 126.74 billion at present.
Size of Money markets in US$
The Size of the money market of Australia in US$ is expected to be 139, 80,000. The money
market of the industry has been volatile from the past five years but it has risen overall on the
back of stronger government debt securities over the period. Moreover, the industry revenue is
forecasted to rise at an annualized 2.5% over the 5 years (IBIS world, 2017).
Size of over the counter derivatives in the US$
The Australian OTC derivatives market is a comparatively small share of the global market with
the activity that mainly focuses on the Australian-dollar denominated contracts. In Australia,
most of the product class that is used include single-currency interest rate derivatives, cross-
currency swaps and the FX derivate (Reserve Bank of Australia, 2012).
Product examples
Example- 1
A small corner store has decided to renovate and needs to borrow $20,000 to proceed with the
renovations. The length of the loan is assumed as 36 months with the interest rate of 7%. The
Business 8
owner can repay the loan the monthly installments. Below given calculation reflects the monthly
installment that the owner has to pay.
Loan Repayment
Principle 20,000 20,000
Rate 7% 0.07
length of loan 36 months 36
Monthly Payment =
P*[r(*1+r)^n/[(1+r)^
n-1)
1534.30
6
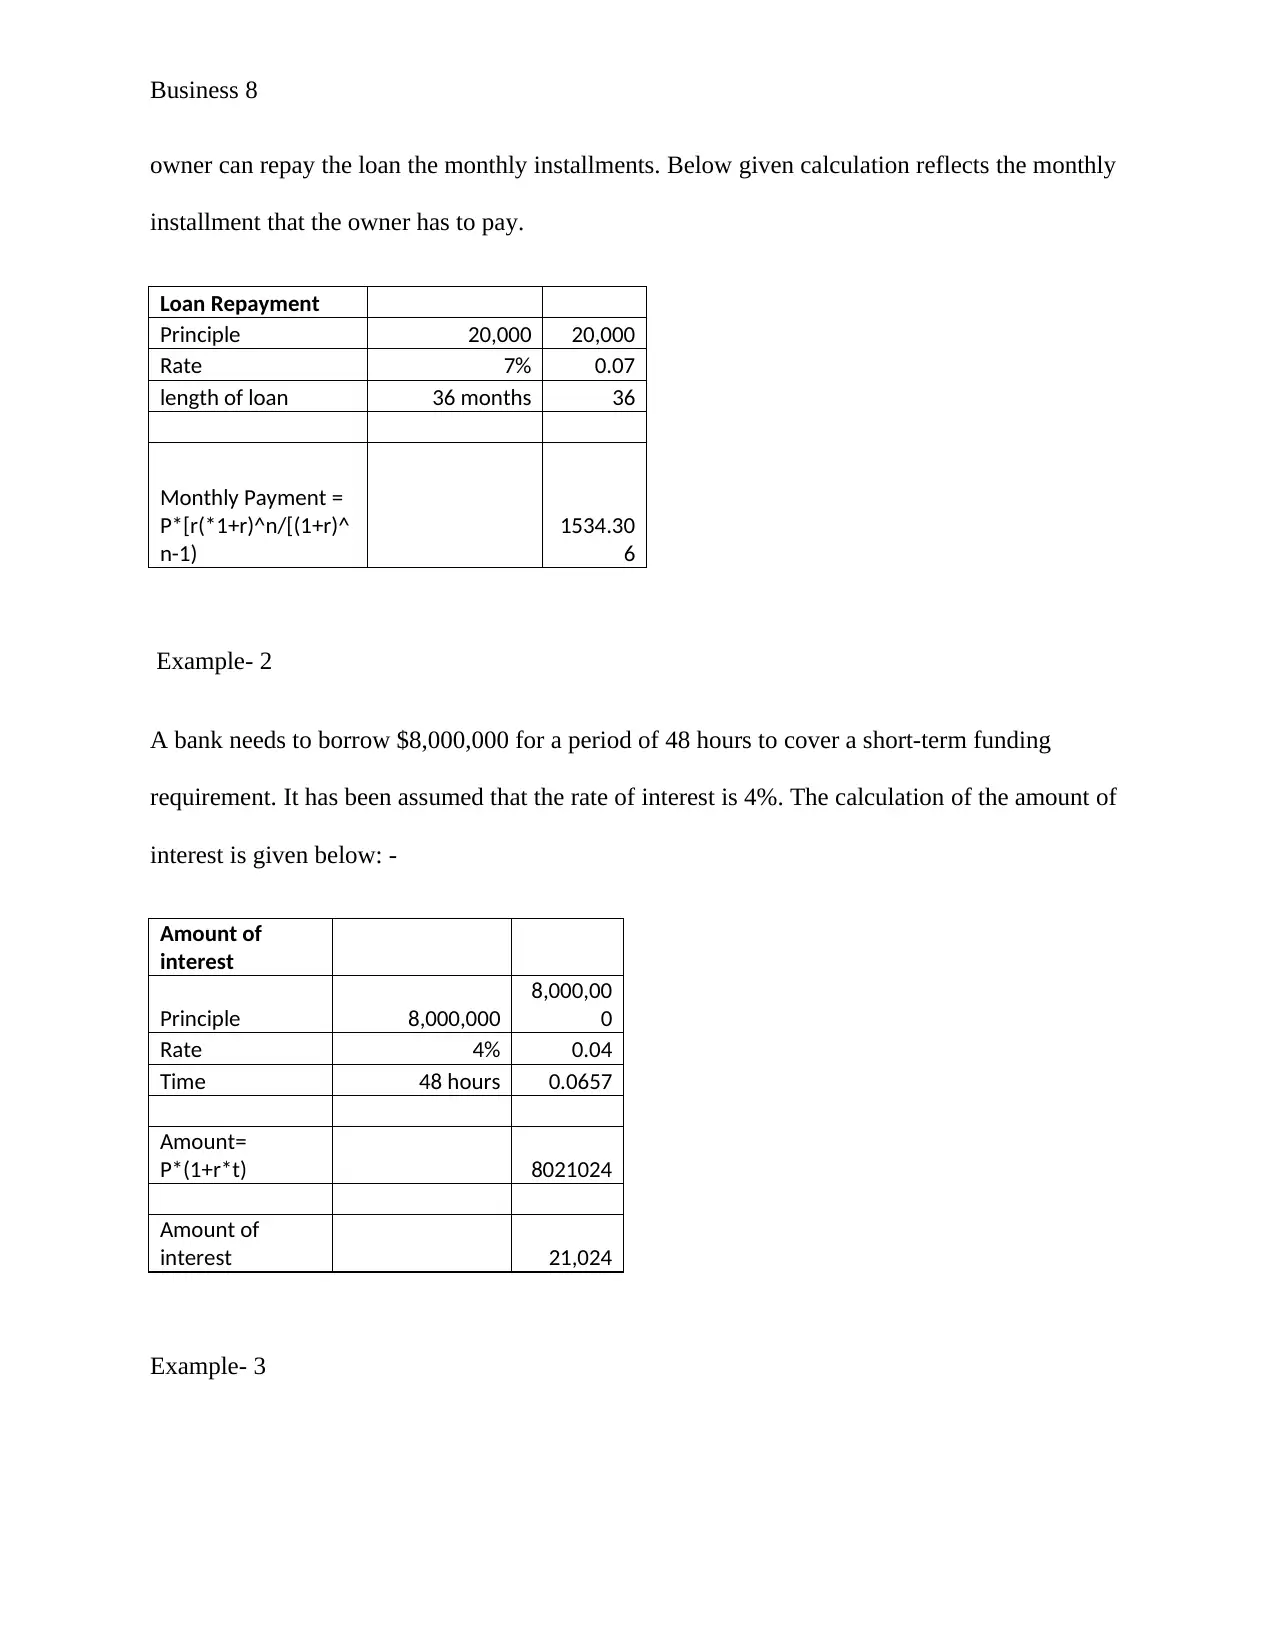
Example- 2
A bank needs to borrow $8,000,000 for a period of 48 hours to cover a short-term funding
requirement. It has been assumed that the rate of interest is 4%. The calculation of the amount of
interest is given below: -
Amount of
interest
Principle 8,000,000
8,000,00
0
Rate 4% 0.04
Time 48 hours 0.0657
Amount=
P*(1+r*t) 8021024
Amount of
interest 21,024
Example- 3
owner can repay the loan the monthly installments. Below given calculation reflects the monthly
installment that the owner has to pay.
Loan Repayment
Principle 20,000 20,000
Rate 7% 0.07
length of loan 36 months 36
Monthly Payment =
P*[r(*1+r)^n/[(1+r)^
n-1)
1534.30
6
Example- 2
A bank needs to borrow $8,000,000 for a period of 48 hours to cover a short-term funding
requirement. It has been assumed that the rate of interest is 4%. The calculation of the amount of
interest is given below: -
Amount of
interest
Principle 8,000,000
8,000,00
0
Rate 4% 0.04
Time 48 hours 0.0657
Amount=
P*(1+r*t) 8021024
Amount of
interest 21,024
Example- 3
⊘ This is a preview!⊘
Do you want full access?
Subscribe today to unlock all pages.
Trusted by 1+ million students worldwide
Business 9
The government needs to a fund a budget deficit at times when they find very crucial condition.
In the budget deficit, the expenditure exceeds the revenue that is collected through taxes and
non-tax revenue. At that point in time, the government can try to cut back on their expenditure or
can increase the revenue of the country by generating business activities. In addition, the product
can be borrowing the amount from the market or from the reserve bank of Australia. When the
government borrows the amount then they have to pay the interest which means they have to
again get involved in the expenditure.
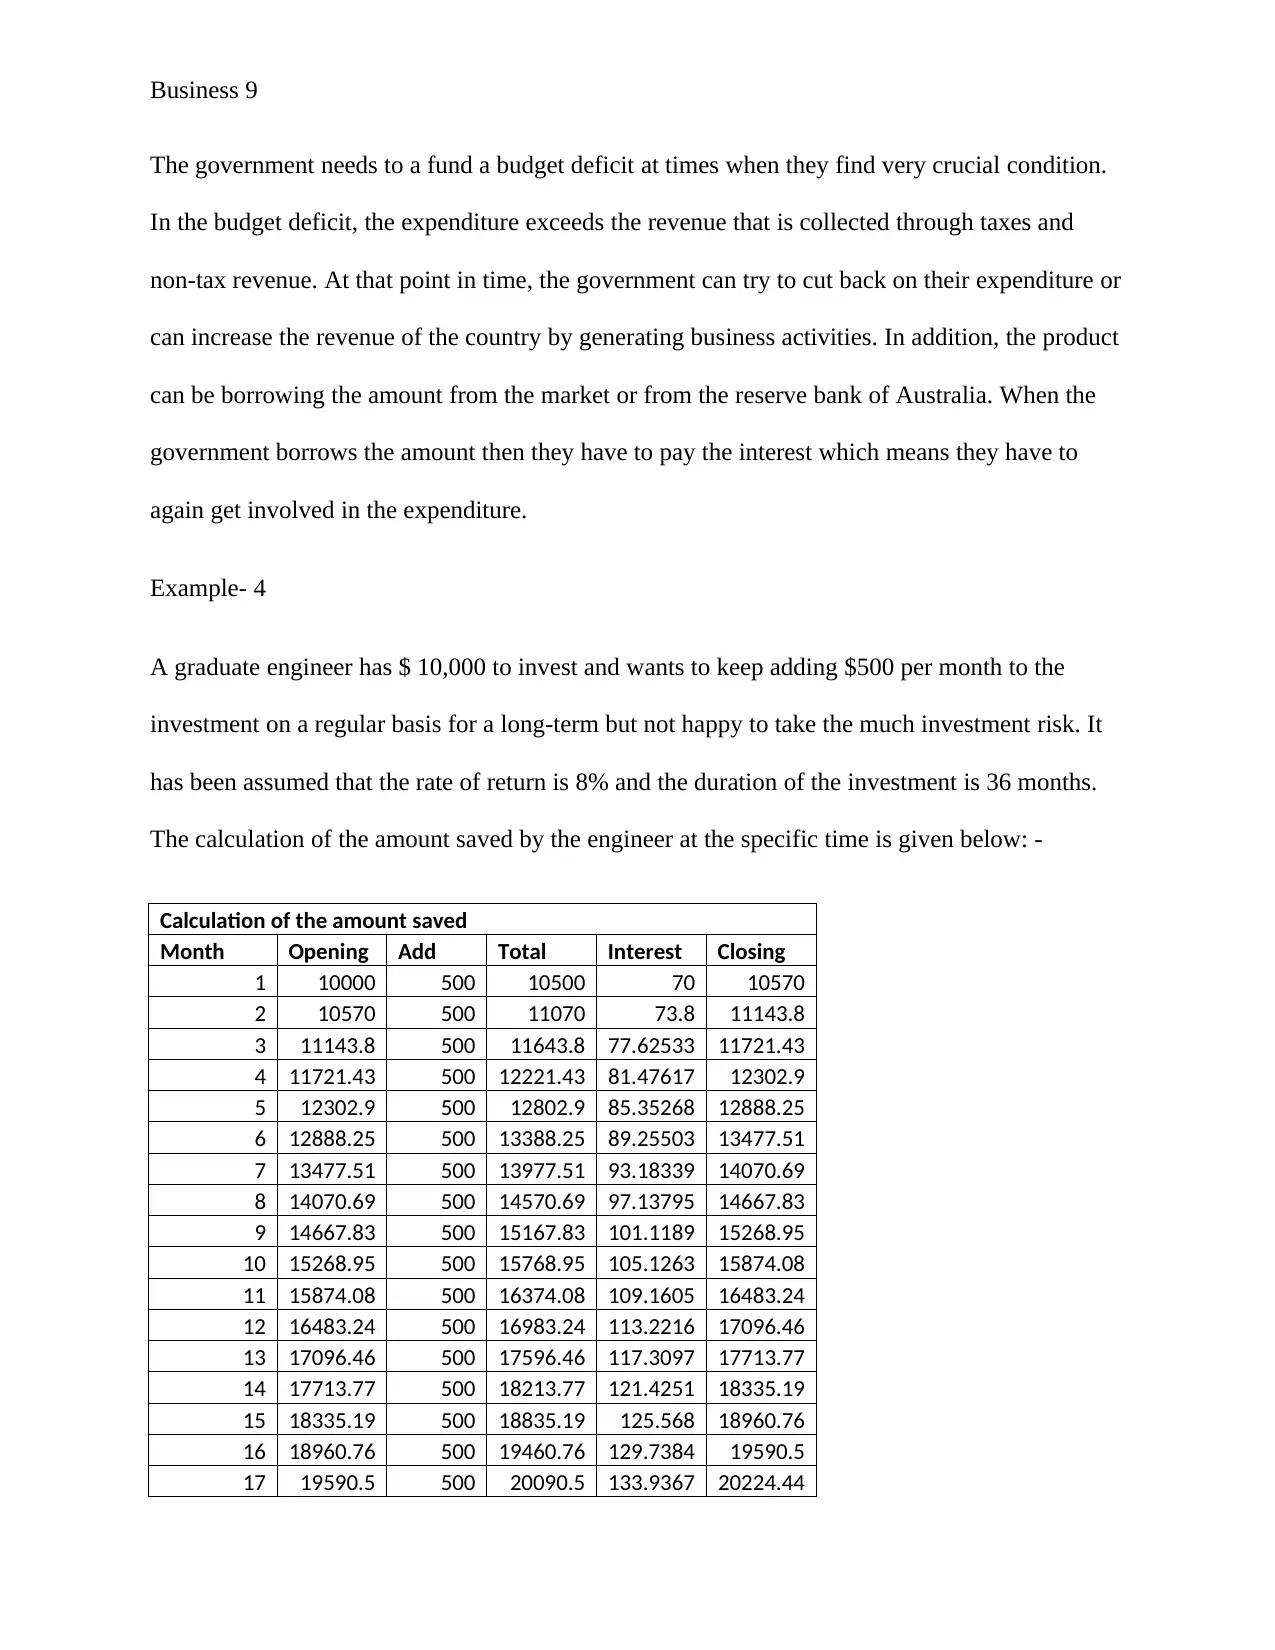
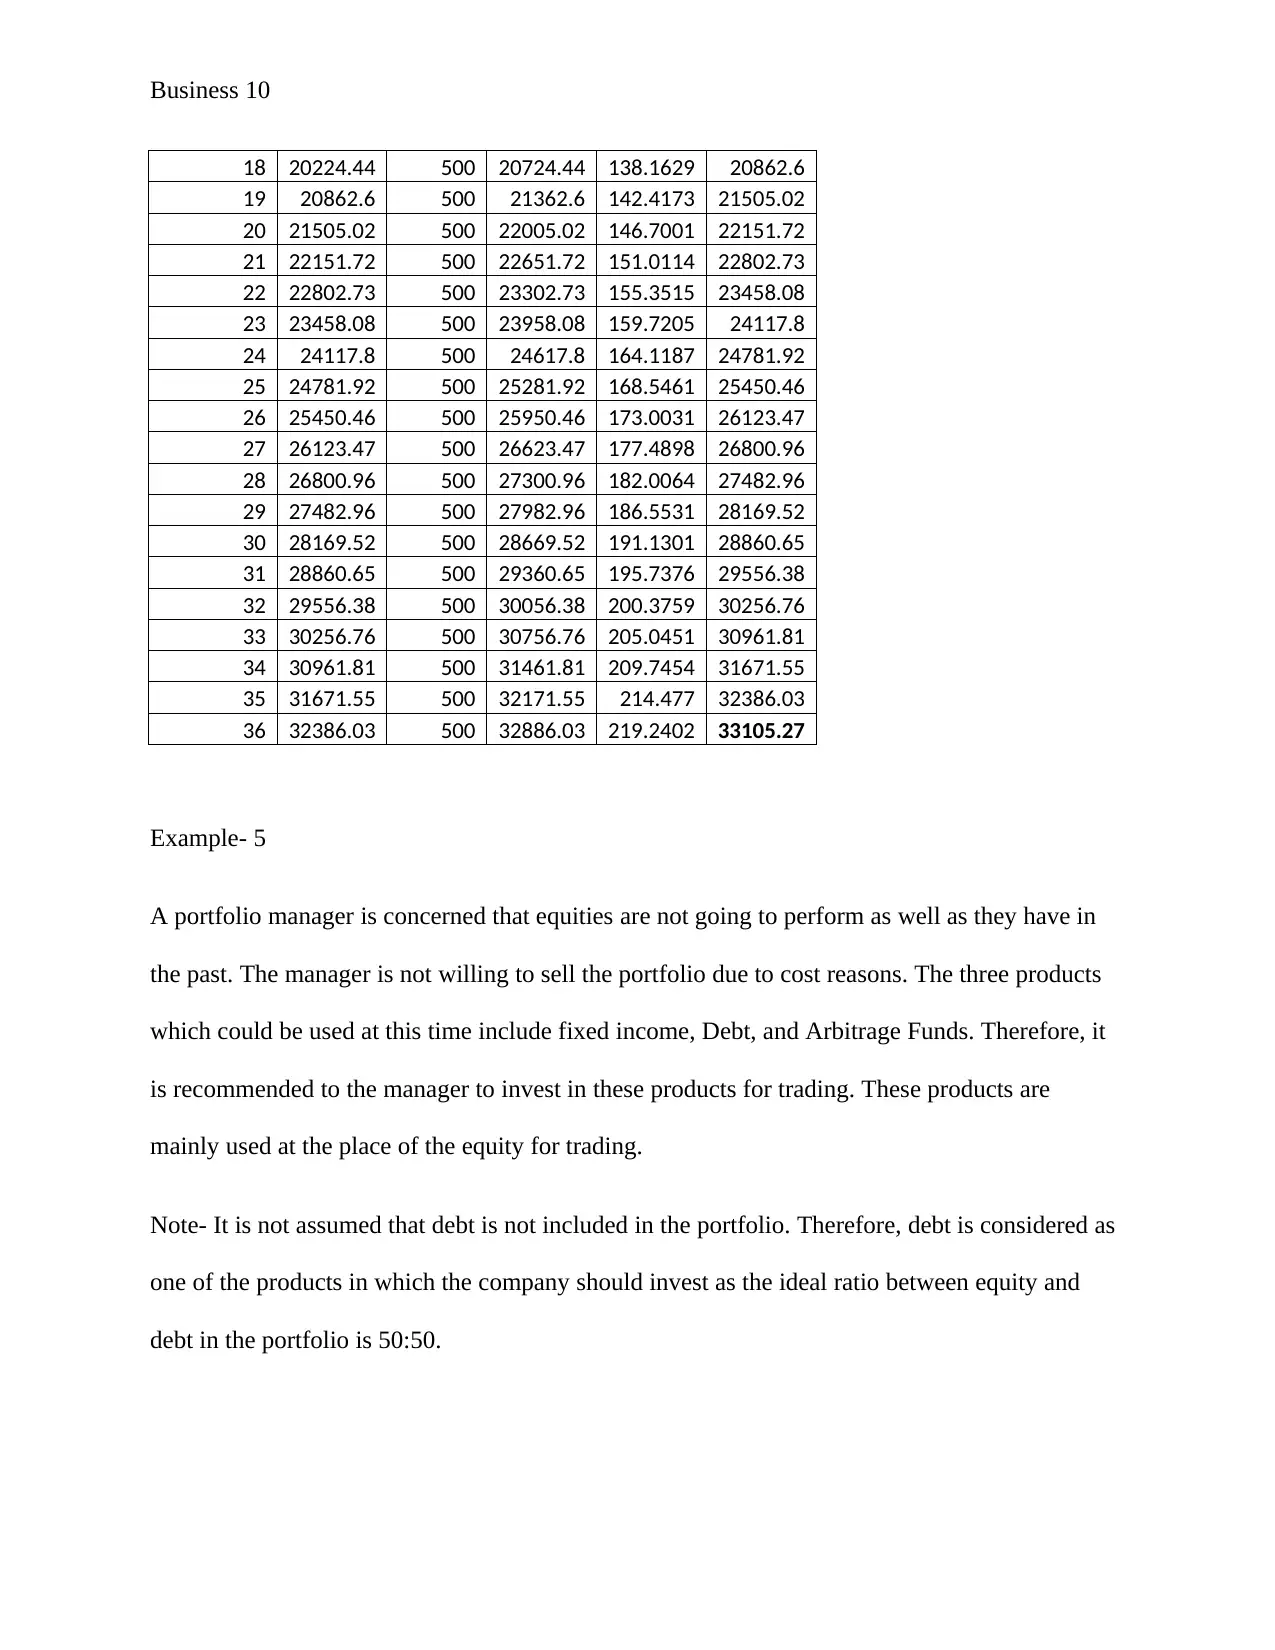
Example- 4
A graduate engineer has $ 10,000 to invest and wants to keep adding $500 per month to the
investment on a regular basis for a long-term but not happy to take the much investment risk. It
has been assumed that the rate of return is 8% and the duration of the investment is 36 months.
The calculation of the amount saved by the engineer at the specific time is given below: -
Calculation of the amount saved
Month Opening Add Total Interest Closing
1 10000 500 10500 70 10570
2 10570 500 11070 73.8 11143.8
3 11143.8 500 11643.8 77.62533 11721.43
4 11721.43 500 12221.43 81.47617 12302.9
5 12302.9 500 12802.9 85.35268 12888.25
6 12888.25 500 13388.25 89.25503 13477.51
7 13477.51 500 13977.51 93.18339 14070.69
8 14070.69 500 14570.69 97.13795 14667.83
9 14667.83 500 15167.83 101.1189 15268.95
10 15268.95 500 15768.95 105.1263 15874.08
11 15874.08 500 16374.08 109.1605 16483.24
12 16483.24 500 16983.24 113.2216 17096.46
13 17096.46 500 17596.46 117.3097 17713.77
14 17713.77 500 18213.77 121.4251 18335.19
15 18335.19 500 18835.19 125.568 18960.76
16 18960.76 500 19460.76 129.7384 19590.5
17 19590.5 500 20090.5 133.9367 20224.44
The government needs to a fund a budget deficit at times when they find very crucial condition.
In the budget deficit, the expenditure exceeds the revenue that is collected through taxes and
non-tax revenue. At that point in time, the government can try to cut back on their expenditure or
can increase the revenue of the country by generating business activities. In addition, the product
can be borrowing the amount from the market or from the reserve bank of Australia. When the
government borrows the amount then they have to pay the interest which means they have to
again get involved in the expenditure.
Example- 4
A graduate engineer has $ 10,000 to invest and wants to keep adding $500 per month to the
investment on a regular basis for a long-term but not happy to take the much investment risk. It
has been assumed that the rate of return is 8% and the duration of the investment is 36 months.
The calculation of the amount saved by the engineer at the specific time is given below: -
Calculation of the amount saved
Month Opening Add Total Interest Closing
1 10000 500 10500 70 10570
2 10570 500 11070 73.8 11143.8
3 11143.8 500 11643.8 77.62533 11721.43
4 11721.43 500 12221.43 81.47617 12302.9
5 12302.9 500 12802.9 85.35268 12888.25
6 12888.25 500 13388.25 89.25503 13477.51
7 13477.51 500 13977.51 93.18339 14070.69
8 14070.69 500 14570.69 97.13795 14667.83
9 14667.83 500 15167.83 101.1189 15268.95
10 15268.95 500 15768.95 105.1263 15874.08
11 15874.08 500 16374.08 109.1605 16483.24
12 16483.24 500 16983.24 113.2216 17096.46
13 17096.46 500 17596.46 117.3097 17713.77
14 17713.77 500 18213.77 121.4251 18335.19
15 18335.19 500 18835.19 125.568 18960.76
16 18960.76 500 19460.76 129.7384 19590.5
17 19590.5 500 20090.5 133.9367 20224.44
Paraphrase This Document
Need a fresh take? Get an instant paraphrase of this document with our AI Paraphraser
Business 10
18 20224.44 500 20724.44 138.1629 20862.6
19 20862.6 500 21362.6 142.4173 21505.02
20 21505.02 500 22005.02 146.7001 22151.72
21 22151.72 500 22651.72 151.0114 22802.73
22 22802.73 500 23302.73 155.3515 23458.08
23 23458.08 500 23958.08 159.7205 24117.8
24 24117.8 500 24617.8 164.1187 24781.92
25 24781.92 500 25281.92 168.5461 25450.46
26 25450.46 500 25950.46 173.0031 26123.47
27 26123.47 500 26623.47 177.4898 26800.96
28 26800.96 500 27300.96 182.0064 27482.96
29 27482.96 500 27982.96 186.5531 28169.52
30 28169.52 500 28669.52 191.1301 28860.65
31 28860.65 500 29360.65 195.7376 29556.38
32 29556.38 500 30056.38 200.3759 30256.76
33 30256.76 500 30756.76 205.0451 30961.81
34 30961.81 500 31461.81 209.7454 31671.55
35 31671.55 500 32171.55 214.477 32386.03
36 32386.03 500 32886.03 219.2402 33105.27
Example- 5
A portfolio manager is concerned that equities are not going to perform as well as they have in
the past. The manager is not willing to sell the portfolio due to cost reasons. The three products
which could be used at this time include fixed income, Debt, and Arbitrage Funds. Therefore, it
is recommended to the manager to invest in these products for trading. These products are
mainly used at the place of the equity for trading.
Note- It is not assumed that debt is not included in the portfolio. Therefore, debt is considered as
one of the products in which the company should invest as the ideal ratio between equity and
debt in the portfolio is 50:50.
Business 11
Market risk
Market risk and specific risk are the two different forms of the risk that can create an impact on
the assets. The market risk is the option of an investor exercising losses because of the factors
that can impact the overall performance of the financial market. On the other hand, the specific
risk is the possibility of losing an investment due to industry or company specific hazard.
In the Australian market, these risks are faced by many of the companies, investors, and other
people. The Australian property investor faces the market risk many times while purchasing the
properties. The investors might diversify the market risk to a partial extent when they find that
the wider property market crashes as diversification is unlikely to assuage the market risk
successfully. It is recommended that the property investors should additionally invest the amount
in the other assets classes that tend to move in a non-correlated manner to real estate. Moreover,
the property investors can also focus on longer investment time horizon that allows correcting
markets greater opportunity to cover (Wargent, 2018).
The equity investors and fund manager discuss more the specific or business risk as these risks
are related to the stock or security. Most of the business in the Australia who deals in the same
industry faces the business risk. Issuers of stocks or bonds might not be able to make the
payment of interest or might become insolvent. Specific risk for the investors of Australia is
different and rather related to the risk of acquiring a loss-making property.
⊘ This is a preview!⊘
Do you want full access?
Subscribe today to unlock all pages.
Trusted by 1+ million students worldwide
1 out of 14
Related Documents


Your All-in-One AI-Powered Toolkit for Academic Success.
+13062052269
info@desklib.com
Available 24*7 on WhatsApp / Email
![[object Object]](/_next/static/media/star-bottom.7253800d.svg)
Unlock your academic potential
Copyright © 2020–2026 A2Z Services. All Rights Reserved. Developed and managed by ZUCOL.