Analysing Australia's Economic Growth & Macroeconomic Factors Essay
VerifiedAdded on 2023/06/11
|12
|2987
|337
Essay
AI Summary
This essay analyses Australia's economic growth path from 2005 to 2014, examining macroeconomic parameters such as real GDP, real GDP growth rate, inflation, and unemployment. It highlights Australia's transformation from a mining-based to a tertiary sector-based economy, noting its stability and ability to withstand market challenges. The essay discusses the impact of the Global Financial Crisis (GFC) and government reforms aimed at managing unemployment and inflation. Furthermore, it explores the performance of the production sector, labour market dynamics, and price level analysis, concluding with a forecast for the future of the Australian economy based on the findings.
Running head: ECONOMICS ASSIGNMENT
Economics Assignment
Name of the student:
Name of the University:
Author note
Economics Assignment
Name of the student:
Name of the University:
Author note
Paraphrase This Document
Need a fresh take? Get an instant paraphrase of this document with our AI Paraphraser
2ECONOMICS ASSIGNMENT
Introduction:
Among many mixed economies around the world, Australia is one of the largest one
which is going through transformation through the last two and half decades. Considering the
case of the various macroeconomic parameters of the state it can be argued that economy of
Australia has been moving forward at a speedy frequency and in present date, Australian
economy is one of the most stable economies around the world. Australia during the present
date has been going through its 27th consecutive year of growth that has been started since the
1990s with the transformation of the economy from a mining based economy to the tertiary
sector based economy (Downes et al., 2014). Considering the nominal Gross Domestic
Product (GDP), it can be seen that Australia stands 19th and as per the PPP model, rank of the
economy is 14th showcasing the stability and the size of the economy (Rees et al., 2016).
Considering the growth path of the Australian economy, it can be seen that, with the fall in
the export of the coal in the international market, growth of the Australian economy has been
hampered to some extent, however, it has good amount of stability and ability to sustain the
market crunches. With the substantial amount of job creation and labour force participation,
Australian economy during the last one decade has moved forward by a large extent. In
addition to this, latest exploration of the tech metals and the energy resources in the
Australian mines has been aiding the economy to leap bound its growth.
Under this scenario, this essay is aimed to describe the Australian growth path during
the last one decade ranging from 2005 to 2014. In addition to this, this essay will portray the
various government reformation in order to gauge the unemployment and inflation rate of the
economy during the same period (Rahman & Mamun, 2016). Moving forward, the essay is
aimed to put light on the various macroeconomic factors like real GDP, real GDP growth
rate, inflation and unemployment in order to forecast the future of the Australian economy
and to conclude, the essay will provide a summarised synopsis of the findings..
3ECONOMICS ASSIGNMENT
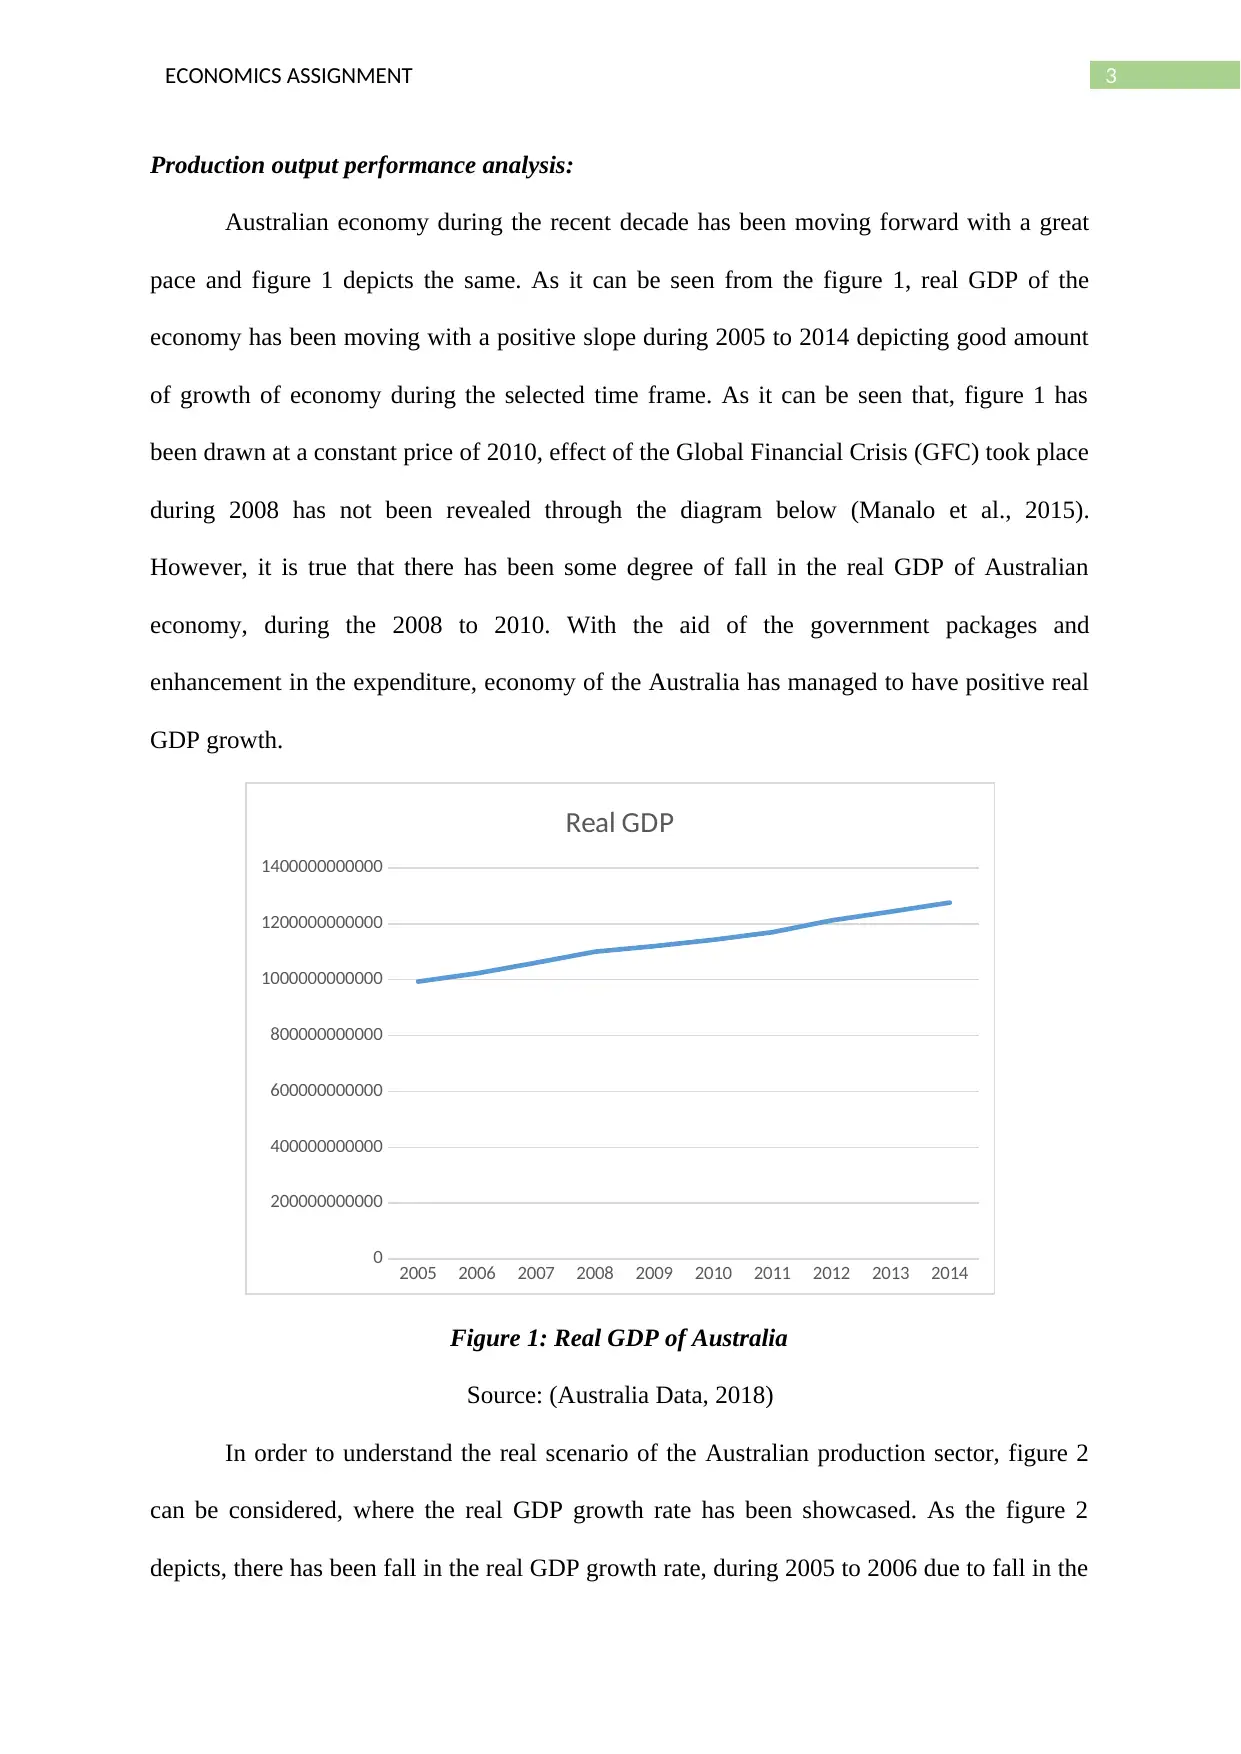
Production output performance analysis:
Australian economy during the recent decade has been moving forward with a great
pace and figure 1 depicts the same. As it can be seen from the figure 1, real GDP of the
economy has been moving with a positive slope during 2005 to 2014 depicting good amount
of growth of economy during the selected time frame. As it can be seen that, figure 1 has
been drawn at a constant price of 2010, effect of the Global Financial Crisis (GFC) took place
during 2008 has not been revealed through the diagram below (Manalo et al., 2015).
However, it is true that there has been some degree of fall in the real GDP of Australian
economy, during the 2008 to 2010. With the aid of the government packages and
enhancement in the expenditure, economy of the Australia has managed to have positive real
GDP growth.
2005 2006 2007 2008 2009 2010 2011 2012 2013 2014
0
200000000000
400000000000
600000000000
800000000000
1000000000000
1200000000000
1400000000000
Real GDP
Figure 1: Real GDP of Australia
Source: (Australia Data, 2018)
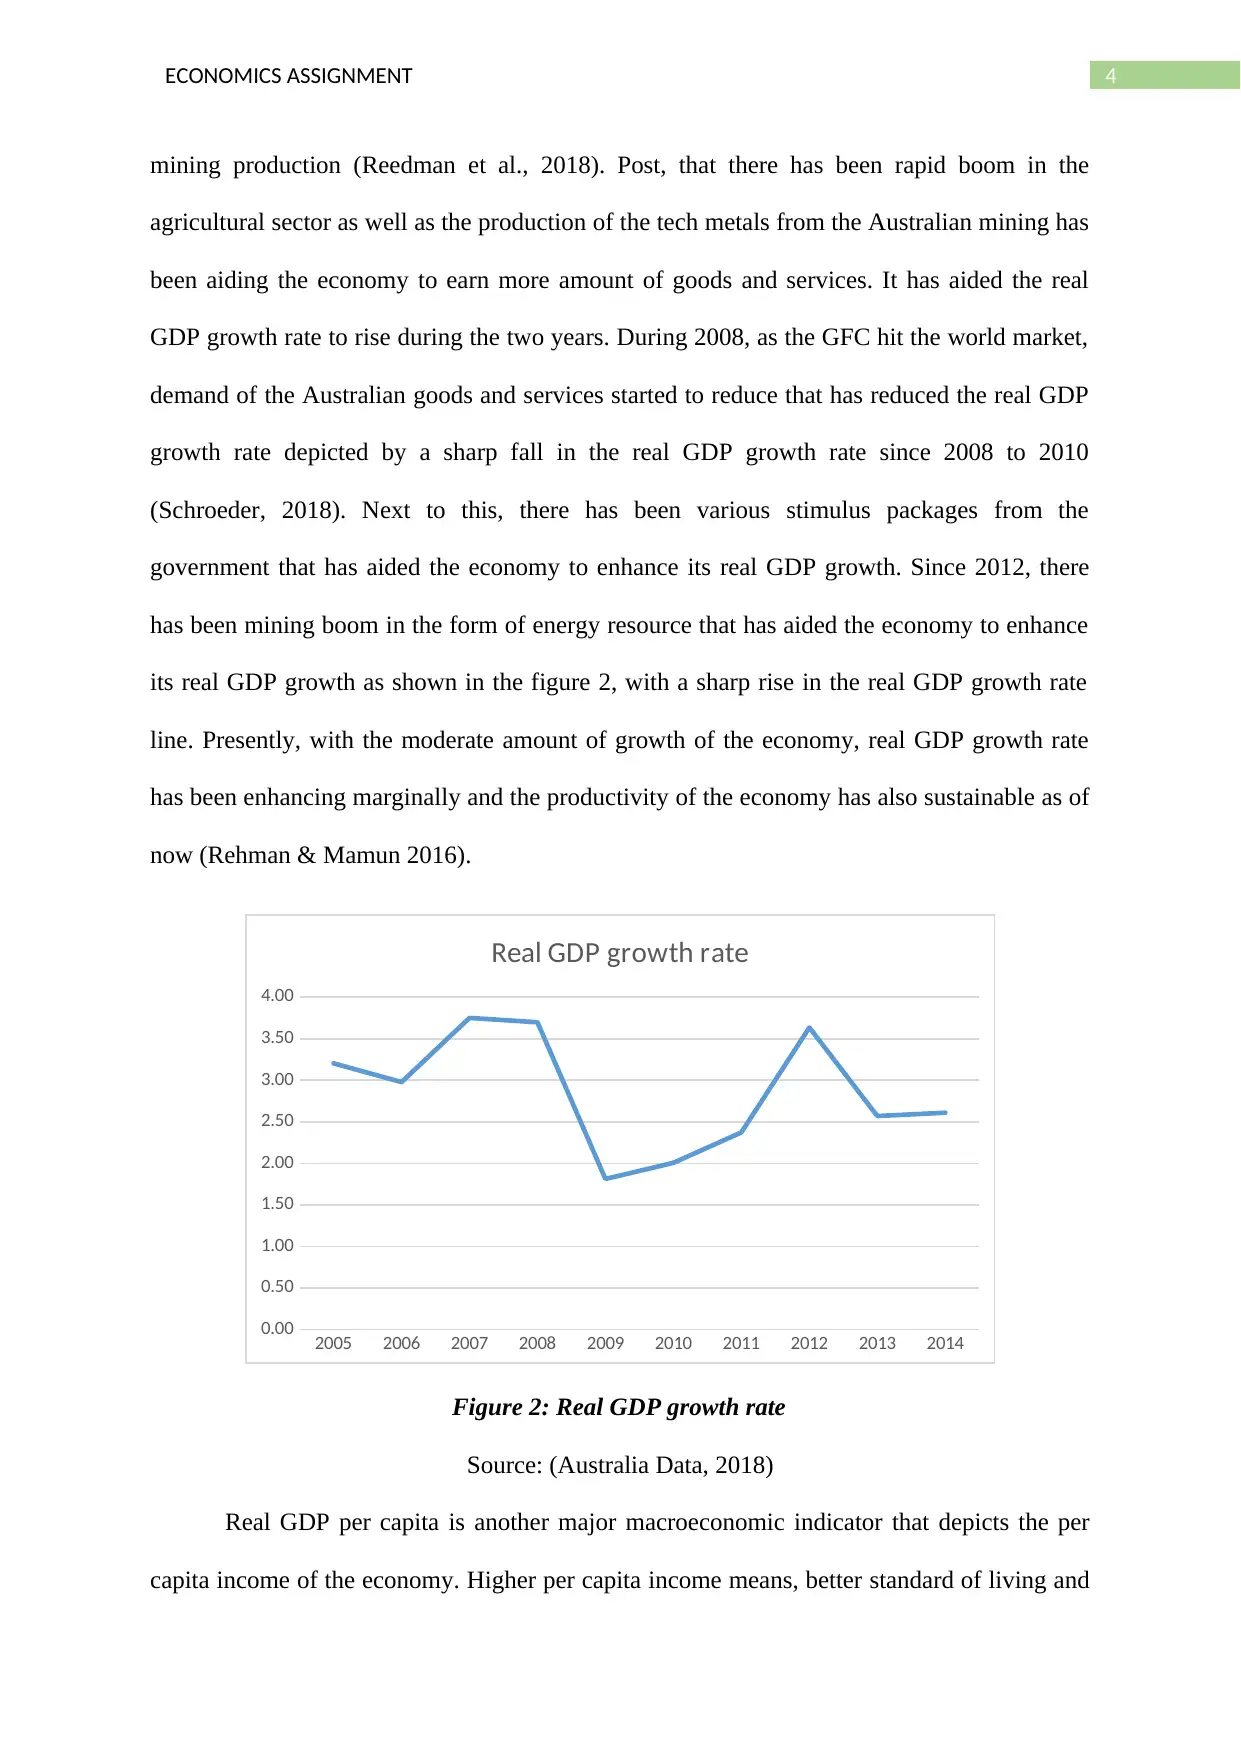
In order to understand the real scenario of the Australian production sector, figure 2
can be considered, where the real GDP growth rate has been showcased. As the figure 2
depicts, there has been fall in the real GDP growth rate, during 2005 to 2006 due to fall in the
Production output performance analysis:
Australian economy during the recent decade has been moving forward with a great
pace and figure 1 depicts the same. As it can be seen from the figure 1, real GDP of the
economy has been moving with a positive slope during 2005 to 2014 depicting good amount
of growth of economy during the selected time frame. As it can be seen that, figure 1 has
been drawn at a constant price of 2010, effect of the Global Financial Crisis (GFC) took place
during 2008 has not been revealed through the diagram below (Manalo et al., 2015).
However, it is true that there has been some degree of fall in the real GDP of Australian
economy, during the 2008 to 2010. With the aid of the government packages and
enhancement in the expenditure, economy of the Australia has managed to have positive real
GDP growth.
2005 2006 2007 2008 2009 2010 2011 2012 2013 2014
0
200000000000
400000000000
600000000000
800000000000
1000000000000
1200000000000
1400000000000
Real GDP
Figure 1: Real GDP of Australia
Source: (Australia Data, 2018)
In order to understand the real scenario of the Australian production sector, figure 2
can be considered, where the real GDP growth rate has been showcased. As the figure 2
depicts, there has been fall in the real GDP growth rate, during 2005 to 2006 due to fall in the
⊘ This is a preview!⊘
Do you want full access?
Subscribe today to unlock all pages.
Trusted by 1+ million students worldwide
4ECONOMICS ASSIGNMENT
mining production (Reedman et al., 2018). Post, that there has been rapid boom in the
agricultural sector as well as the production of the tech metals from the Australian mining has
been aiding the economy to earn more amount of goods and services. It has aided the real
GDP growth rate to rise during the two years. During 2008, as the GFC hit the world market,
demand of the Australian goods and services started to reduce that has reduced the real GDP
growth rate depicted by a sharp fall in the real GDP growth rate since 2008 to 2010
(Schroeder, 2018). Next to this, there has been various stimulus packages from the
government that has aided the economy to enhance its real GDP growth. Since 2012, there
has been mining boom in the form of energy resource that has aided the economy to enhance
its real GDP growth as shown in the figure 2, with a sharp rise in the real GDP growth rate
line. Presently, with the moderate amount of growth of the economy, real GDP growth rate
has been enhancing marginally and the productivity of the economy has also sustainable as of
now (Rehman & Mamun 2016).
2005 2006 2007 2008 2009 2010 2011 2012 2013 2014
0.00
0.50
1.00
1.50
2.00
2.50
3.00
3.50
4.00
Real GDP growth rate
Figure 2: Real GDP growth rate
Source: (Australia Data, 2018)
Real GDP per capita is another major macroeconomic indicator that depicts the per
capita income of the economy. Higher per capita income means, better standard of living and
Paraphrase This Document
Need a fresh take? Get an instant paraphrase of this document with our AI Paraphraser
5ECONOMICS ASSIGNMENT
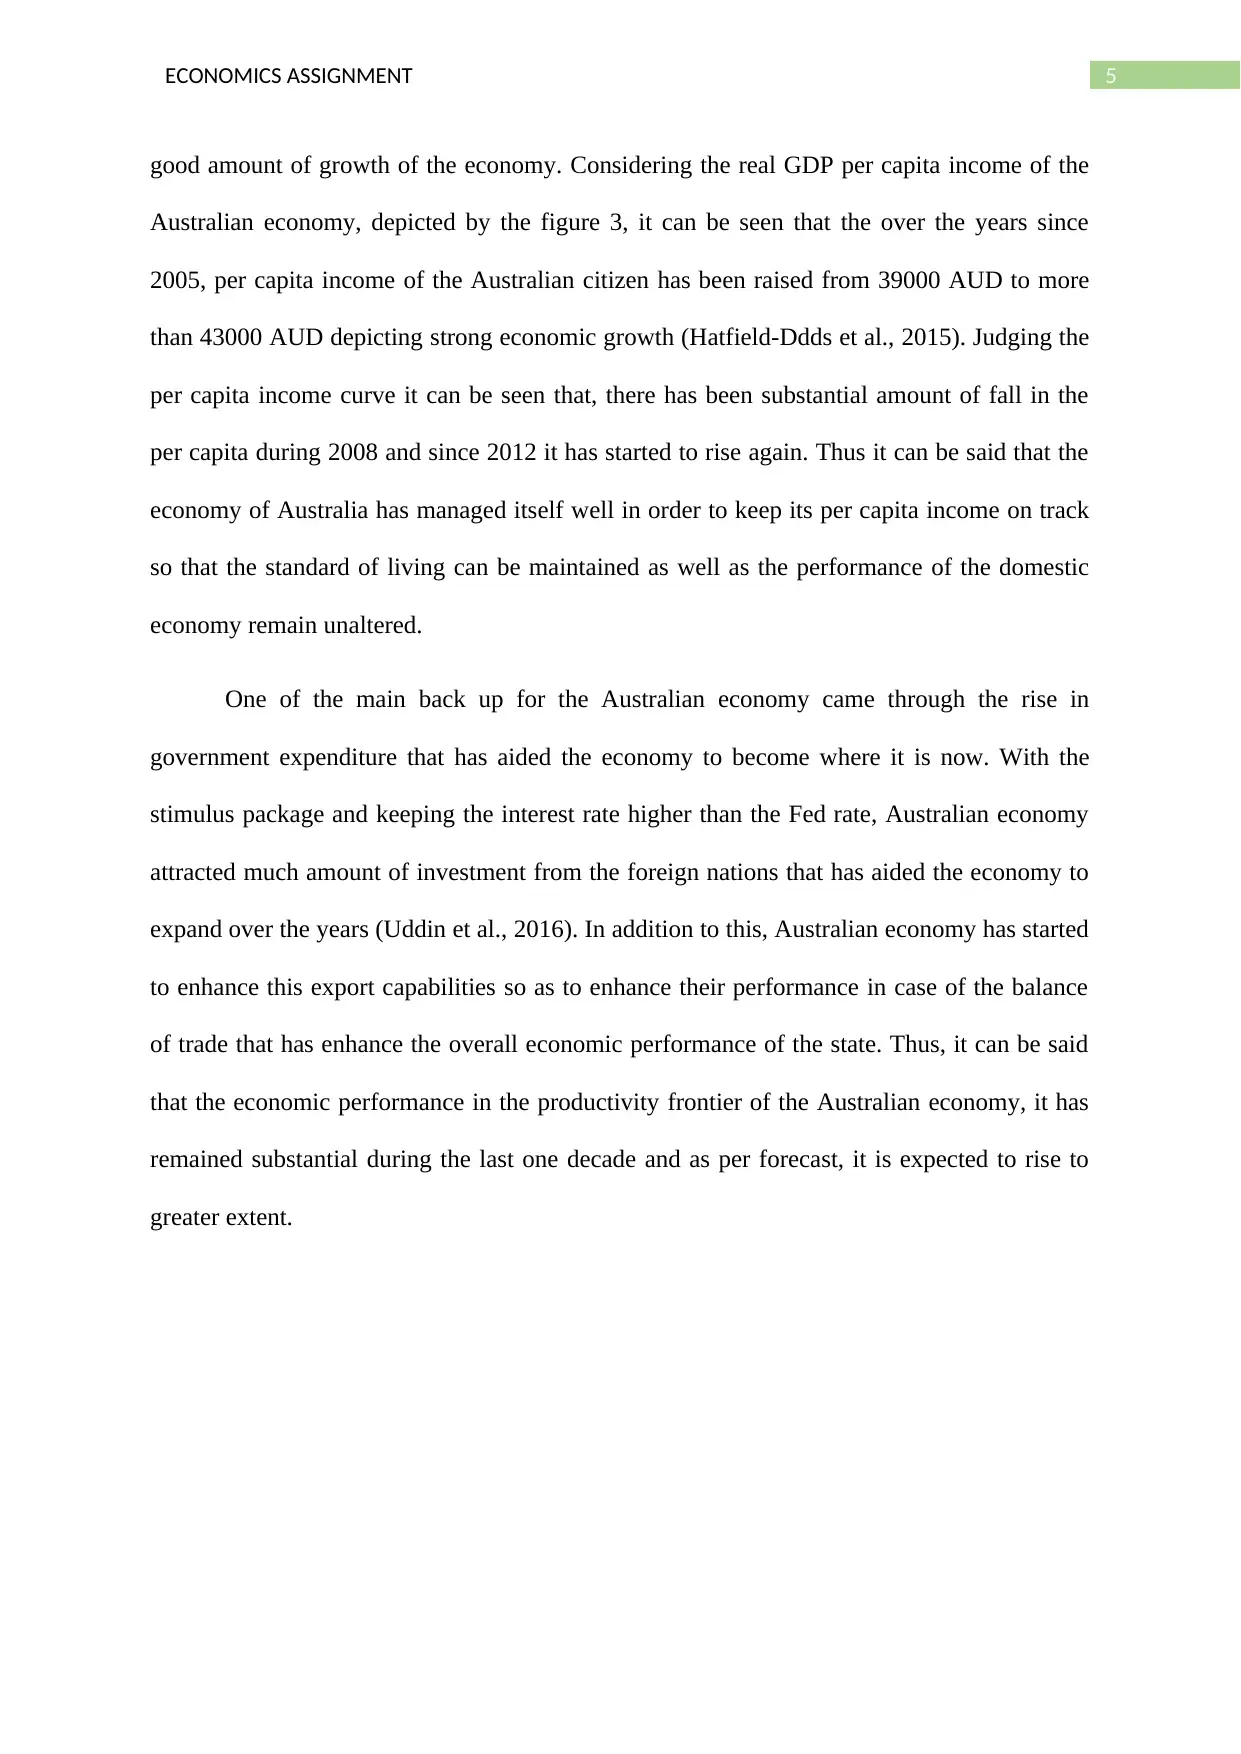
good amount of growth of the economy. Considering the real GDP per capita income of the
Australian economy, depicted by the figure 3, it can be seen that the over the years since
2005, per capita income of the Australian citizen has been raised from 39000 AUD to more
than 43000 AUD depicting strong economic growth (Hatfield-Ddds et al., 2015). Judging the
per capita income curve it can be seen that, there has been substantial amount of fall in the
per capita during 2008 and since 2012 it has started to rise again. Thus it can be said that the
economy of Australia has managed itself well in order to keep its per capita income on track
so that the standard of living can be maintained as well as the performance of the domestic
economy remain unaltered.
One of the main back up for the Australian economy came through the rise in
government expenditure that has aided the economy to become where it is now. With the
stimulus package and keeping the interest rate higher than the Fed rate, Australian economy
attracted much amount of investment from the foreign nations that has aided the economy to
expand over the years (Uddin et al., 2016). In addition to this, Australian economy has started
to enhance this export capabilities so as to enhance their performance in case of the balance
of trade that has enhance the overall economic performance of the state. Thus, it can be said
that the economic performance in the productivity frontier of the Australian economy, it has
remained substantial during the last one decade and as per forecast, it is expected to rise to
greater extent.
6ECONOMICS ASSIGNMENT
2005 2006 2007 2008 2009 2010 2011 2012 2013 2014
36000
37000
38000
39000
40000
41000
42000
43000
44000
Real GDP per capita
Real GDP per capita
Figure 3: Real GDP per capita
Source: (Australia Data, 2018)
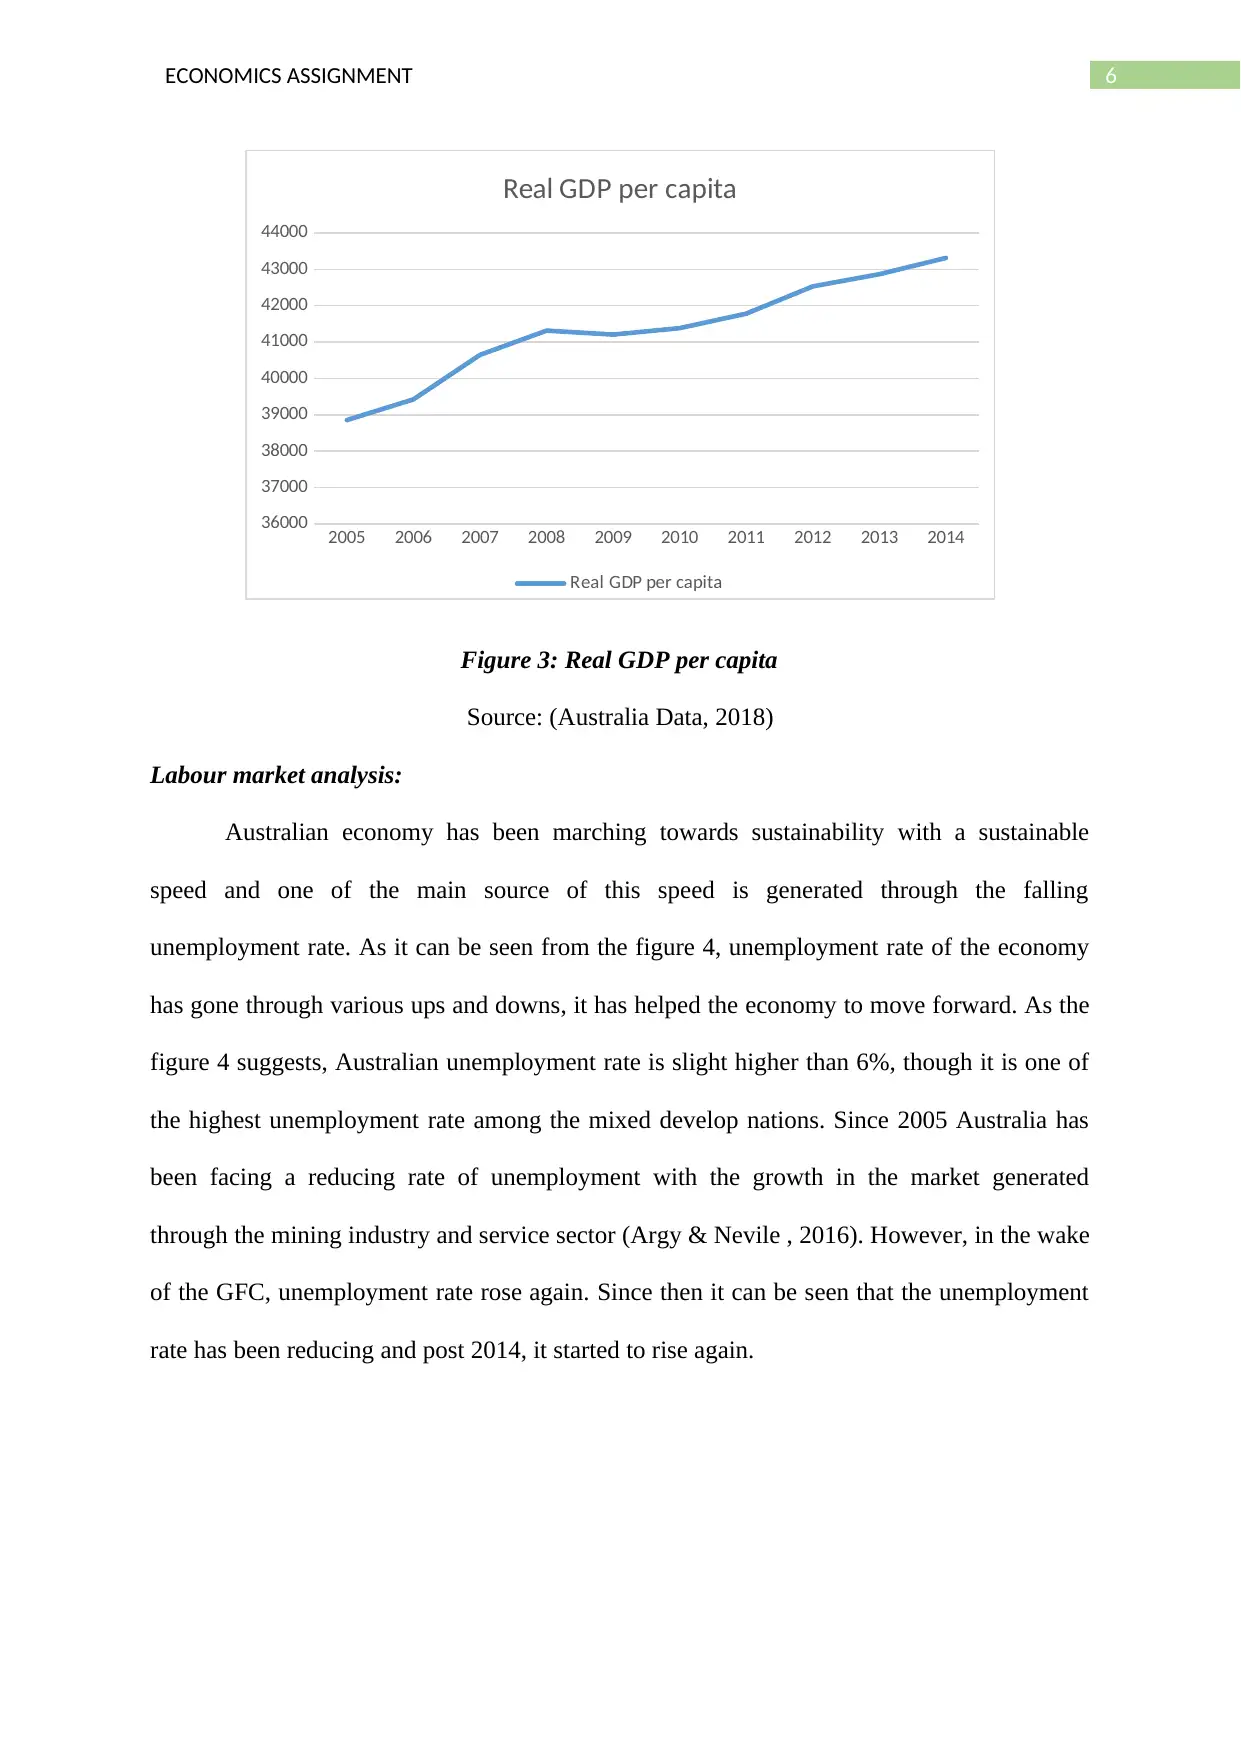
Labour market analysis:
Australian economy has been marching towards sustainability with a sustainable
speed and one of the main source of this speed is generated through the falling
unemployment rate. As it can be seen from the figure 4, unemployment rate of the economy
has gone through various ups and downs, it has helped the economy to move forward. As the
figure 4 suggests, Australian unemployment rate is slight higher than 6%, though it is one of
the highest unemployment rate among the mixed develop nations. Since 2005 Australia has
been facing a reducing rate of unemployment with the growth in the market generated
through the mining industry and service sector (Argy & Nevile , 2016). However, in the wake
of the GFC, unemployment rate rose again. Since then it can be seen that the unemployment
rate has been reducing and post 2014, it started to rise again.
2005 2006 2007 2008 2009 2010 2011 2012 2013 2014
36000
37000
38000
39000
40000
41000
42000
43000
44000
Real GDP per capita
Real GDP per capita
Figure 3: Real GDP per capita
Source: (Australia Data, 2018)
Labour market analysis:
Australian economy has been marching towards sustainability with a sustainable
speed and one of the main source of this speed is generated through the falling
unemployment rate. As it can be seen from the figure 4, unemployment rate of the economy
has gone through various ups and downs, it has helped the economy to move forward. As the
figure 4 suggests, Australian unemployment rate is slight higher than 6%, though it is one of
the highest unemployment rate among the mixed develop nations. Since 2005 Australia has
been facing a reducing rate of unemployment with the growth in the market generated
through the mining industry and service sector (Argy & Nevile , 2016). However, in the wake
of the GFC, unemployment rate rose again. Since then it can be seen that the unemployment
rate has been reducing and post 2014, it started to rise again.
⊘ This is a preview!⊘
Do you want full access?
Subscribe today to unlock all pages.
Trusted by 1+ million students worldwide
7ECONOMICS ASSIGNMENT
2005 2006 2007 2008 2009 2010 2011 2012 2013 2014
0
1
2
3
4
5
6
7
Unemployment
Figure 4: Unemployment rate
Source: (Australia Data, 2018)
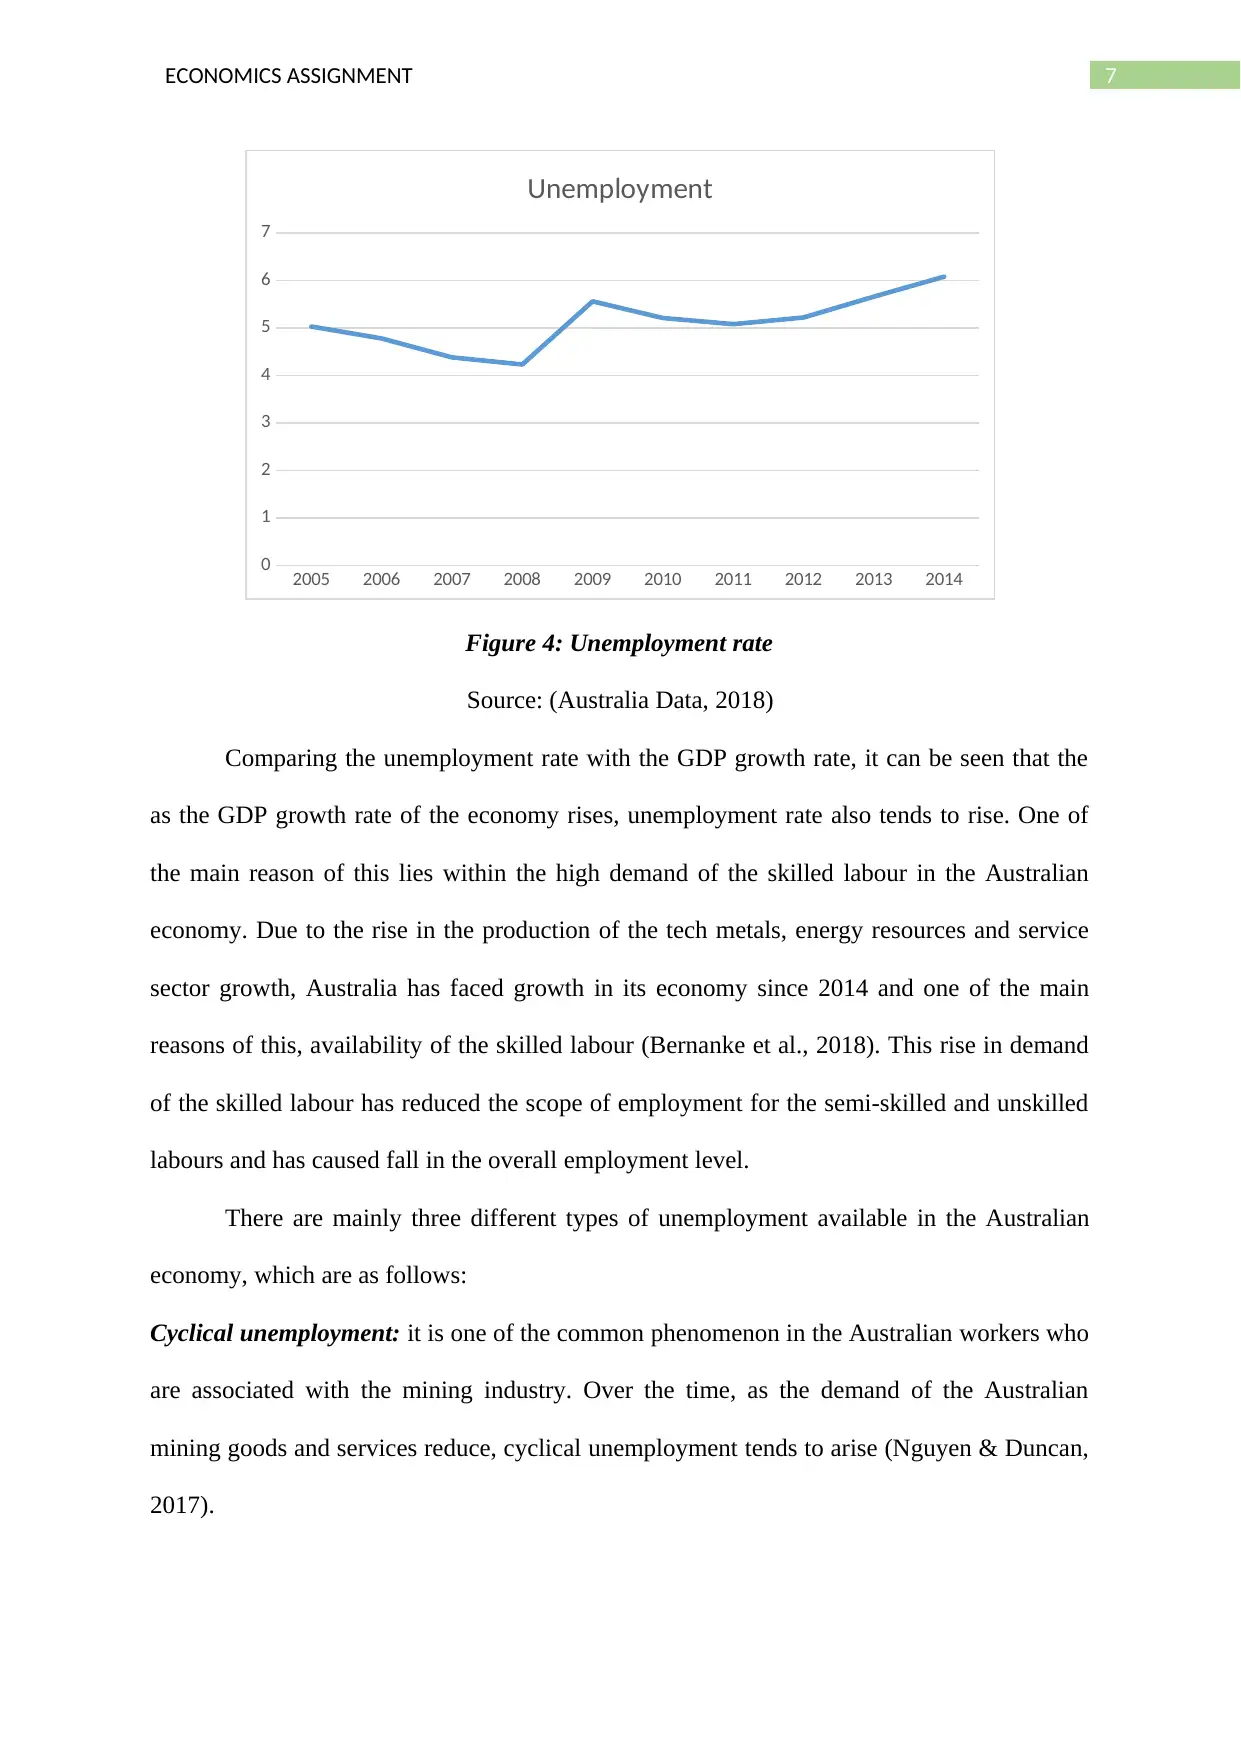
Comparing the unemployment rate with the GDP growth rate, it can be seen that the
as the GDP growth rate of the economy rises, unemployment rate also tends to rise. One of
the main reason of this lies within the high demand of the skilled labour in the Australian
economy. Due to the rise in the production of the tech metals, energy resources and service
sector growth, Australia has faced growth in its economy since 2014 and one of the main
reasons of this, availability of the skilled labour (Bernanke et al., 2018). This rise in demand
of the skilled labour has reduced the scope of employment for the semi-skilled and unskilled
labours and has caused fall in the overall employment level.
There are mainly three different types of unemployment available in the Australian
economy, which are as follows:
Cyclical unemployment: it is one of the common phenomenon in the Australian workers who
are associated with the mining industry. Over the time, as the demand of the Australian
mining goods and services reduce, cyclical unemployment tends to arise (Nguyen & Duncan,
2017).
2005 2006 2007 2008 2009 2010 2011 2012 2013 2014
0
1
2
3
4
5
6
7
Unemployment
Figure 4: Unemployment rate
Source: (Australia Data, 2018)
Comparing the unemployment rate with the GDP growth rate, it can be seen that the
as the GDP growth rate of the economy rises, unemployment rate also tends to rise. One of
the main reason of this lies within the high demand of the skilled labour in the Australian
economy. Due to the rise in the production of the tech metals, energy resources and service
sector growth, Australia has faced growth in its economy since 2014 and one of the main
reasons of this, availability of the skilled labour (Bernanke et al., 2018). This rise in demand
of the skilled labour has reduced the scope of employment for the semi-skilled and unskilled
labours and has caused fall in the overall employment level.
There are mainly three different types of unemployment available in the Australian
economy, which are as follows:
Cyclical unemployment: it is one of the common phenomenon in the Australian workers who
are associated with the mining industry. Over the time, as the demand of the Australian
mining goods and services reduce, cyclical unemployment tends to arise (Nguyen & Duncan,
2017).
Paraphrase This Document
Need a fresh take? Get an instant paraphrase of this document with our AI Paraphraser
8ECONOMICS ASSIGNMENT
Seasonal unemployment: second largest reason of the unemployment in the Australian
economy that arise in the case of the agricultural sector. As the season of farming pasts, many
lands in Australia become unworthy for farming making the workers unemployed. Thus
seasonal unemployment is one of the common phenomenon in the Australian economy
(Healy, 2016).
Structural unemployment: this is another main reason for the unemployment in the
Australian economy. With the fall in the demand of one industry in the Australian economy,
this type of unemployment rate can be seen.
In order to gauge the situation of the unemployment in the economy, Australian
government has taken steps through introducing vocational training centres that can educate
the workers regarding the latest technologies. In addition to this, there are various certificate
courses that allow the workers to transform from semi-skilled to skilled workers and doing so
Australian government has been transforming the labour market of the economy (Bilston et
al., 2015).
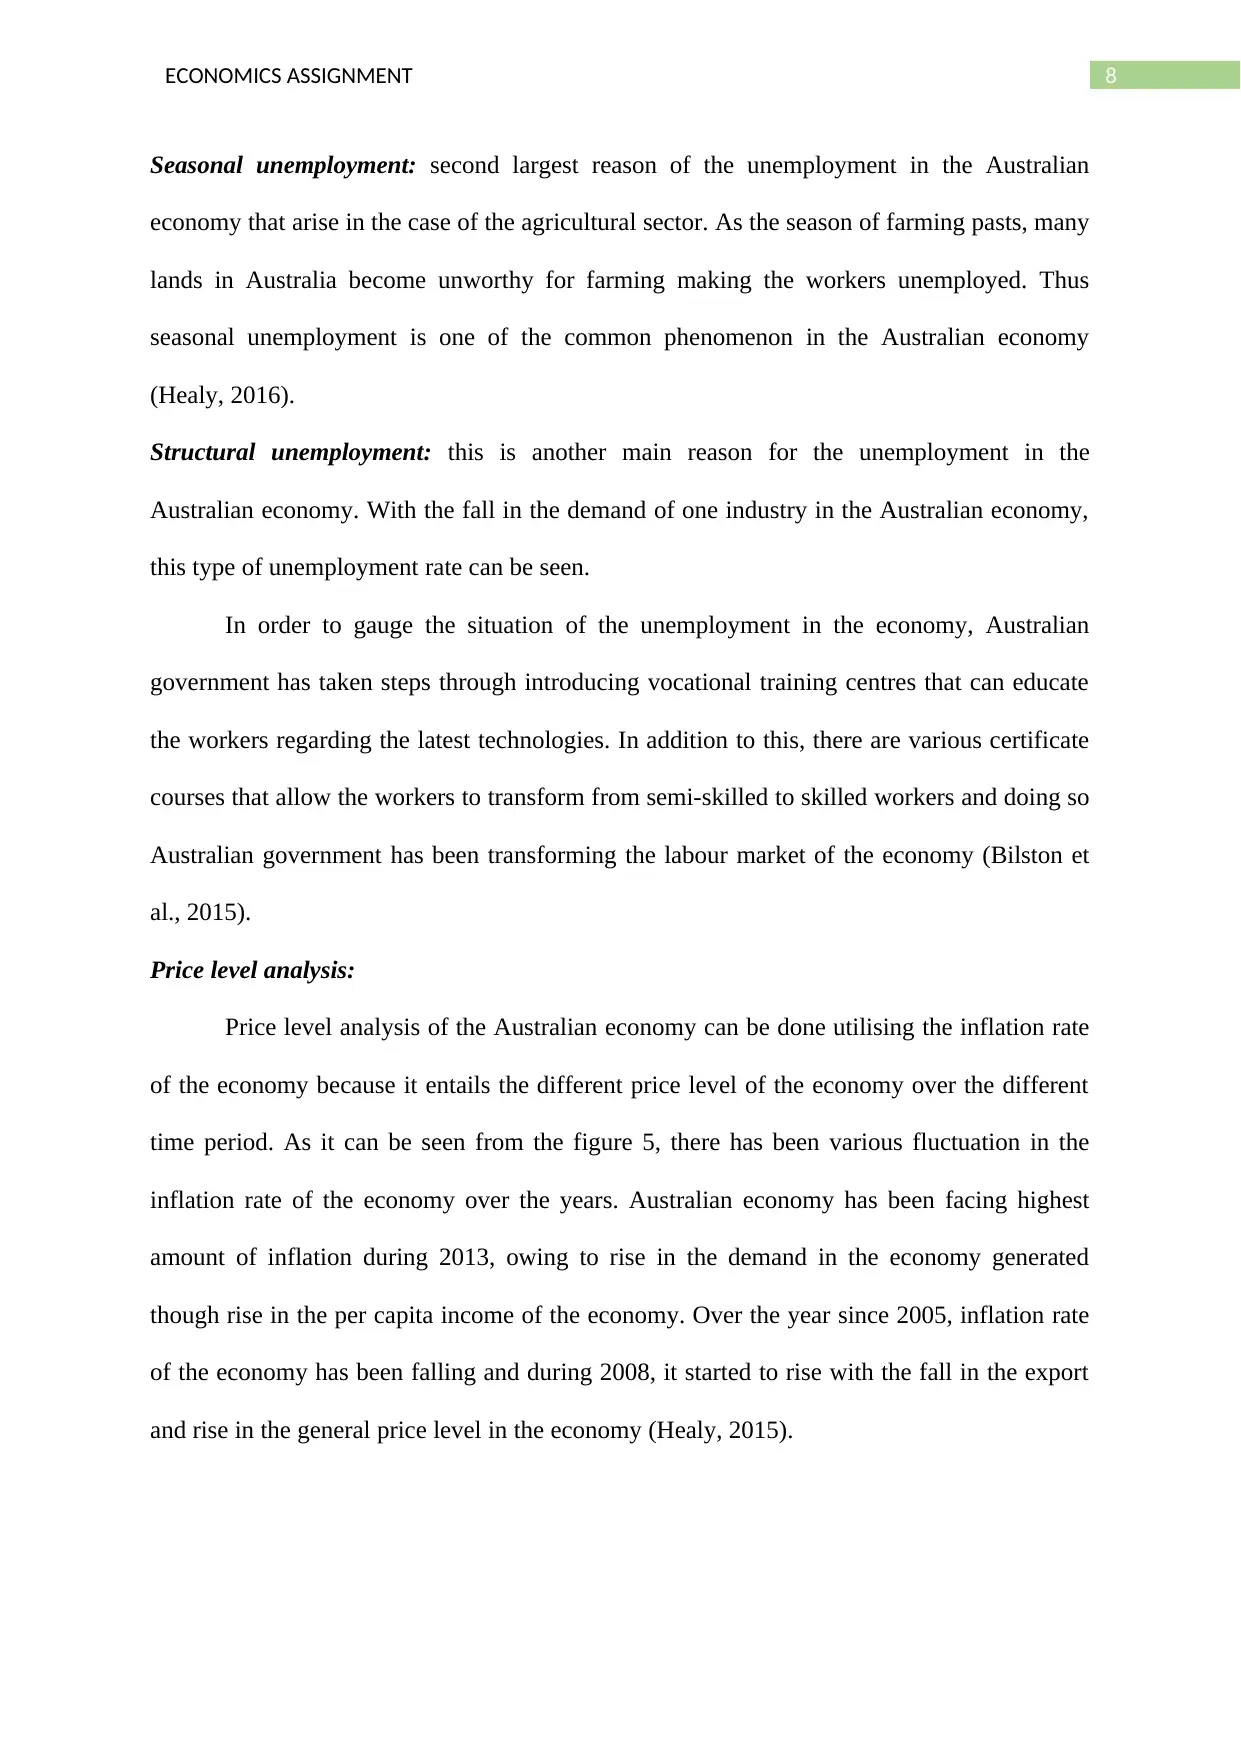
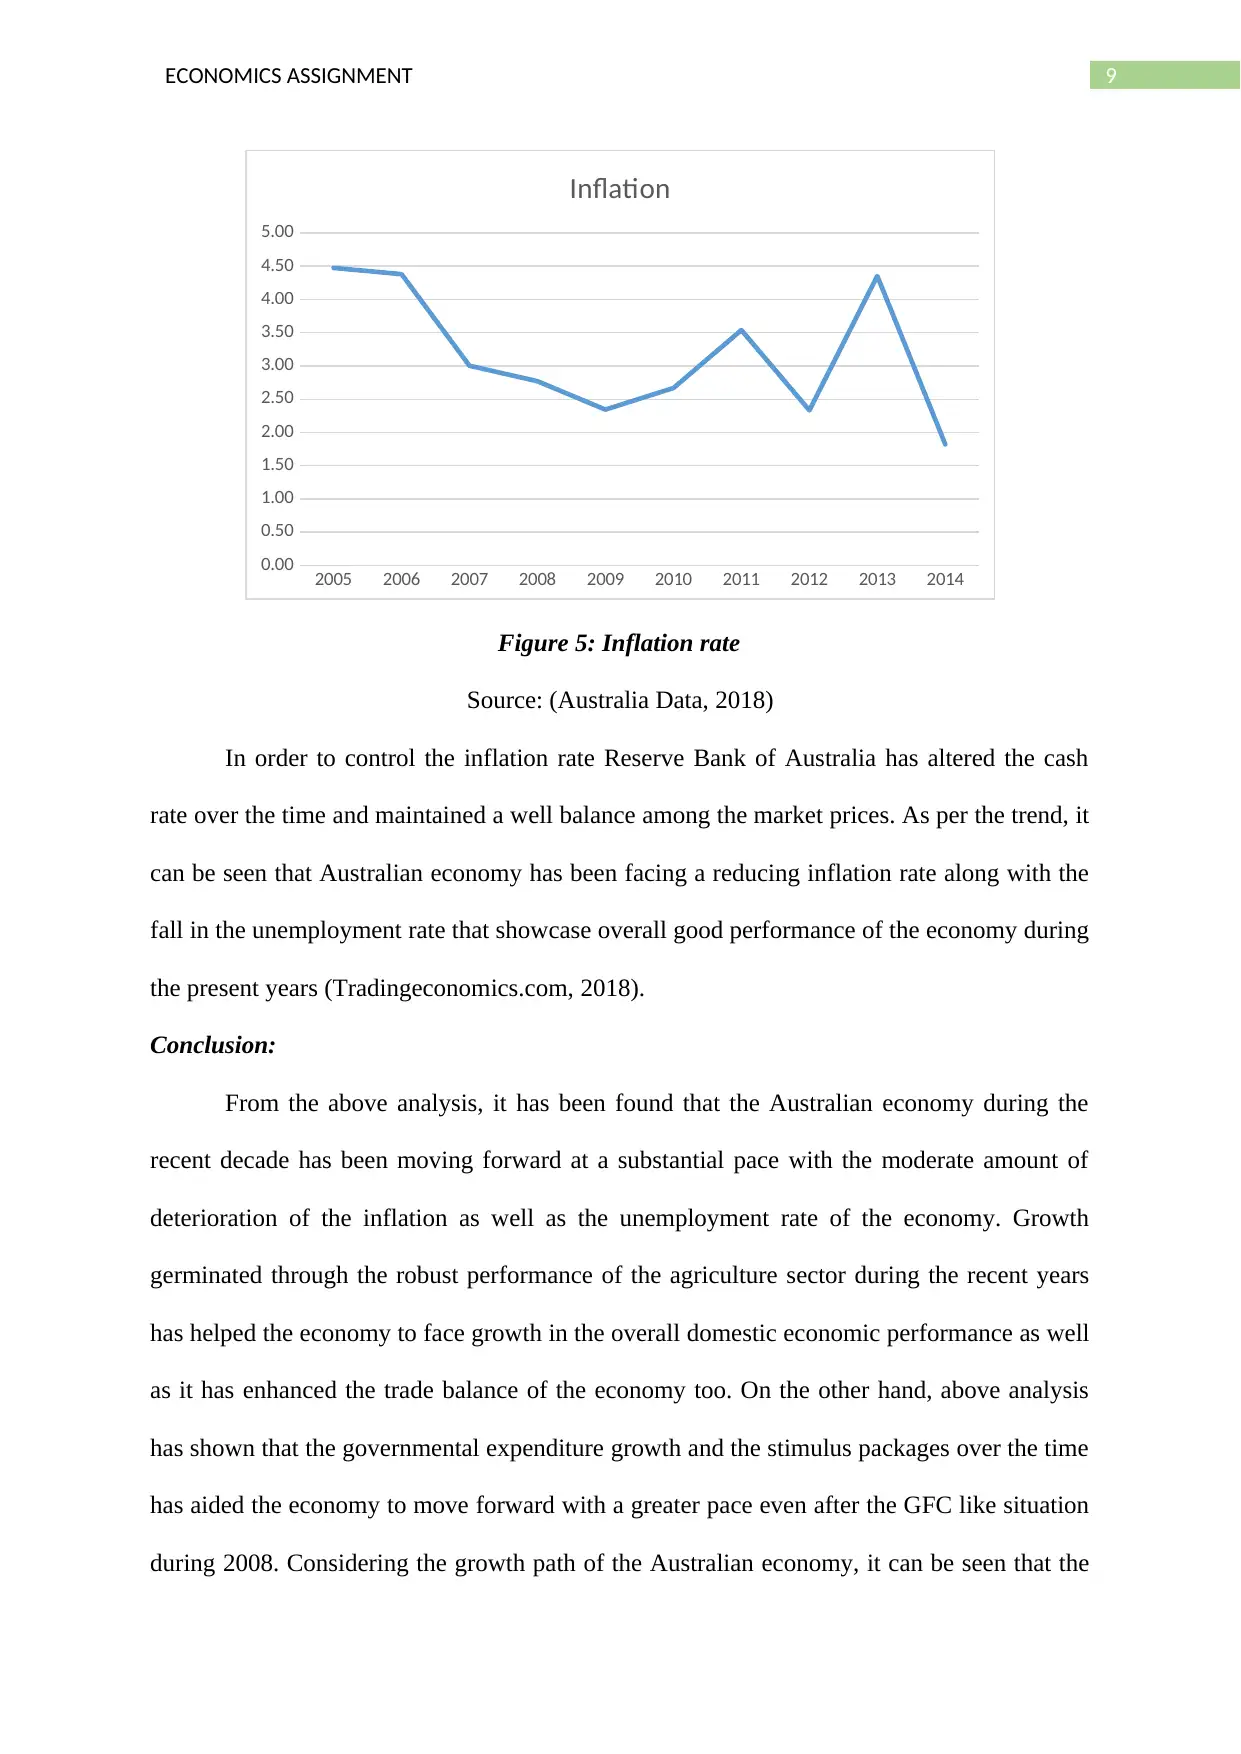
Price level analysis:
Price level analysis of the Australian economy can be done utilising the inflation rate
of the economy because it entails the different price level of the economy over the different
time period. As it can be seen from the figure 5, there has been various fluctuation in the
inflation rate of the economy over the years. Australian economy has been facing highest
amount of inflation during 2013, owing to rise in the demand in the economy generated
though rise in the per capita income of the economy. Over the year since 2005, inflation rate
of the economy has been falling and during 2008, it started to rise with the fall in the export
and rise in the general price level in the economy (Healy, 2015).
Seasonal unemployment: second largest reason of the unemployment in the Australian
economy that arise in the case of the agricultural sector. As the season of farming pasts, many
lands in Australia become unworthy for farming making the workers unemployed. Thus
seasonal unemployment is one of the common phenomenon in the Australian economy
(Healy, 2016).
Structural unemployment: this is another main reason for the unemployment in the
Australian economy. With the fall in the demand of one industry in the Australian economy,
this type of unemployment rate can be seen.
In order to gauge the situation of the unemployment in the economy, Australian
government has taken steps through introducing vocational training centres that can educate
the workers regarding the latest technologies. In addition to this, there are various certificate
courses that allow the workers to transform from semi-skilled to skilled workers and doing so
Australian government has been transforming the labour market of the economy (Bilston et
al., 2015).
Price level analysis:
Price level analysis of the Australian economy can be done utilising the inflation rate
of the economy because it entails the different price level of the economy over the different
time period. As it can be seen from the figure 5, there has been various fluctuation in the
inflation rate of the economy over the years. Australian economy has been facing highest
amount of inflation during 2013, owing to rise in the demand in the economy generated
though rise in the per capita income of the economy. Over the year since 2005, inflation rate
of the economy has been falling and during 2008, it started to rise with the fall in the export
and rise in the general price level in the economy (Healy, 2015).
9ECONOMICS ASSIGNMENT
2005 2006 2007 2008 2009 2010 2011 2012 2013 2014
0.00
0.50
1.00
1.50
2.00
2.50
3.00
3.50
4.00
4.50
5.00
Inflation
Figure 5: Inflation rate
Source: (Australia Data, 2018)
In order to control the inflation rate Reserve Bank of Australia has altered the cash
rate over the time and maintained a well balance among the market prices. As per the trend, it
can be seen that Australian economy has been facing a reducing inflation rate along with the
fall in the unemployment rate that showcase overall good performance of the economy during
the present years (Tradingeconomics.com, 2018).
Conclusion:
From the above analysis, it has been found that the Australian economy during the
recent decade has been moving forward at a substantial pace with the moderate amount of
deterioration of the inflation as well as the unemployment rate of the economy. Growth
germinated through the robust performance of the agriculture sector during the recent years
has helped the economy to face growth in the overall domestic economic performance as well
as it has enhanced the trade balance of the economy too. On the other hand, above analysis
has shown that the governmental expenditure growth and the stimulus packages over the time
has aided the economy to move forward with a greater pace even after the GFC like situation
during 2008. Considering the growth path of the Australian economy, it can be seen that the
⊘ This is a preview!⊘
Do you want full access?
Subscribe today to unlock all pages.
Trusted by 1+ million students worldwide
10ECONOMICS ASSIGNMENT
performance of the economy during the selected time period has been moderate and presently
the economy is going through its expansion stage, where the various macroeconomic
parameters are reaching to high standards. Thus to conclude, it can be said that, over the
years, real GDP of the Australian economy has increased by a large extent with the rise in the
various other economic parameters like per capital income as well as there has been
substantial amount of fall in the unemployment rate and the inflation rate in the state.
Considering this, overall performance of the Australian economy during the recent decade
has been moderate.
Paraphrase This Document
Need a fresh take? Get an instant paraphrase of this document with our AI Paraphraser
11ECONOMICS ASSIGNMENT
Reference:
Argy, V.E. & Nevile, J. eds. (2016). Inflation and Unemployment: Theory, Experience and
Policy Making. Routledge.
Australia - Economic Indicators. (2018). Retrieved from
https://tradingeconomics.com/australia/indicators
Australia | Data. (2018). Retrieved from https://data.worldbank.org/country/australia
Bernanke, B.S., Laubach, T., Mishkin, F.S. & Posen, A.S. (2018). Inflation targeting: lessons
from the international experience. Princeton University Press.
Bilston, T., Johnson, R., & Read, M. (2015). Stress testing the Australian household sector
using the HILDA survey. Economic Research Department, Reserve Bank of
Australia.
Downes, P. M., Hanslow, K., & Tulip, P. (2014). The effect of the mining boom on the
Australian economy.
Hatfield-Dodds, S., Schandl, H., Adams, P.D., Baynes, T.M., Brinsmead, T.S., Bryan, B.A.,
Chiew, F.H., Graham, P.W., Grundy, M., Harwood, T. & McCallum, R. (2015).
Australia is ‘free to choose’economic growth and falling environmental pressures.
Nature, 527(7576), p.49.
Healy, J. (2015). The Australian labour market in 2014: Still ill?. Journal of Industrial
Relations, 57(3), 348-365.
Healy, J. (2016). The Australian labour market in 2015. Journal of Industrial Relations, 58(3),
308-323.
Manalo, J., Perera, D. & Rees, D.M. (2015). Exchange rate movements and the Australian
economy. Economic Modelling, 47, pp.53-62.
12ECONOMICS ASSIGNMENT
Nguyen, H. T., & Duncan, A. S. (2017). Exchange rate fluctuations and immigrants' labour
market outcomes: New evidence from Australian household panel data. Journal of
International Economics, 105, 174-186.
Rahman, M.M. & Mamun, S.A.K. (2016). Energy use, international trade and economic
growth nexus in Australia: New evidence from an extended growth model. Renewable
and Sustainable Energy Reviews, 64, pp.806-816.
Reedman, L.J., Kanudia, A., Graham, P.W., Qiu, J., Brinsmead, T.S., Wang, D. & Hayward,
J.A. (2018). Towards Zero Carbon Scenarios for the Australian Economy. In Limiting
Global Warming to Well Below 2° C: Energy System Modelling and Policy
Development (pp. 261-276). Springer, Cham.
Rees, D. M., Smith, P., & Hall, J. (2016). A Multi‐sector Model of the Australian Economy.
Economic Record, 92(298), 374-408.
Schroeder, S. (2018). Just how fragile is the Australian economy?. Australian Options, (87),
p.18.
Uddin, G.A., Alam, K. & Gow, J. (2016). Population age structure and savings rate impacts
on economic growth: Evidence from Australia. Economic Analysis and Policy, 52,
pp.23-33.
⊘ This is a preview!⊘
Do you want full access?
Subscribe today to unlock all pages.
Trusted by 1+ million students worldwide
1 out of 12
Related Documents


Your All-in-One AI-Powered Toolkit for Academic Success.
+13062052269
info@desklib.com
Available 24*7 on WhatsApp / Email
![[object Object]](/_next/static/media/star-bottom.7253800d.svg)
Unlock your academic potential
Copyright © 2020–2026 A2Z Services. All Rights Reserved. Developed and managed by ZUCOL.