GDP and Economic Growth in Australia: Policy and Industry Analysis
VerifiedAdded on 2023/06/12
|22
|4241
|145
Report
AI Summary
This report provides an analysis of Australia's economic growth, focusing on the period between 2012 and 2017. It examines key economic indicators such as GDP, inflation rate, consumption expenditures, and unemployment rate, highlighting trends and fluctuations within the Australian economy. The report also delves into the economic policy framework of the Australian government and its impact on economic growth and stability. Furthermore, it identifies and discusses the industries that have experienced growth during this period, with a particular emphasis on the service sector and the factors contributing to its expansion. The analysis draws on various economic concepts and statistical data to provide a comprehensive overview of Australia's economic performance and the underlying drivers of growth.
Running head: ECONOMICS ASSIGNMENT
Economics Assignment
Name of the Student
Name of the University
Author Note
Economics Assignment
Name of the Student
Name of the University
Author Note
Paraphrase This Document
Need a fresh take? Get an instant paraphrase of this document with our AI Paraphraser
1ECONOMICS ASSIGNMENT
Executive Summary
The economy of Australia has developed over the years and has eventually emerged
as one of the most influential economies in the global scenario. The economy of the country
has been known for its stability and robust performances in all the growth indicators over the
years, which also include the last five years, where the parameters of economic growth have
shown mixed responses. The policy framework of the government of Australia can be
considered to be one of the primary contributors to the economic growth, development and
overall stability of the country, especially at the times of internal as well as external turmoil
in the economic scenario. The industrial aspects of the country have also been experiencing a
primary shift from manufacturing to service sector expansions and a movement from low
skilled labour-intensive jobs to creation of more skilled and capital-intensive jobs and
businesses with the increasing innovations in technologies and increased capital investment
dynamics in the country in the last five years.
2ECONOMICS ASSIGNMENT
Table of Contents
Introduction................................................................................................................................3
Economic growth of Australia...................................................................................................4
Economic Growth Trends of Australia (2012-2017).............................................................4
GDP (Different variants) and GDP Growth Rate in Australia (2012-2017)......................5
Inflation rate in Australia (2012-2017)..............................................................................9
Consumption Expenditures (2012-2017) in Australia.....................................................10
Unemployment Rate (2012-2017) in Australia................................................................11
Economic Policy Framework of Australian Government........................................................12
Growth of Industries in Australia (2012-2017)........................................................................15
Reasons for growth of service sector industry in Australia.................................................17
Conclusion................................................................................................................................17
References................................................................................................................................19
⊘ This is a preview!⊘
Do you want full access?
Subscribe today to unlock all pages.
Trusted by 1+ million students worldwide
3ECONOMICS ASSIGNMENT
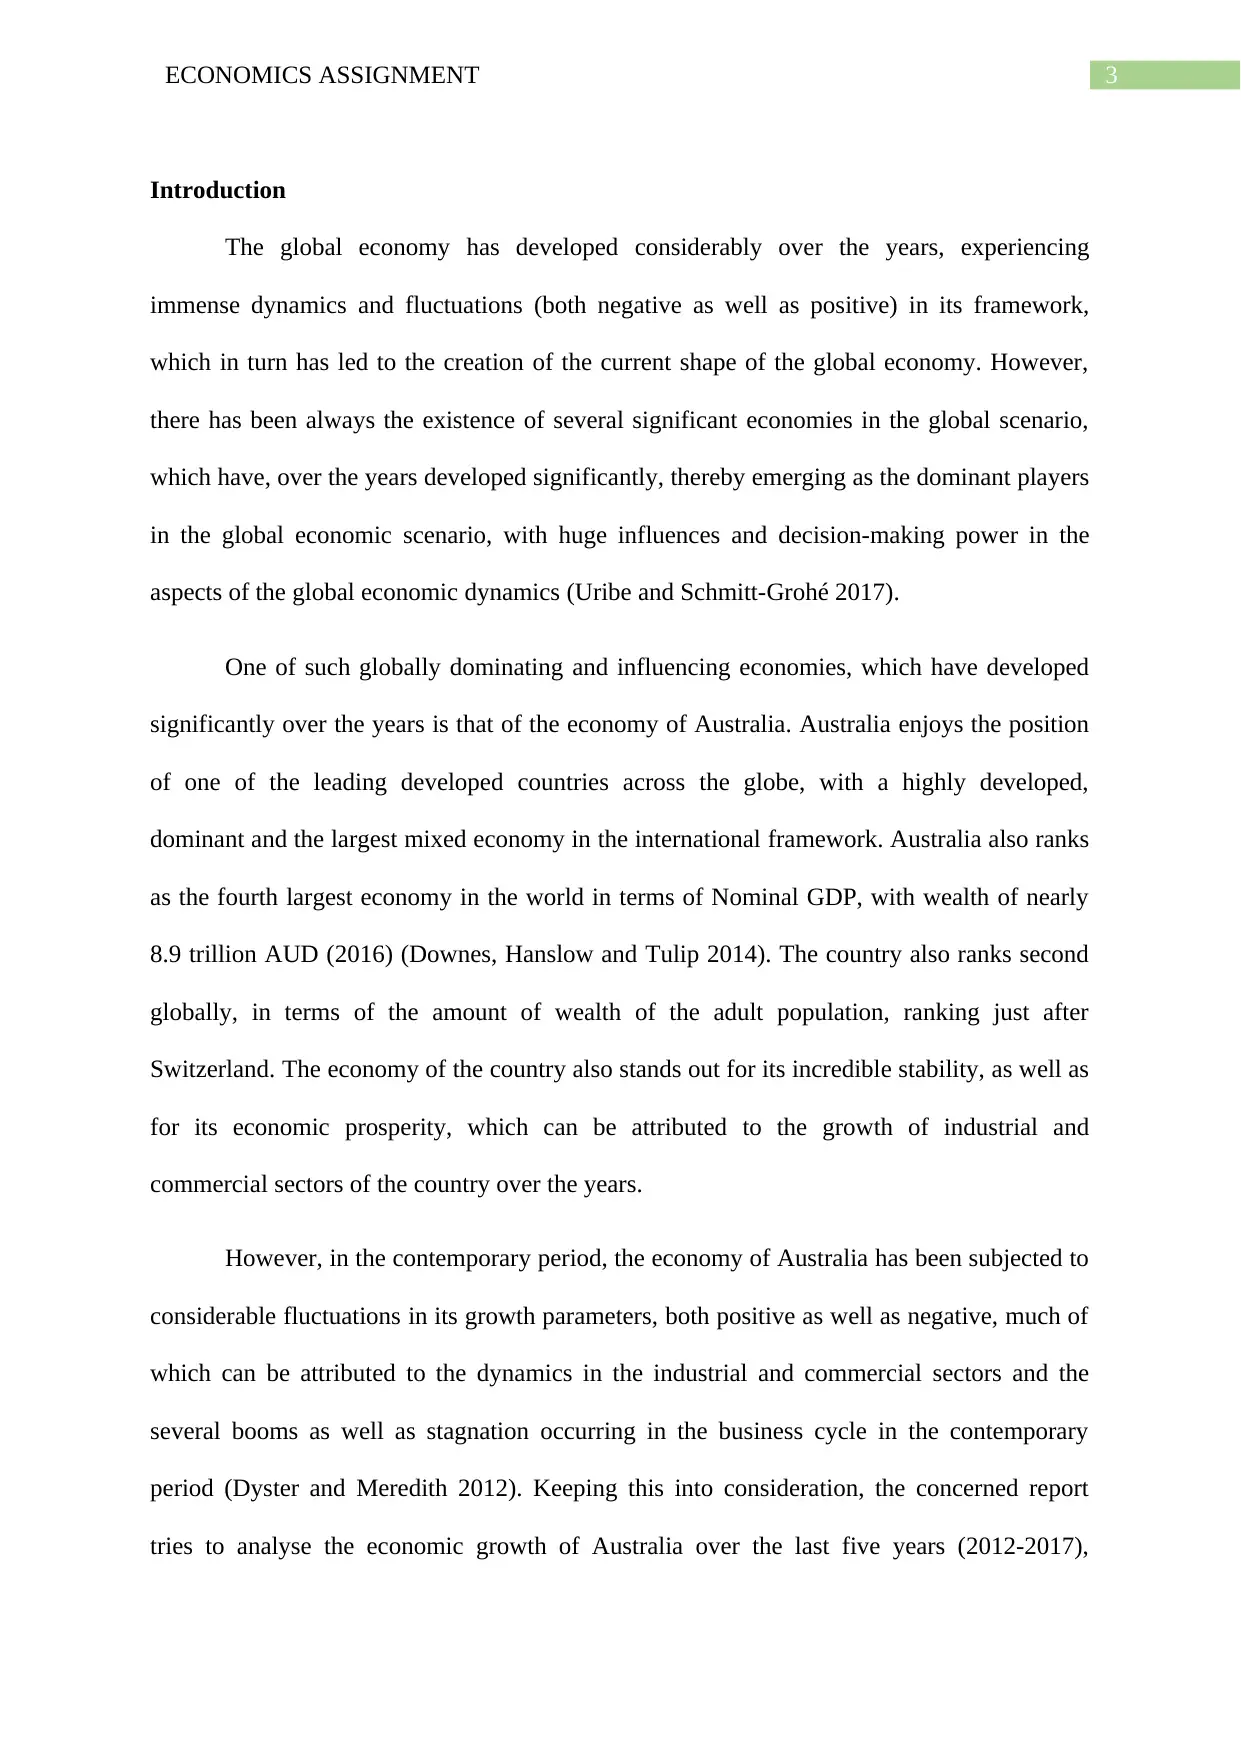
Introduction
The global economy has developed considerably over the years, experiencing
immense dynamics and fluctuations (both negative as well as positive) in its framework,
which in turn has led to the creation of the current shape of the global economy. However,
there has been always the existence of several significant economies in the global scenario,
which have, over the years developed significantly, thereby emerging as the dominant players
in the global economic scenario, with huge influences and decision-making power in the
aspects of the global economic dynamics (Uribe and Schmitt-Grohé 2017).
One of such globally dominating and influencing economies, which have developed
significantly over the years is that of the economy of Australia. Australia enjoys the position
of one of the leading developed countries across the globe, with a highly developed,
dominant and the largest mixed economy in the international framework. Australia also ranks
as the fourth largest economy in the world in terms of Nominal GDP, with wealth of nearly
8.9 trillion AUD (2016) (Downes, Hanslow and Tulip 2014). The country also ranks second
globally, in terms of the amount of wealth of the adult population, ranking just after
Switzerland. The economy of the country also stands out for its incredible stability, as well as
for its economic prosperity, which can be attributed to the growth of industrial and
commercial sectors of the country over the years.
However, in the contemporary period, the economy of Australia has been subjected to
considerable fluctuations in its growth parameters, both positive as well as negative, much of
which can be attributed to the dynamics in the industrial and commercial sectors and the
several booms as well as stagnation occurring in the business cycle in the contemporary
period (Dyster and Meredith 2012). Keeping this into consideration, the concerned report
tries to analyse the economic growth of Australia over the last five years (2012-2017),
Paraphrase This Document
Need a fresh take? Get an instant paraphrase of this document with our AI Paraphraser
4ECONOMICS ASSIGNMENT
thereby analysing the economic policy framework of the country. The report also tries to
discuss the industries which have grown in the country over the years, thereby trying to
analyse the reason behind the growth of the concerned industries.
Economic growth of Australia
As discussed above, the economy of Australia has developed visibly over the decades,
with a highly developed industrial sector and a prominent service sector, which has been
growing significantly over the years. Australia has over the years, emerged as a mining as
well as technological giant and much of the current prosperity of the country can be attributed
to the mining boom which Australia started experiencing in 2003 (Downes, Hanslow and
Tulip 2014). Australia, apart from a prosperous economy also has multi-lateral and long-term
trade connections with almost all the significant economies in the world in the contemporary
period, which in turn also contributes to the economic growth of the country over the years
(McLean 2012).
Economic Growth Trends of Australia (2012-2017)
The growth of an economy, in general, is measured in terms of the dynamics in the
economic growth indicators like that of the Gross Domestic Product (real as well as nominal),
the growth rates of GDP and also the per-capita GDP growth rate of the country and others.
In case of Australia, over the last five years, the Gross National Income has grown steadily
which can be shown with the help of the following figure:
5ECONOMICS ASSIGNMENT
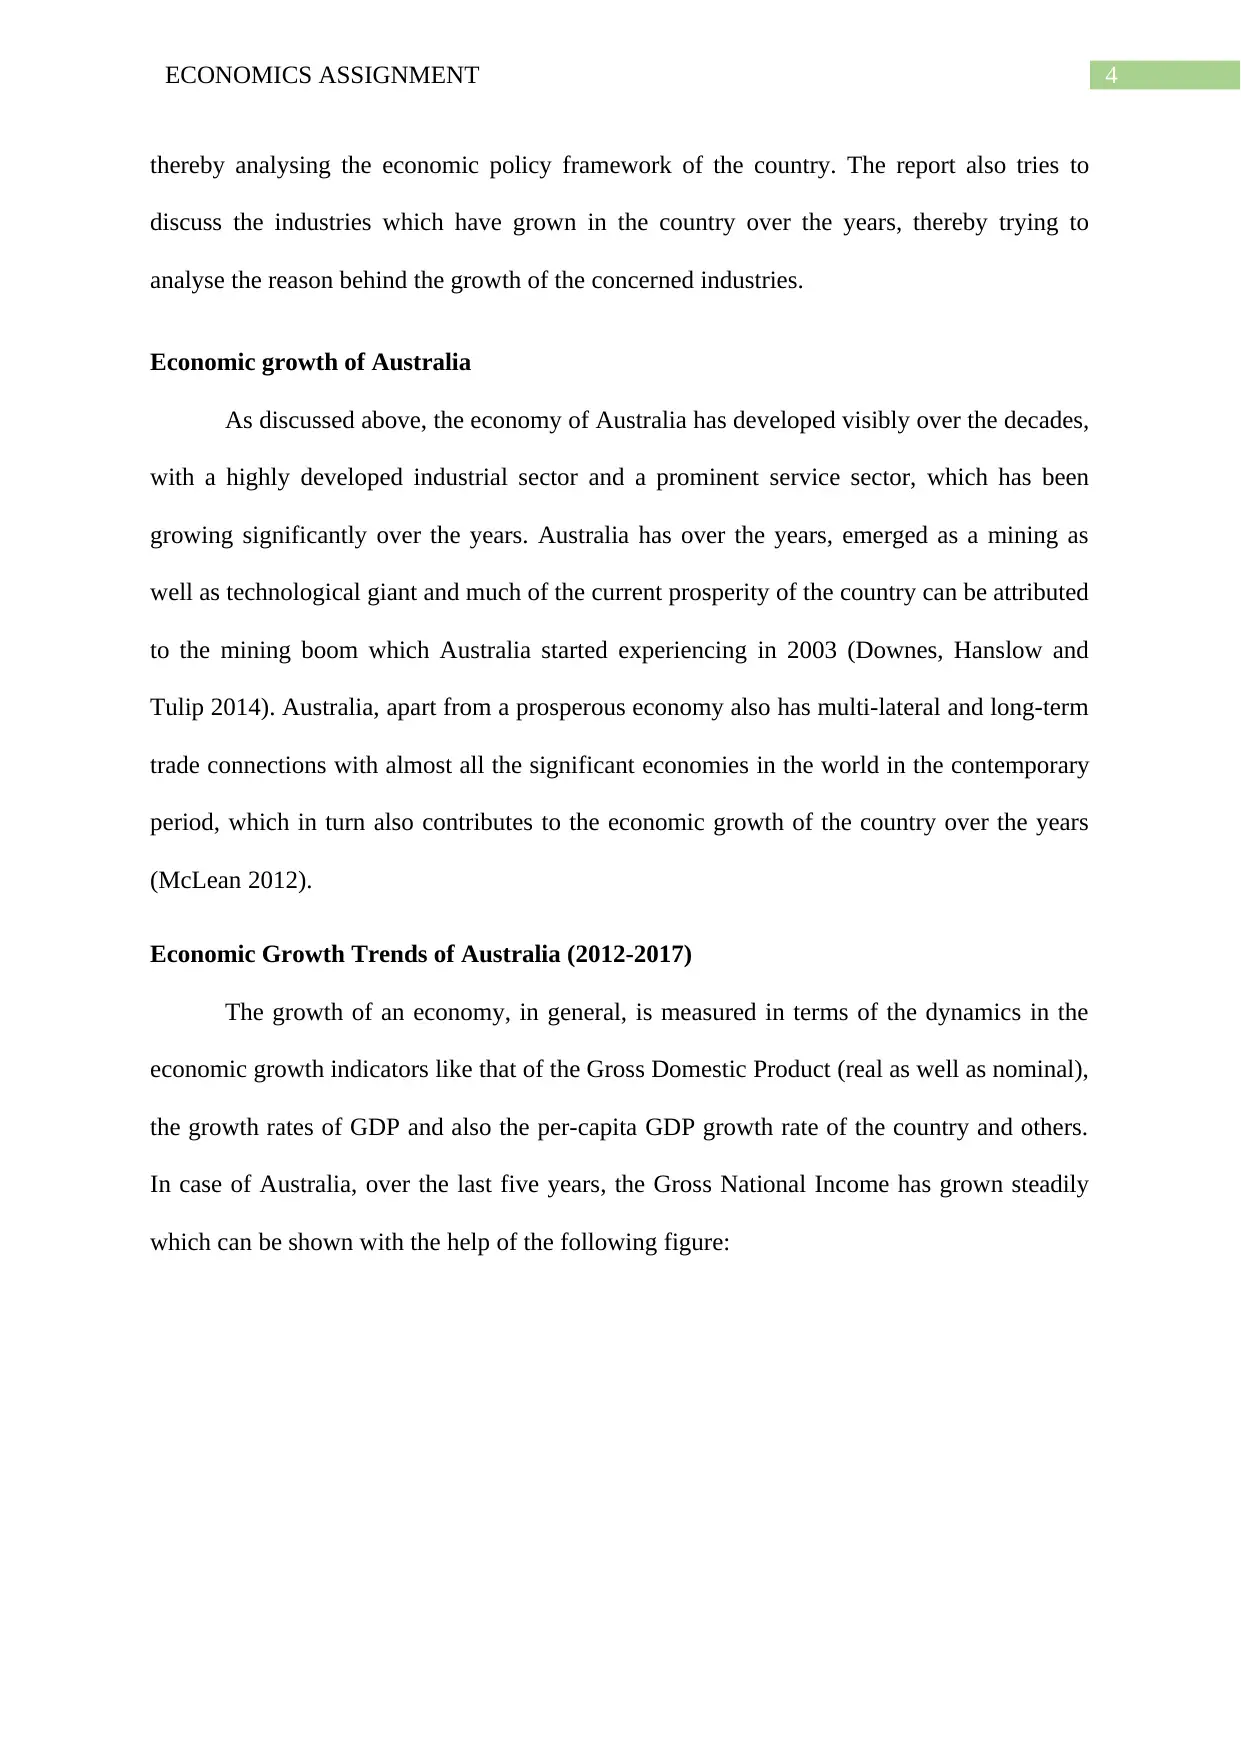
Figure 1: Gross National Income (2012-2017) of Australia in AUD million
(Source: Tradingeconomics.com 2018)
As is evident from the above figure, the gross national income of the country has been
increasing consistently, with the increase being especially prominent post 2015.
GDP (Different variants) and GDP Growth Rate in Australia (2012-2017)
This extremely positive pattern of growth of the Gross National Income of the
country, however, does not tally fully with that of the GDP and GDP growth statistics of the
country in the concerned period as can be seen from the following figure:
⊘ This is a preview!⊘
Do you want full access?
Subscribe today to unlock all pages.
Trusted by 1+ million students worldwide
6ECONOMICS ASSIGNMENT
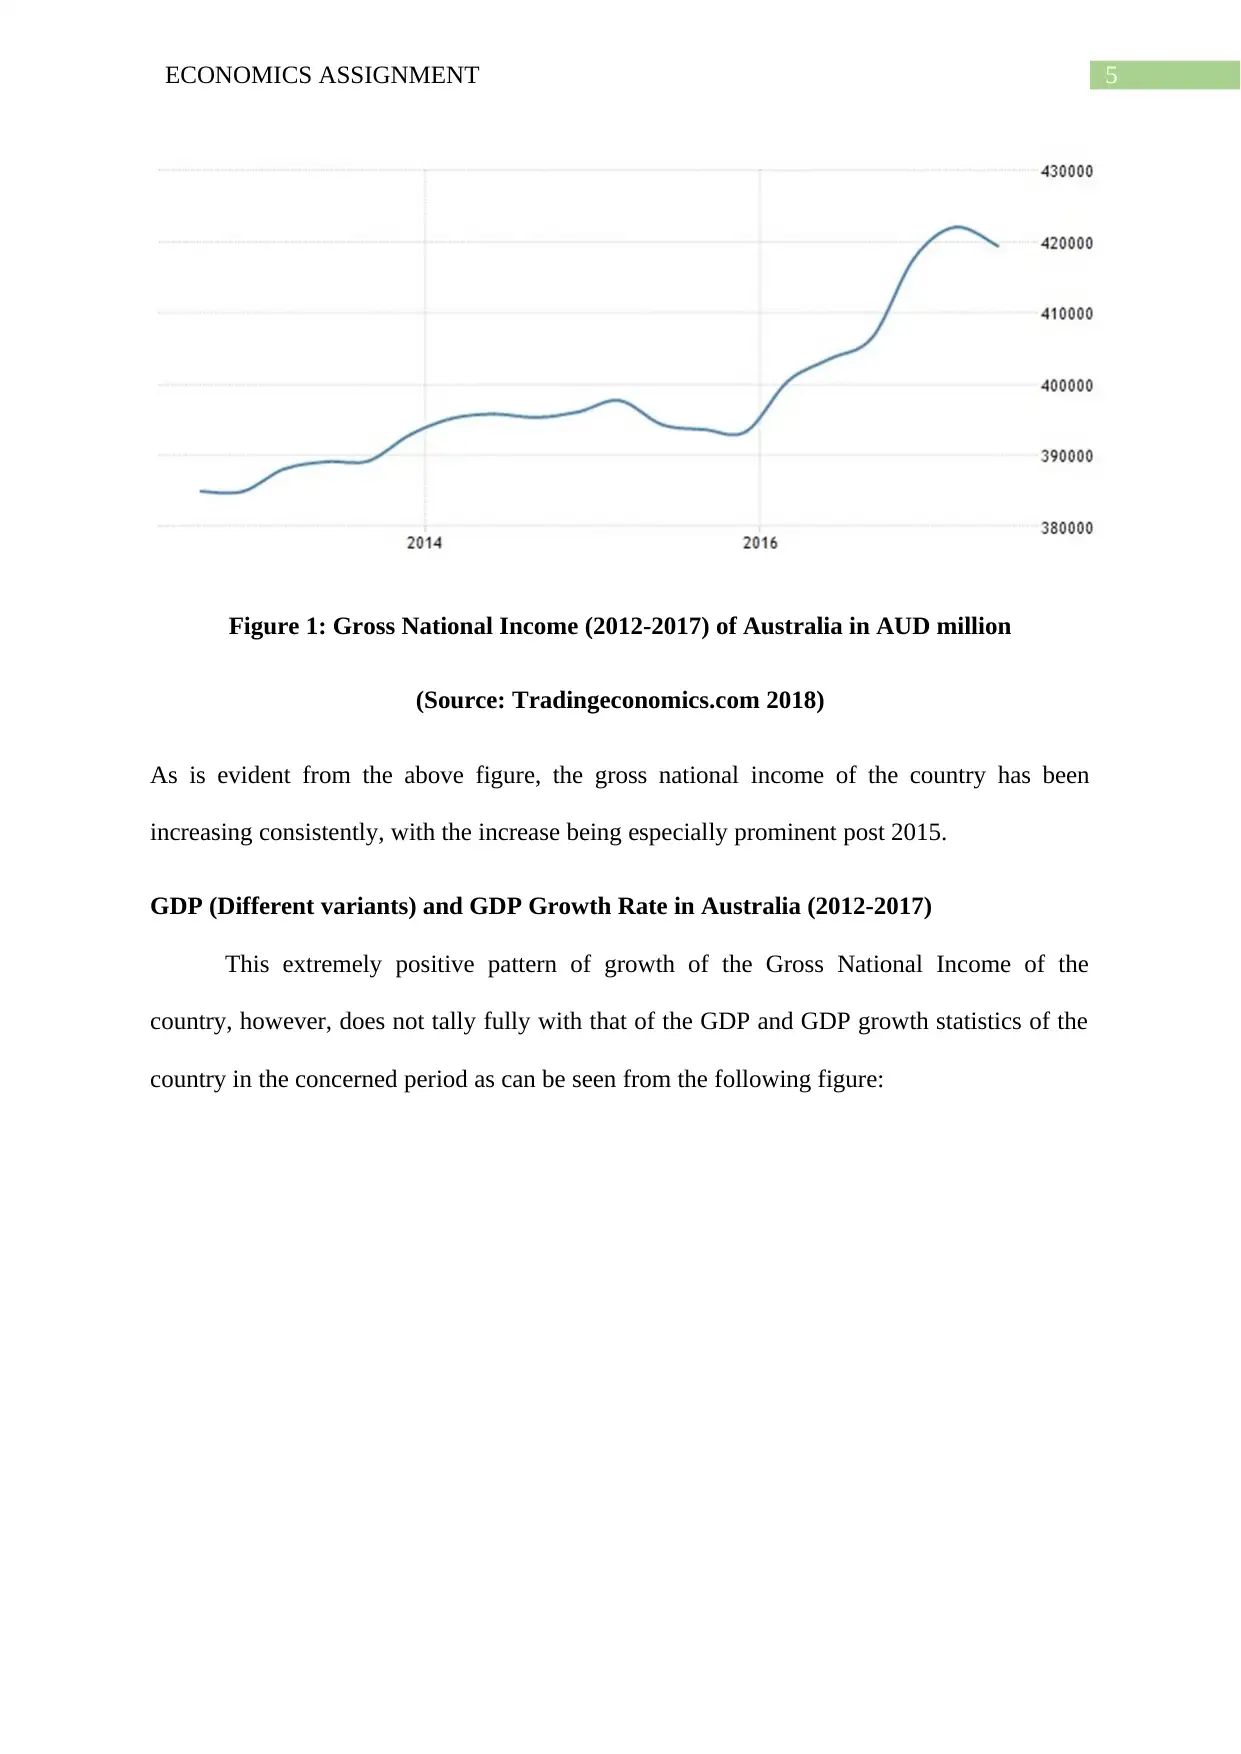
Figure 2: GDP (2012-2017) of Australia in USD million
(Source: Tradingeconomics.com 2018)
The economy of Australia, in spite of being one of the most dominant and developed
economy in the global scenario, known for its economic stability and robust performance of
the economic indicators over the decades, however, shows a strikingly negative trend in one
of its primary economic indicators, the GDP of the country, which in turn, shows the total
value of the goods and services produced within the geographical domain of the country
within a particular period (Coale and Hoover 2015). The GDP of Australia, as is evident from
the above figure, is seen to reduce consistently over the last few years, with the amount being
1538.19 billion USD (2012) to as low as 1204.62 billion USD in the recent periods. This in
turn indicates towards a downturn in the growth of the economy of the country. This can be
explained even prominently with the help of the dynamics in the growth rate of the Gross
Domestic Product of the country, which can be seen as follows:
Paraphrase This Document
Need a fresh take? Get an instant paraphrase of this document with our AI Paraphraser
7ECONOMICS ASSIGNMENT
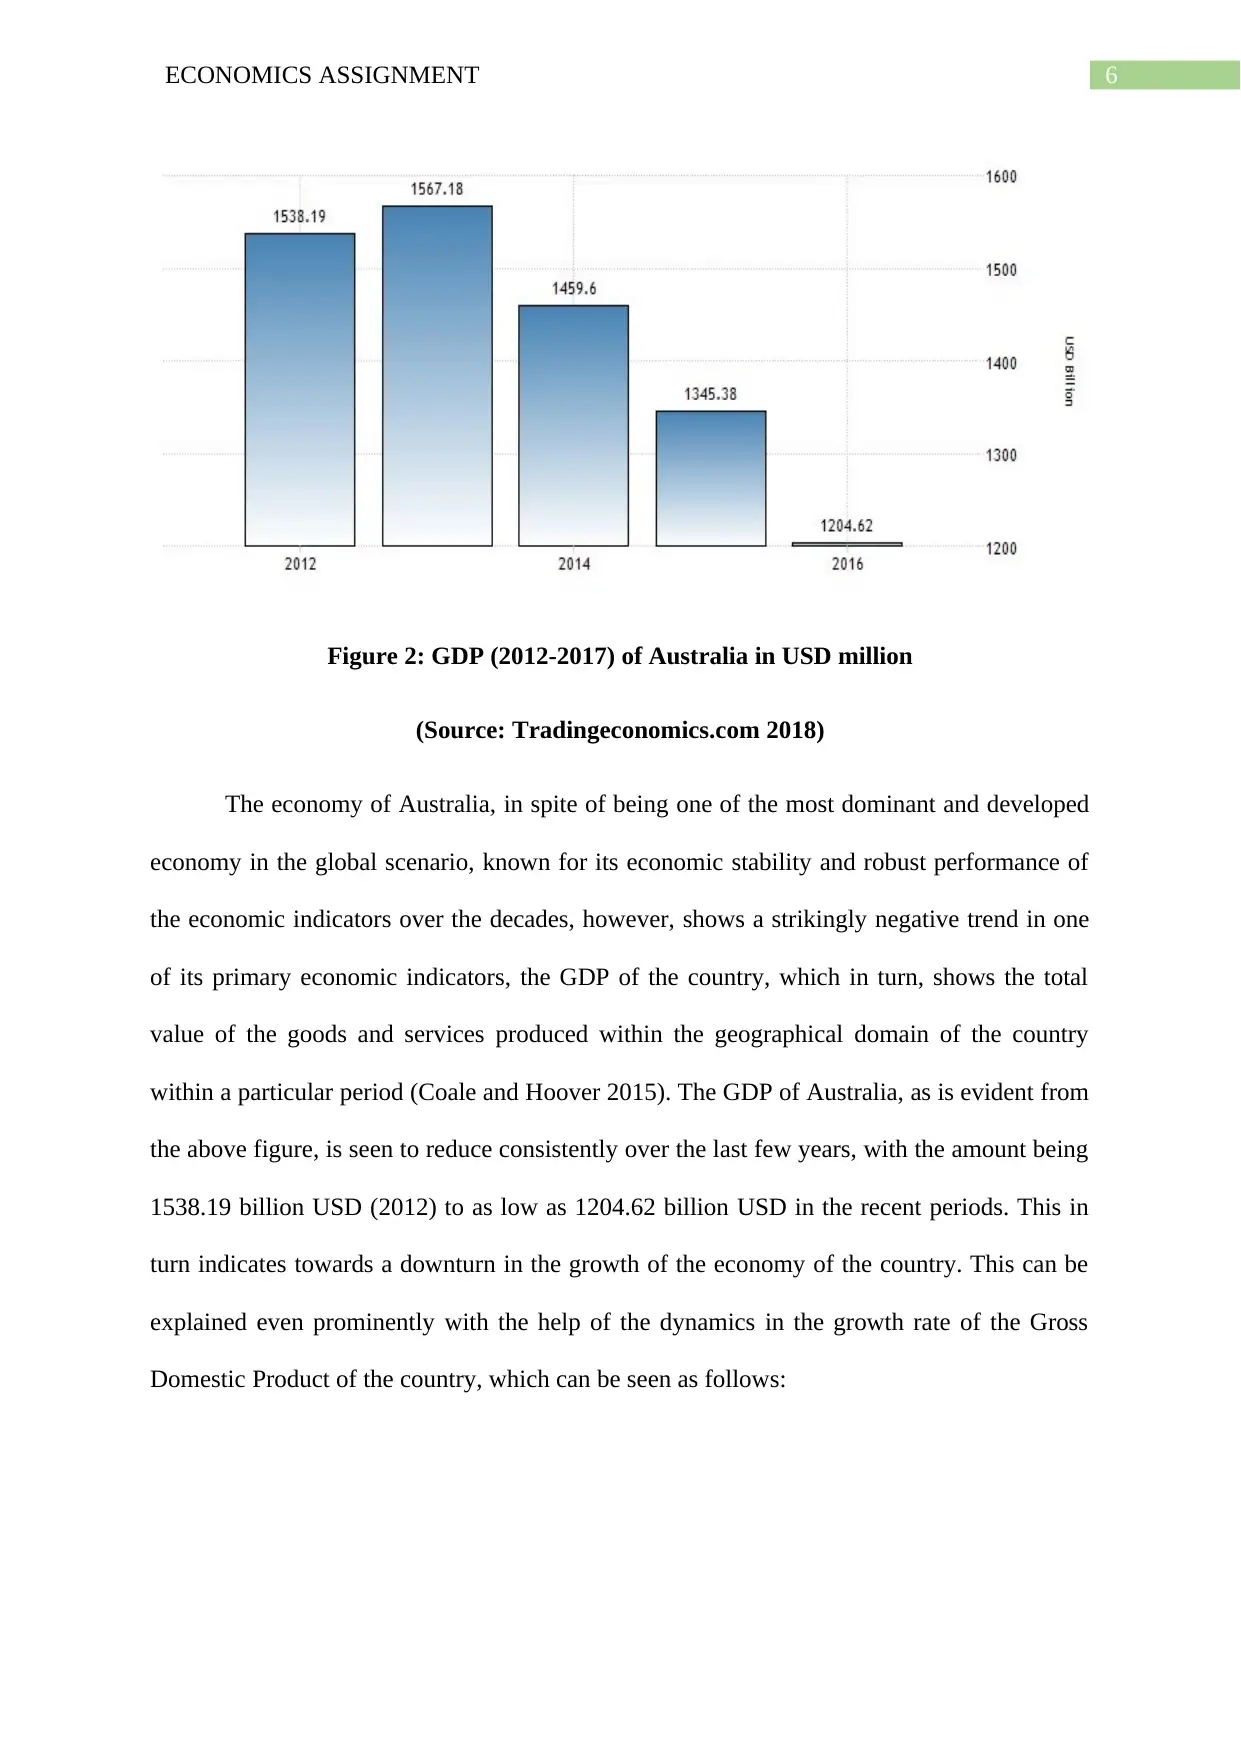
Figure 3: Growth rate of GDP (2012-2017) in Australia
(Source: Tradingeconomics.com 2018)
As can be seen from the above figure, the growth rate of GDP of the country has
experienced considerable fluctuations over the last five years, with the fluctuations being
much more evident post 2016, as can be seen from the huge dip in the growth rate in end
quarter of 2016, which was however overcame by the economy quickly in the succeeding
periods (Ianchovichina and Walmsley 2012).
Thus, from the above statistical evidences, it can be asserted the economy of the
country, has not bee experiencing a positive trend in its GDP and GDP growth dynamics over
the last few years. However, the growth of GDP alone cannot fully reflect the overall
economic growth and economic well being of the population of a country at a point of time
(Downes, Hanslow and Tulip 2014). The growth and development of the economy of a
country also depends on the distribution of the GDP across the population of the country,
which is to some extent, measured by the Per-Capita GDP of the country, which in turn
indicates the average income of the members of the population of the country. In case of
Australia, this can be seen from the following figure:
8ECONOMICS ASSIGNMENT
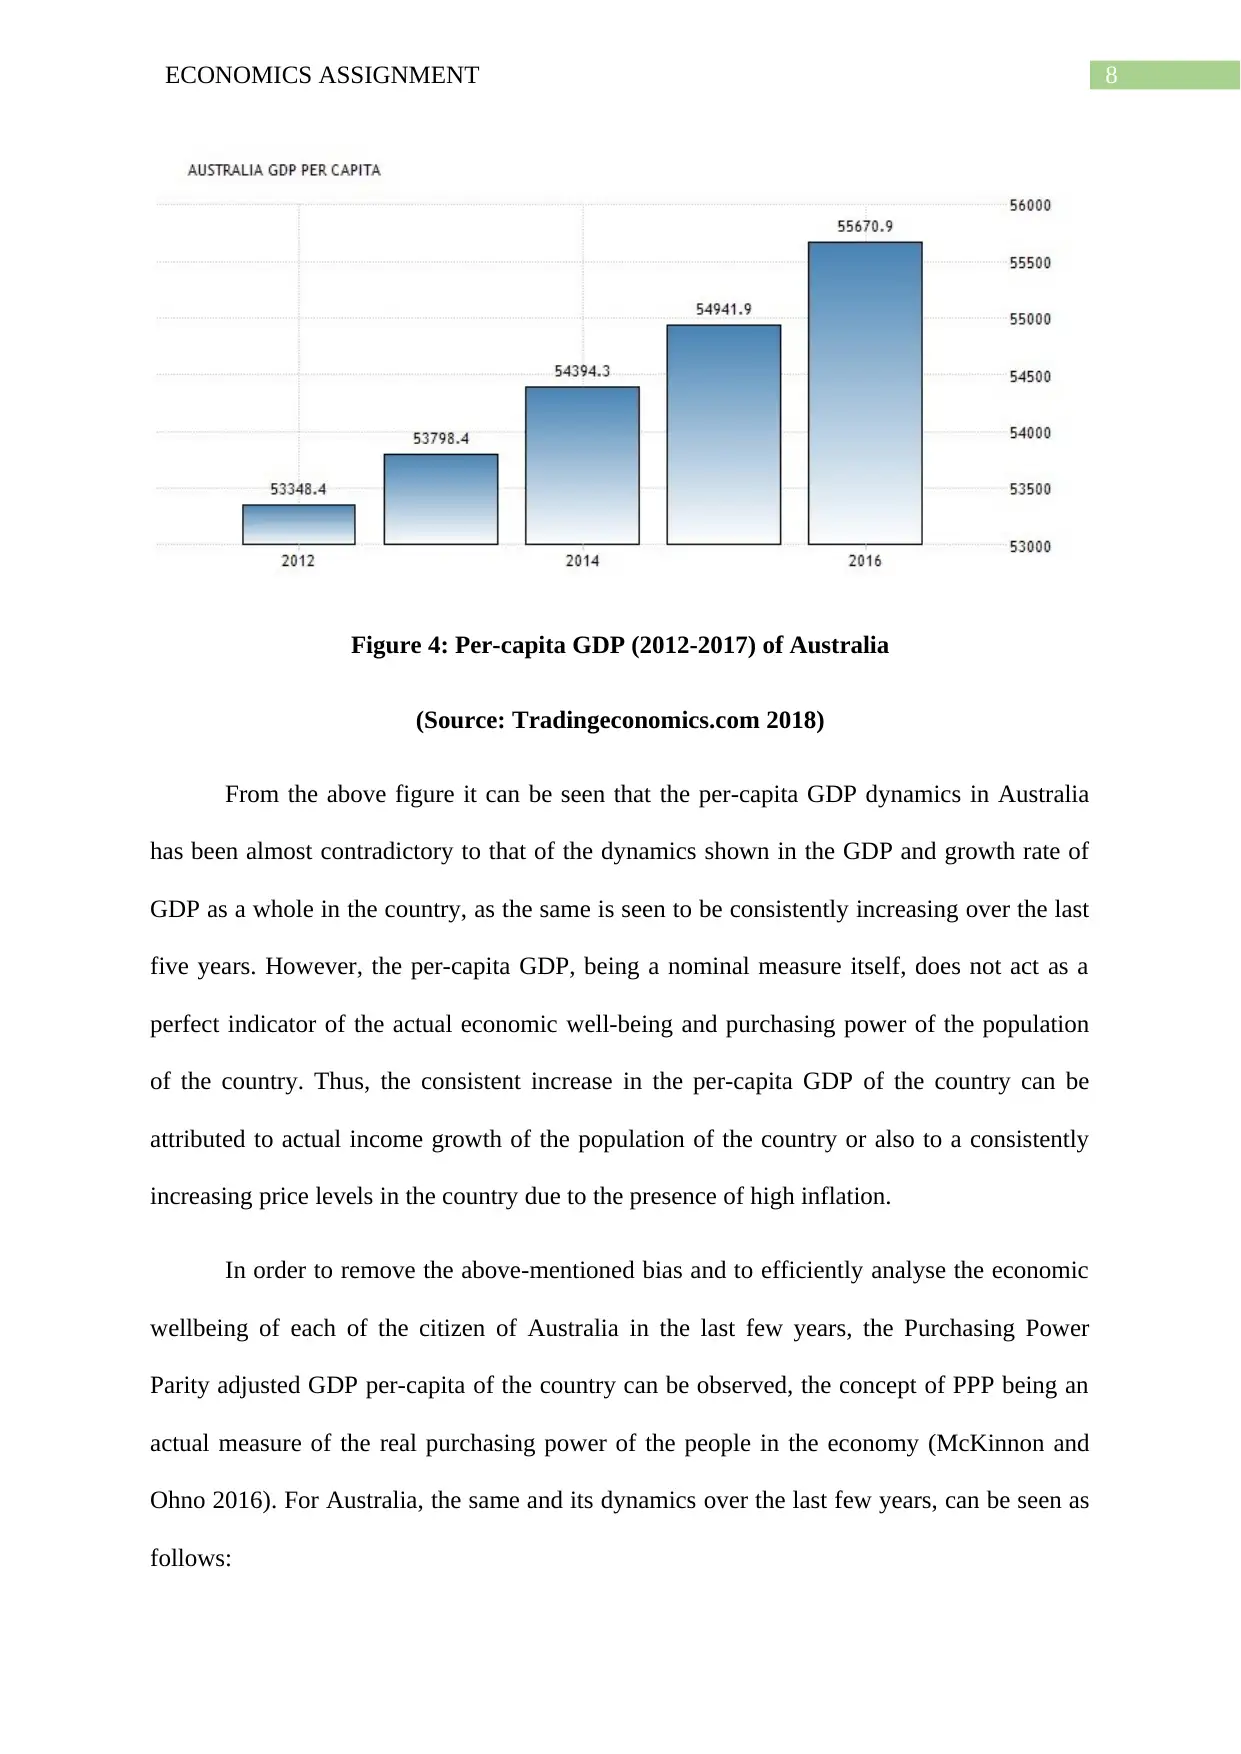
Figure 4: Per-capita GDP (2012-2017) of Australia
(Source: Tradingeconomics.com 2018)
From the above figure it can be seen that the per-capita GDP dynamics in Australia
has been almost contradictory to that of the dynamics shown in the GDP and growth rate of
GDP as a whole in the country, as the same is seen to be consistently increasing over the last
five years. However, the per-capita GDP, being a nominal measure itself, does not act as a
perfect indicator of the actual economic well-being and purchasing power of the population
of the country. Thus, the consistent increase in the per-capita GDP of the country can be
attributed to actual income growth of the population of the country or also to a consistently
increasing price levels in the country due to the presence of high inflation.
In order to remove the above-mentioned bias and to efficiently analyse the economic
wellbeing of each of the citizen of Australia in the last few years, the Purchasing Power
Parity adjusted GDP per-capita of the country can be observed, the concept of PPP being an
actual measure of the real purchasing power of the people in the economy (McKinnon and
Ohno 2016). For Australia, the same and its dynamics over the last few years, can be seen as
follows:
⊘ This is a preview!⊘
Do you want full access?
Subscribe today to unlock all pages.
Trusted by 1+ million students worldwide
9ECONOMICS ASSIGNMENT
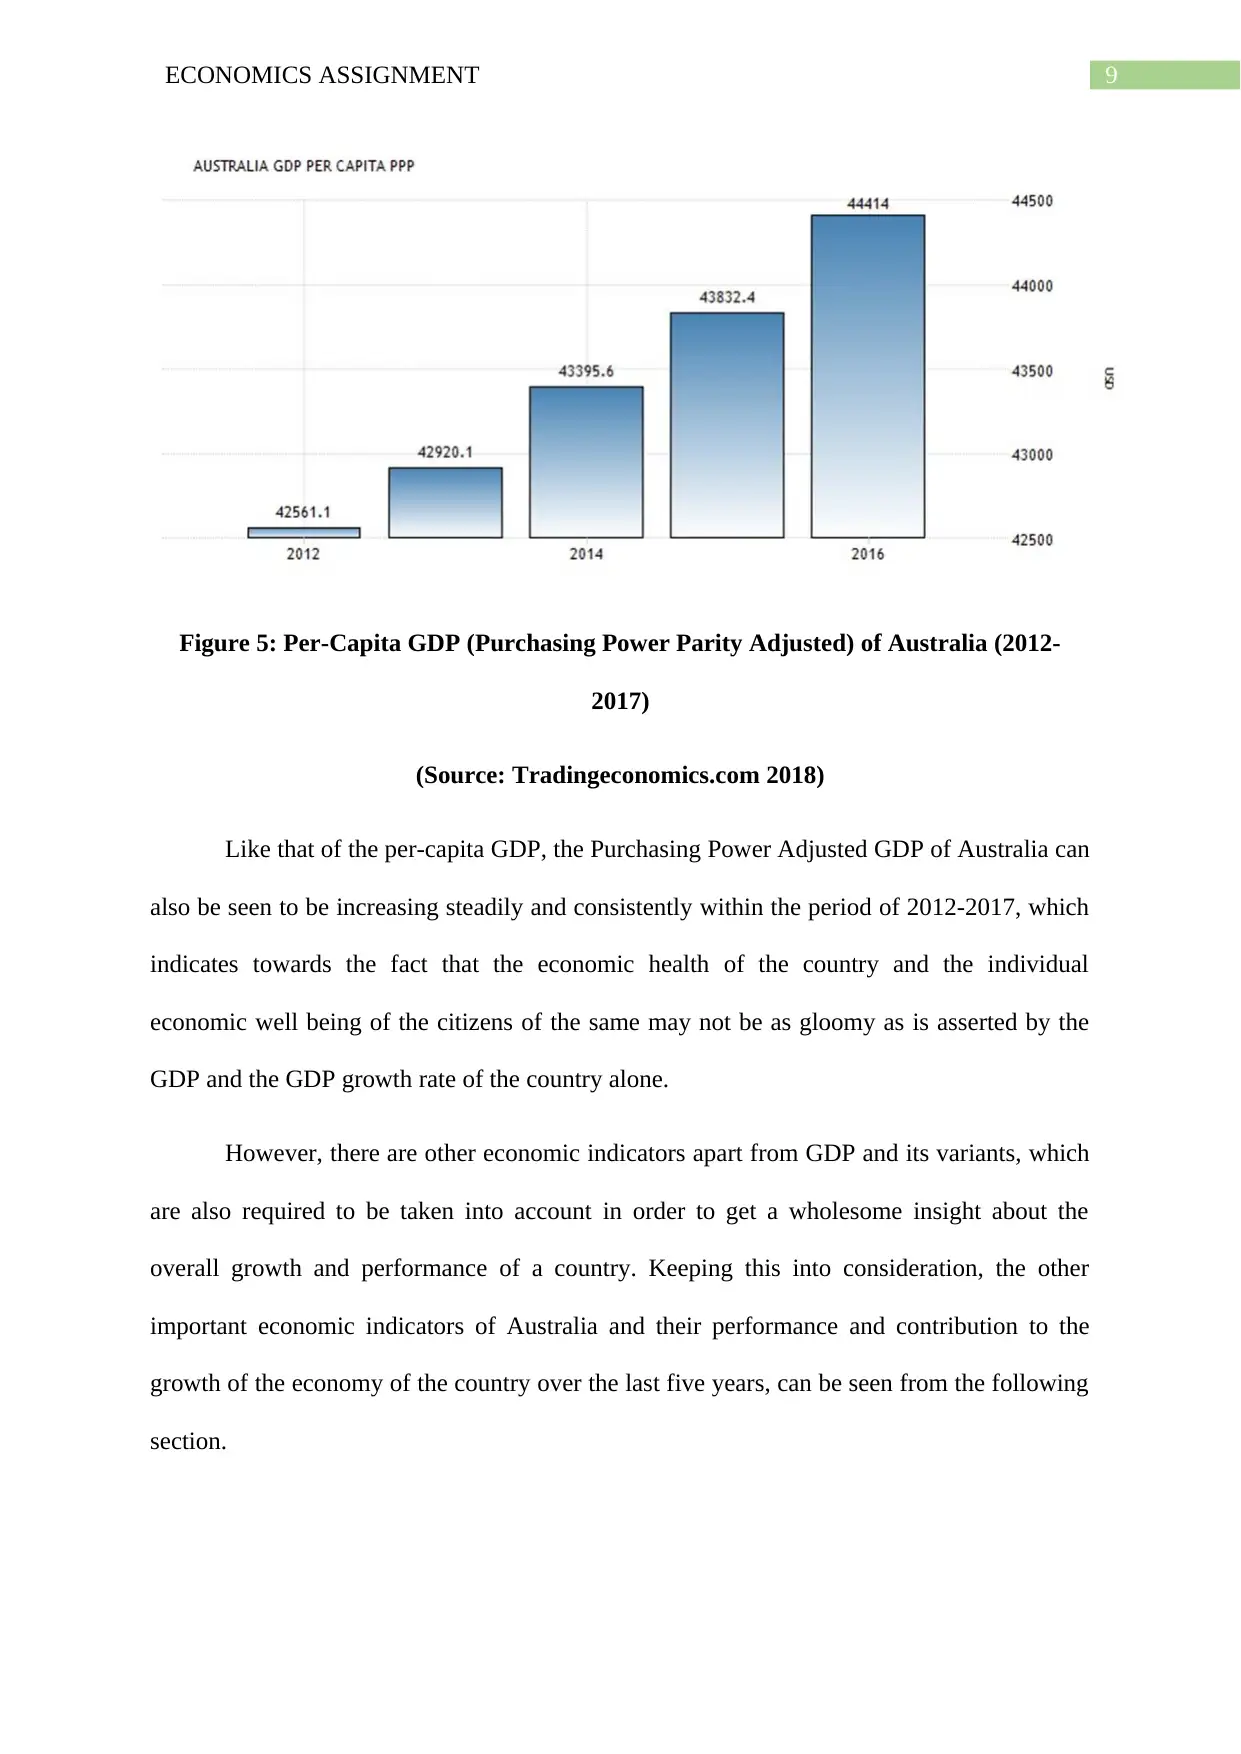
Figure 5: Per-Capita GDP (Purchasing Power Parity Adjusted) of Australia (2012-
2017)
(Source: Tradingeconomics.com 2018)
Like that of the per-capita GDP, the Purchasing Power Adjusted GDP of Australia can
also be seen to be increasing steadily and consistently within the period of 2012-2017, which
indicates towards the fact that the economic health of the country and the individual
economic well being of the citizens of the same may not be as gloomy as is asserted by the
GDP and the GDP growth rate of the country alone.
However, there are other economic indicators apart from GDP and its variants, which
are also required to be taken into account in order to get a wholesome insight about the
overall growth and performance of a country. Keeping this into consideration, the other
important economic indicators of Australia and their performance and contribution to the
growth of the economy of the country over the last five years, can be seen from the following
section.
Paraphrase This Document
Need a fresh take? Get an instant paraphrase of this document with our AI Paraphraser
10ECONOMICS ASSIGNMENT
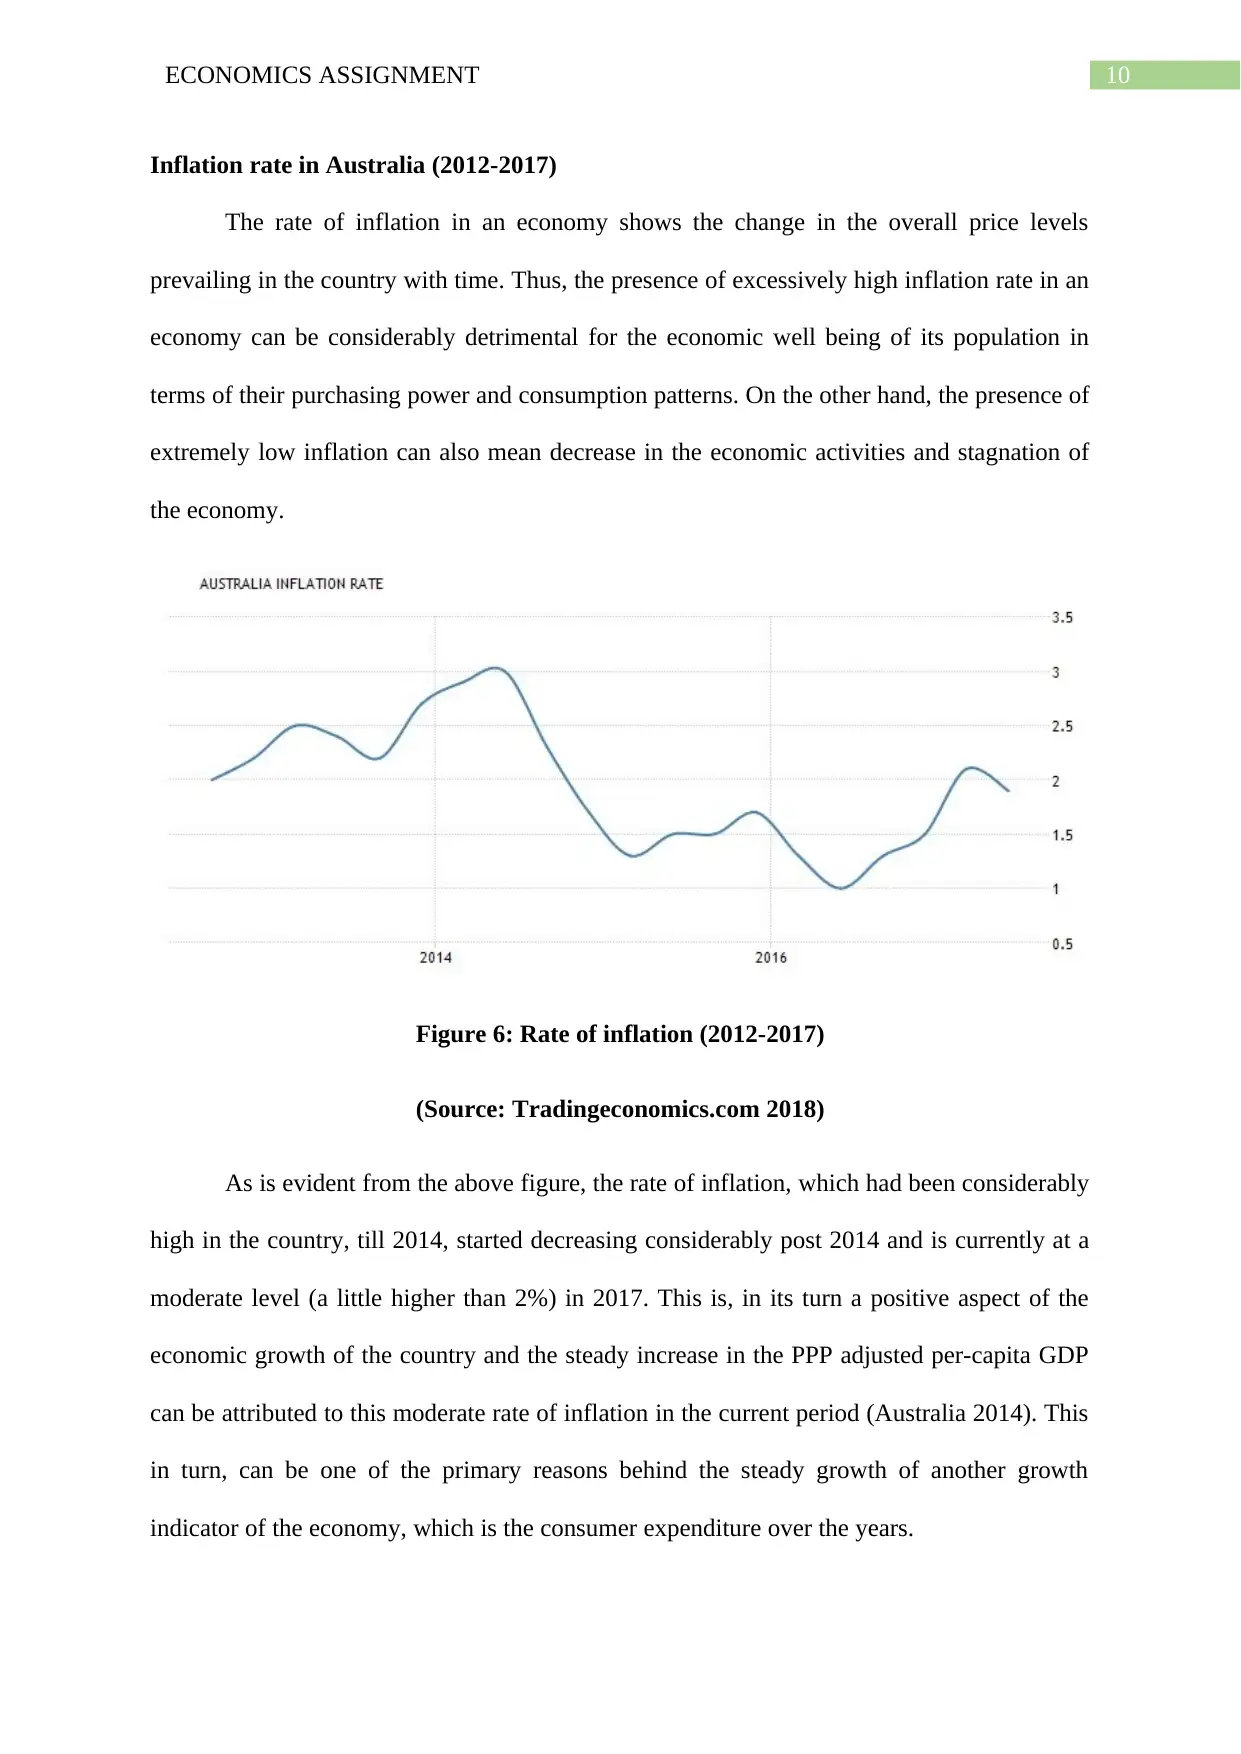
Inflation rate in Australia (2012-2017)
The rate of inflation in an economy shows the change in the overall price levels
prevailing in the country with time. Thus, the presence of excessively high inflation rate in an
economy can be considerably detrimental for the economic well being of its population in
terms of their purchasing power and consumption patterns. On the other hand, the presence of
extremely low inflation can also mean decrease in the economic activities and stagnation of
the economy.
Figure 6: Rate of inflation (2012-2017)
(Source: Tradingeconomics.com 2018)
As is evident from the above figure, the rate of inflation, which had been considerably
high in the country, till 2014, started decreasing considerably post 2014 and is currently at a
moderate level (a little higher than 2%) in 2017. This is, in its turn a positive aspect of the
economic growth of the country and the steady increase in the PPP adjusted per-capita GDP
can be attributed to this moderate rate of inflation in the current period (Australia 2014). This
in turn, can be one of the primary reasons behind the steady growth of another growth
indicator of the economy, which is the consumer expenditure over the years.
11ECONOMICS ASSIGNMENT
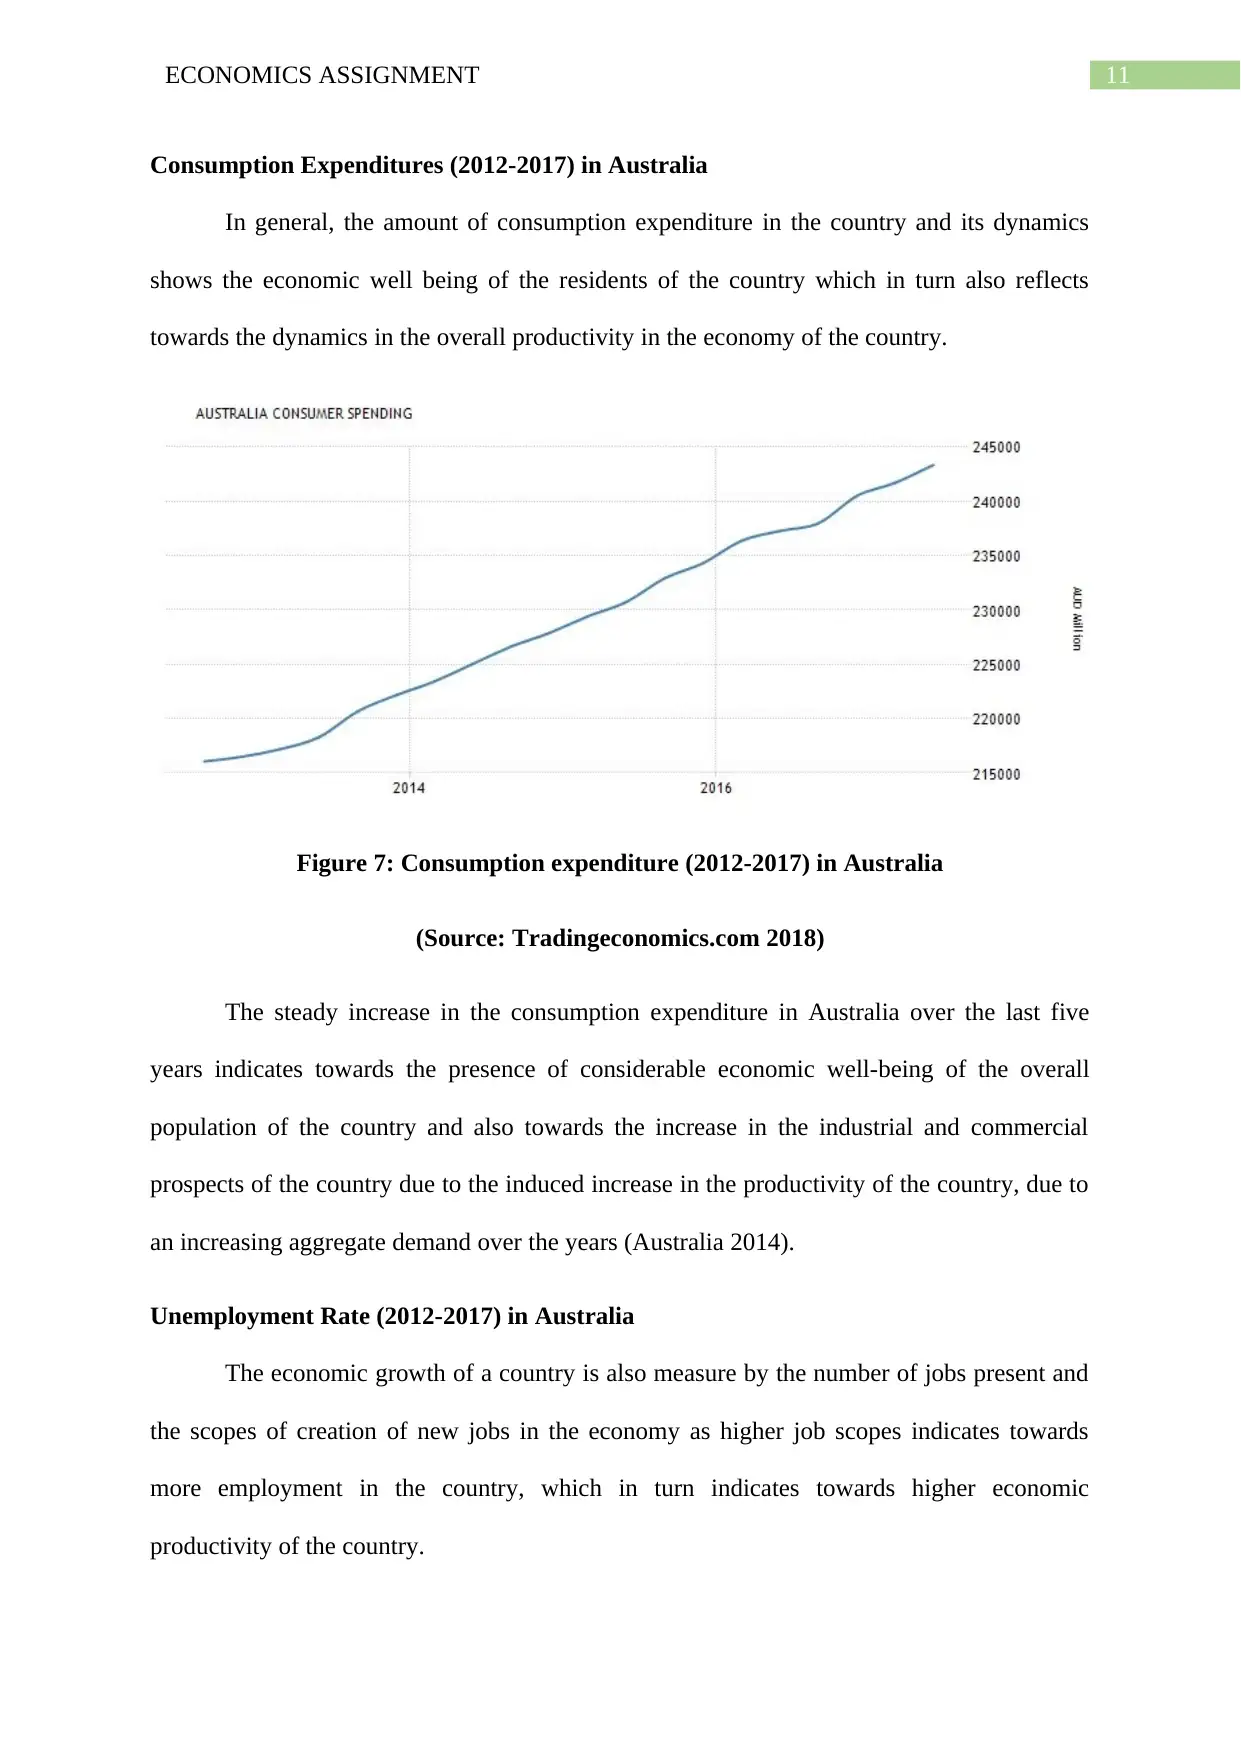
Consumption Expenditures (2012-2017) in Australia
In general, the amount of consumption expenditure in the country and its dynamics
shows the economic well being of the residents of the country which in turn also reflects
towards the dynamics in the overall productivity in the economy of the country.
Figure 7: Consumption expenditure (2012-2017) in Australia
(Source: Tradingeconomics.com 2018)
The steady increase in the consumption expenditure in Australia over the last five
years indicates towards the presence of considerable economic well-being of the overall
population of the country and also towards the increase in the industrial and commercial
prospects of the country due to the induced increase in the productivity of the country, due to
an increasing aggregate demand over the years (Australia 2014).
Unemployment Rate (2012-2017) in Australia
The economic growth of a country is also measure by the number of jobs present and
the scopes of creation of new jobs in the economy as higher job scopes indicates towards
more employment in the country, which in turn indicates towards higher economic
productivity of the country.
⊘ This is a preview!⊘
Do you want full access?
Subscribe today to unlock all pages.
Trusted by 1+ million students worldwide
1 out of 22
Related Documents


Your All-in-One AI-Powered Toolkit for Academic Success.
+13062052269
info@desklib.com
Available 24*7 on WhatsApp / Email
![[object Object]](/_next/static/media/star-bottom.7253800d.svg)
Unlock your academic potential
Copyright © 2020–2026 A2Z Services. All Rights Reserved. Developed and managed by ZUCOL.