Report on Economic Inequality and its Impact in Australia
VerifiedAdded on 2023/01/12
|5
|1123
|91
Report
AI Summary
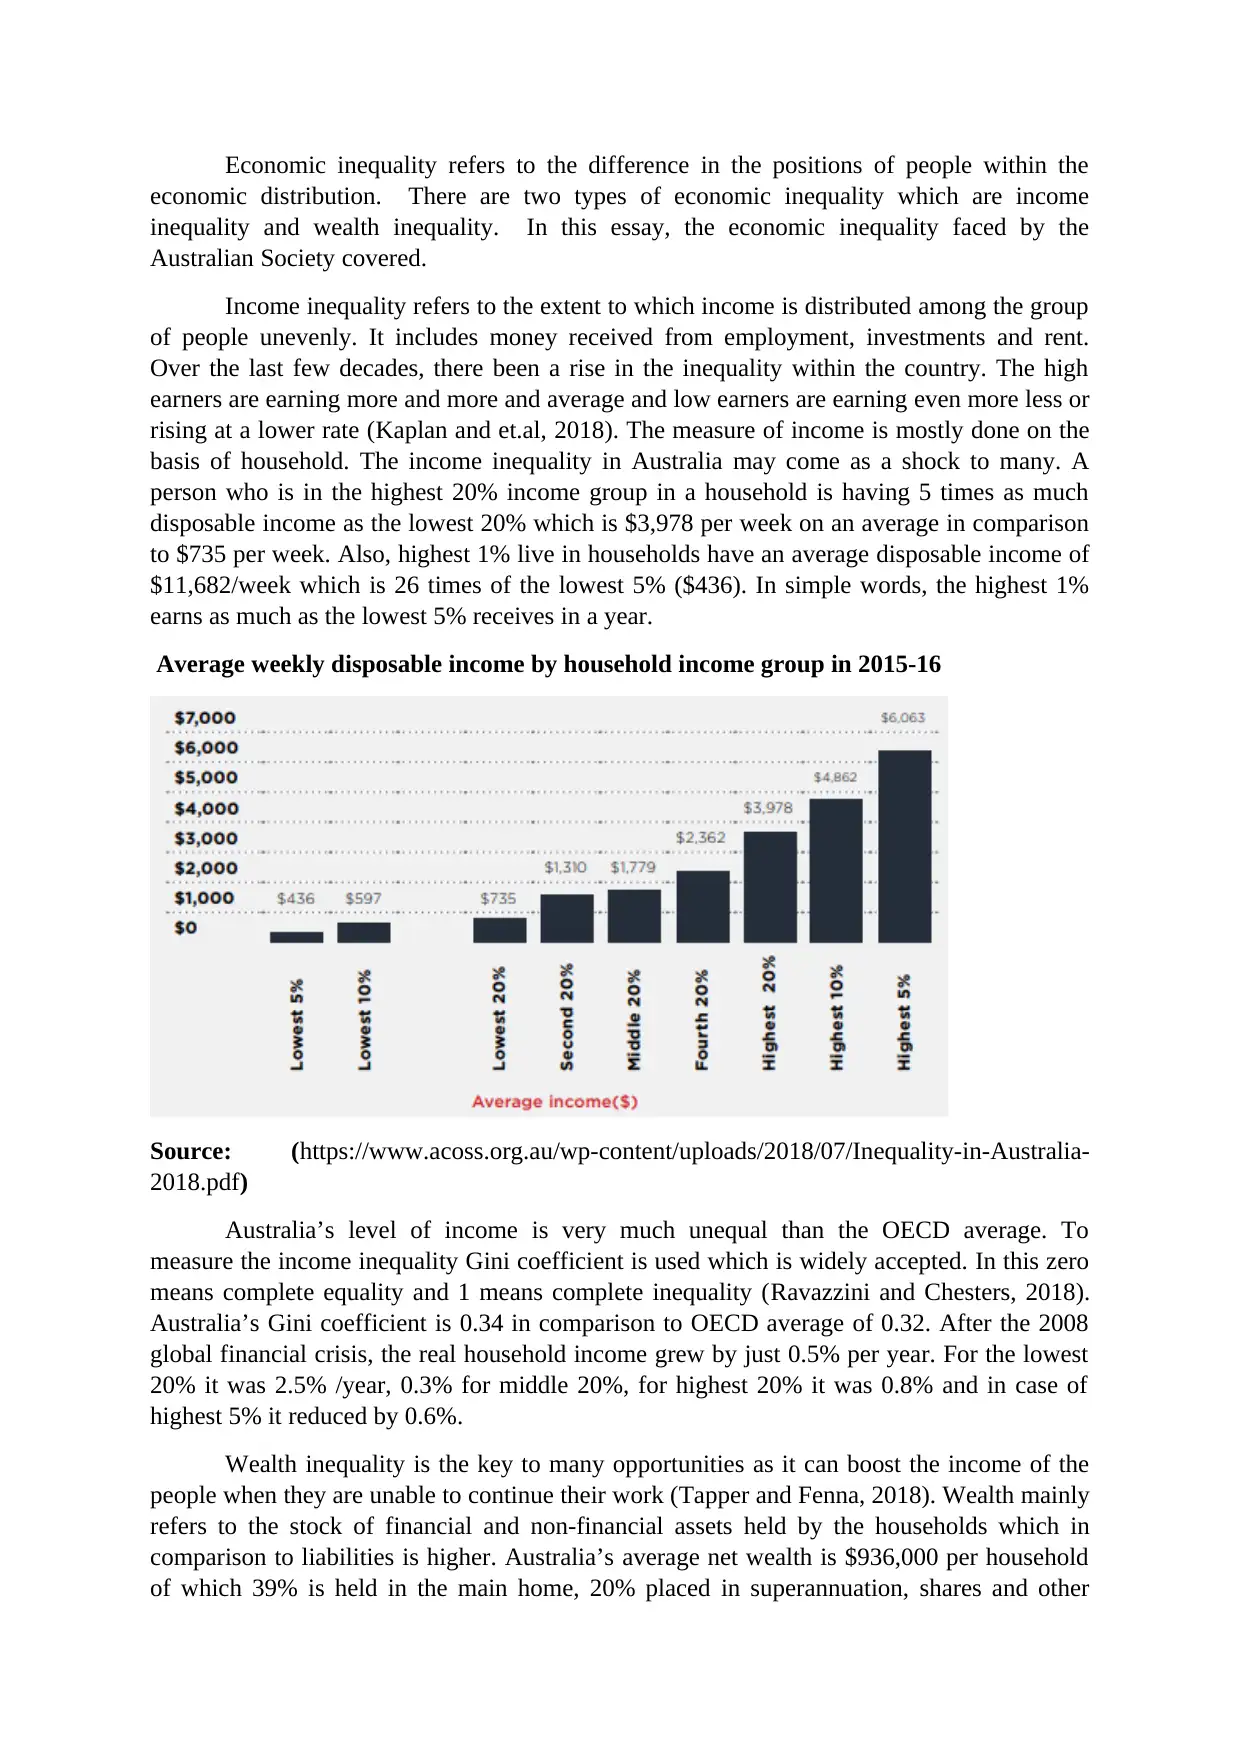
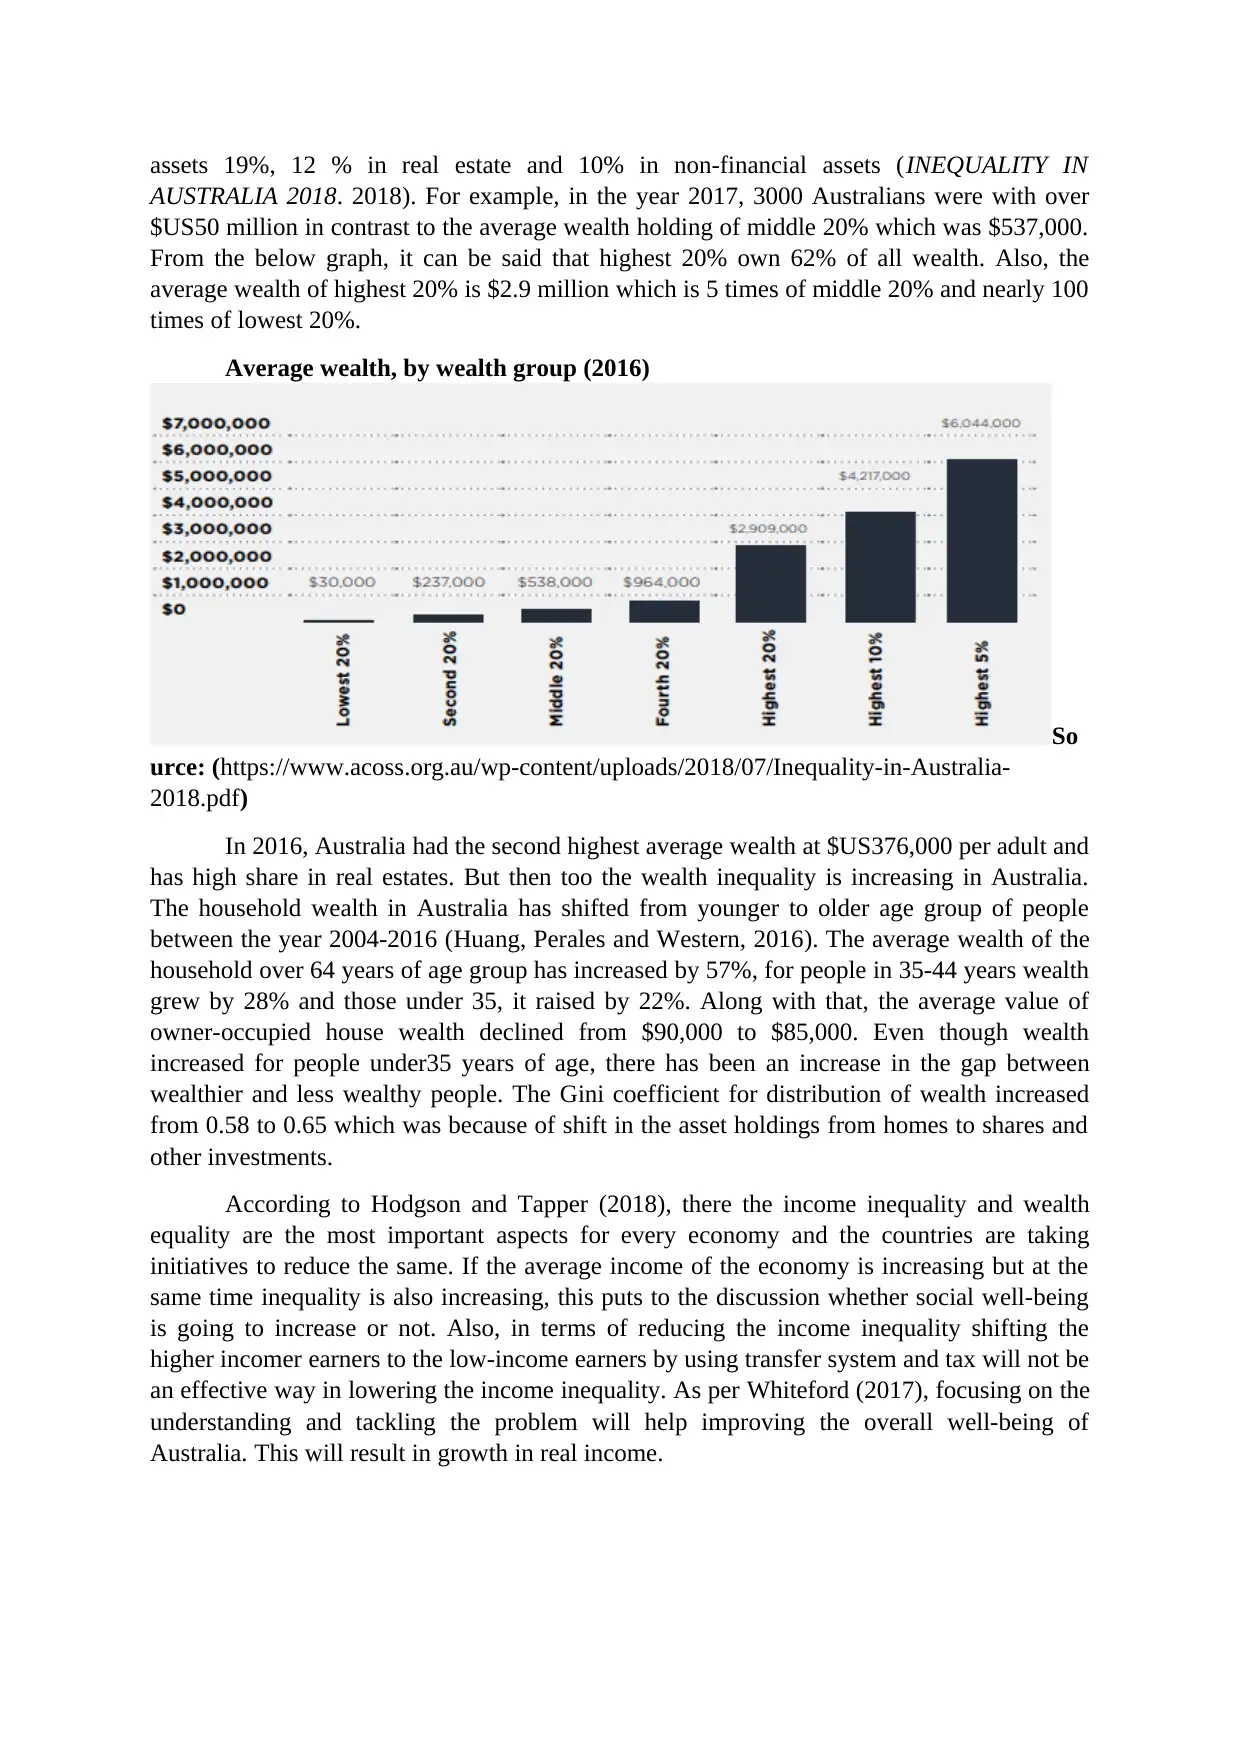
This report provides an overview of economic inequality in Australia, examining both income and wealth disparities. It defines income inequality as the uneven distribution of income from various sources like employment and investments, and wealth inequality as the disparity in the distribution of assets. The report highlights the growing income gap, with the highest earners significantly out-earning the average and low earners, and the substantial difference in disposable income between the highest and lowest income groups. It also discusses wealth inequality, showing that the wealthiest 20% of Australians own a disproportionate share of the country's wealth. The analysis includes the Gini coefficient to measure inequality and compares Australia's situation with the OECD average. The report also references several studies and data sources to support its findings, which reveal the challenges of income and wealth distribution in Australia.

Economic inequality in Australia
Paraphrase This Document
Need a fresh take? Get an instant paraphrase of this document with our AI Paraphraser

TABLE OF CONTENTS
REFERENCES...........................................................................................................................5

Economic inequality refers to the difference in the positions of people within the
economic distribution. There are two types of economic inequality which are income
inequality and wealth inequality. In this essay, the economic inequality faced by the
Australian Society covered.
Income inequality refers to the extent to which income is distributed among the group
of people unevenly. It includes money received from employment, investments and rent.
Over the last few decades, there been a rise in the inequality within the country. The high
earners are earning more and more and average and low earners are earning even more less or
rising at a lower rate (Kaplan and et.al, 2018). The measure of income is mostly done on the
basis of household. The income inequality in Australia may come as a shock to many. A
person who is in the highest 20% income group in a household is having 5 times as much
disposable income as the lowest 20% which is $3,978 per week on an average in comparison
to $735 per week. Also, highest 1% live in households have an average disposable income of
$11,682/week which is 26 times of the lowest 5% ($436). In simple words, the highest 1%
earns as much as the lowest 5% receives in a year.
Average weekly disposable income by household income group in 2015-16
Source: (https://www.acoss.org.au/wp-content/uploads/2018/07/Inequality-in-Australia-
2018.pdf)
Australia’s level of income is very much unequal than the OECD average. To
measure the income inequality Gini coefficient is used which is widely accepted. In this zero
means complete equality and 1 means complete inequality (Ravazzini and Chesters, 2018).
Australia’s Gini coefficient is 0.34 in comparison to OECD average of 0.32. After the 2008
global financial crisis, the real household income grew by just 0.5% per year. For the lowest
20% it was 2.5% /year, 0.3% for middle 20%, for highest 20% it was 0.8% and in case of
highest 5% it reduced by 0.6%.
Wealth inequality is the key to many opportunities as it can boost the income of the
people when they are unable to continue their work (Tapper and Fenna, 2018). Wealth mainly
refers to the stock of financial and non-financial assets held by the households which in
comparison to liabilities is higher. Australia’s average net wealth is $936,000 per household
of which 39% is held in the main home, 20% placed in superannuation, shares and other
⊘ This is a preview!⊘
Do you want full access?
Subscribe today to unlock all pages.

Trusted by 1+ million students worldwide

assets 19%, 12 % in real estate and 10% in non-financial assets (INEQUALITY IN
AUSTRALIA 2018. 2018). For example, in the year 2017, 3000 Australians were with over
$US50 million in contrast to the average wealth holding of middle 20% which was $537,000.
From the below graph, it can be said that highest 20% own 62% of all wealth. Also, the
average wealth of highest 20% is $2.9 million which is 5 times of middle 20% and nearly 100
times of lowest 20%.
Average wealth, by wealth group (2016)
So
urce: (https://www.acoss.org.au/wp-content/uploads/2018/07/Inequality-in-Australia-
2018.pdf)
In 2016, Australia had the second highest average wealth at $US376,000 per adult and
has high share in real estates. But then too the wealth inequality is increasing in Australia.
The household wealth in Australia has shifted from younger to older age group of people
between the year 2004-2016 (Huang, Perales and Western, 2016). The average wealth of the
household over 64 years of age group has increased by 57%, for people in 35-44 years wealth
grew by 28% and those under 35, it raised by 22%. Along with that, the average value of
owner-occupied house wealth declined from $90,000 to $85,000. Even though wealth
increased for people under35 years of age, there has been an increase in the gap between
wealthier and less wealthy people. The Gini coefficient for distribution of wealth increased
from 0.58 to 0.65 which was because of shift in the asset holdings from homes to shares and
other investments.
According to Hodgson and Tapper (2018), there the income inequality and wealth
equality are the most important aspects for every economy and the countries are taking
initiatives to reduce the same. If the average income of the economy is increasing but at the
same time inequality is also increasing, this puts to the discussion whether social well-being
is going to increase or not. Also, in terms of reducing the income inequality shifting the
higher incomer earners to the low-income earners by using transfer system and tax will not be
an effective way in lowering the income inequality. As per Whiteford (2017), focusing on the
understanding and tackling the problem will help improving the overall well-being of
Australia. This will result in growth in real income.
Paraphrase This Document
Need a fresh take? Get an instant paraphrase of this document with our AI Paraphraser

REFERENCES
Books and Journals
Hodgson, H. and Tapper, A., 2018. Superannuation and economic inequality among older
Australians: evidence from HILDA. eJTR. 16. p.236.
Huang, Y., Perales, F. and Western, M., 2016. A land of the ‘fair go’? Intergenerational
earnings elasticity in Australia. Australian Journal of Social Issues. 51(3). pp.361-381.
Kaplan, G. and et.al, 2018. Household economic inequality in Australia. Economic
Record. 94(305), pp.117-134.
Ravazzini, L. and Chesters, J., 2018. Inequality and wealth: comparing the gender wealth gap
in Switzerland and Australia. Feminist Economics. 24(4). pp.83-107.
Tapper, A. and Fenna, A., 2018. Income, wealth and economic inequality in
Australia. Australian Journal of Social Issues. 53(4). pp.324-337.
Whiteford, P., 2017. trends in income inequality in australia. AQ-Australian Quarterly. 88(3).
p.30.
Online
INEQUALITY IN AUSTRALIA 2018. 2018. [Online]. Available Through:<
https://www.acoss.org.au/wp-content/uploads/2018/07/Inequality-in-Australia-
2018.pdf>.
1 out of 5
Related Documents

Your All-in-One AI-Powered Toolkit for Academic Success.
+13062052269
info@desklib.com
Available 24*7 on WhatsApp / Email
Unlock your academic potential
Copyright © 2020–2025 A2Z Services. All Rights Reserved. Developed and managed by ZUCOL.