Australia's Economic Performance: GDP, Inflation, and Trade
VerifiedAdded on 2020/05/28
|16
|3757
|91
Report
AI Summary
This report provides a comprehensive analysis of Australia's economic performance from 1990 to 2015. It examines key economic indicators, including real GDP growth, interest rates (cash rate), inflation, unemployment, exchange rates, and net exports. The analysis explores the relationships between these variables, utilizing correlation matrices and graphical representations of trends. The report delves into the impact of monetary policy, specifically focusing on the Reserve Bank of Australia's (RBA) actions and their influence on economic growth. Furthermore, it discusses the relationship between inflation and unemployment within the framework of the Phillips curve. The study considers the impact of global events, such as the 2008 financial crisis, on Australia's economic stability and growth. Finally, the report offers an economic outlook for Australia, drawing conclusions based on the observed trends and relationships. The research utilizes data from sources like the World Bank and RBA to support its findings.
Running Head: ECONOMIC PERFORMANCE OF AUSTRALIA
Economic Performance of Australia
Name of the Student
Name of the University
Author note
Economic Performance of Australia
Name of the Student
Name of the University
Author note
Paraphrase This Document
Need a fresh take? Get an instant paraphrase of this document with our AI Paraphraser
1ECONOMIC PERFORMANCE OF AUSTRALIA
Executive Summary
The Australian economy is one of the most stable and developed nation in the world. The country has an
intensive agriculture, developed manufacturing and industrial sector and a progressive service sector.
The economic sectors along with highly supportive government helps the nation to achieve and retain a
stable growth over time. In this paper, performance of Australia is examined using scale of GDP growth,
interest rate, inflation, unemployment and trade performance. The trend of the chosen indicators is
analyzed for a long time framework (from 1990-2015). Special attention is given on monetary policy tool.
Drawing references from current status of the economy the paper finally attempts to make a future
outlook for Australia.
2ECONOMIC PERFORMANCE OF AUSTRALIA
Table of Contents
Introduction.................................................................................................................................................. 3
Performance Analysis.................................................................................................................................. 3
Evaluation of economic relation between GDP and other important variables.........................................3
Relationship between inflation and unemployment..................................................................................9
Tight Monetary Policy in Australia.......................................................................................................... 10
Economic Outlook.................................................................................................................................. 11
Conclusion................................................................................................................................................. 11
References................................................................................................................................................ 12
Appendix.................................................................................................................................................... 14
⊘ This is a preview!⊘
Do you want full access?
Subscribe today to unlock all pages.
Trusted by 1+ million students worldwide
3ECONOMIC PERFORMANCE OF AUSTRALIA
Introduction
Australia is well known for its mixed economic structure and highly developed nature. It is one of
wealthier nations of world. Both in terms of nominal GDP and PPP-adjusted GDP Australia is ahead of
several nations. When compared with per capita GDP, Australia ranks ahead of Canada, Germany, UK
and France. Agriculture in Australia constitutes 3% of GDP. The large stock of natural resources
especially minerals helps to build a strong mining sector. Despite having several industries, the
contribution of manufacturing in economic growth has declined in recent years. This gap is filled with
growth of service sectors especially financial services. Four largest banks in Australia are listed among 50
safest banks of world. Australia has a comparative advantage over a range of goods and services
including products with high technology like scientific and medical equipment, processed food and high
quality wine. The service exports of Australia include tourism and education, financial and professional
services. Along with domestic sectors, trade has made significant contribution to economic growth of
Australia.
In the current research paper, performance trend of Australia is evaluate using some of the basic
indicators. Economic growth is captured from the movement of real GDP which in turn affects
employment and price level. Cash rate controlled by monetary authority influences investment and
growth. The performance of external sector depends on the trend exchange rate and balance of trade.
Performance Analysis
Evaluation of economic relation between GDP and other important variables
Gross Domestic product of a nation is measure of the value of goods and services of a nation in
money terms. All the produced goods and services are evaluated in terms of their market price. Now,
there are two approaches for computing GDP. One is to use market price for the accounting year and
other is to consider prices of a fixed based year. The former is called nominal GDP while the latter is
known as real GDP (Baumol and Blinder, 2016). Real GDP being adjusted for inflation is a more accurate
measure of economic output and hence growth. For this, while evaluating economic growth of Australia
real GDP is used.
1 99 0 1 99 5 2 00 0 2 00 5 2 01 0 2 01 5 2 02 0
-1.00
0.00
1.00
2.00
3.00
4.00
5.00
6.00
Real GDP growth rate
Year
Growth rate (%)
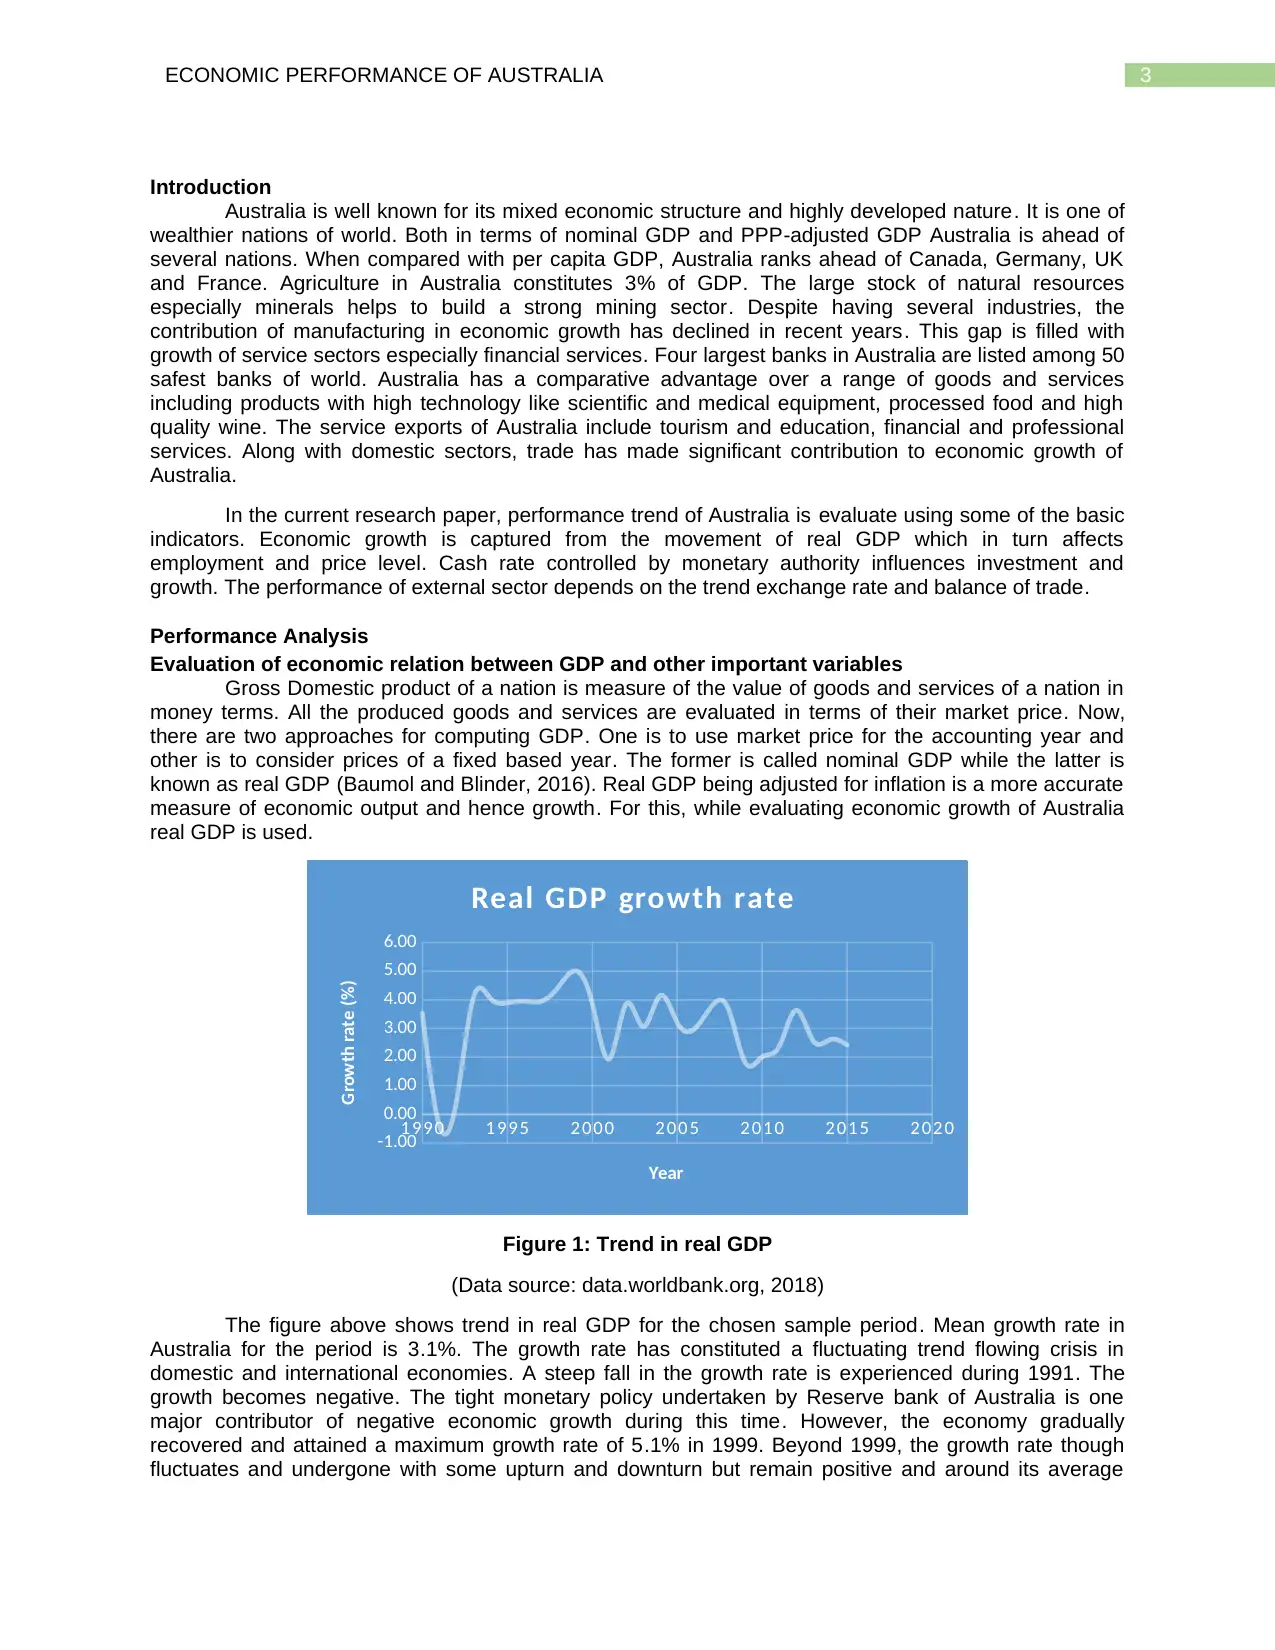
Figure 1: Trend in real GDP
(Data source: data.worldbank.org, 2018)
The figure above shows trend in real GDP for the chosen sample period. Mean growth rate in
Australia for the period is 3.1%. The growth rate has constituted a fluctuating trend flowing crisis in
domestic and international economies. A steep fall in the growth rate is experienced during 1991. The
growth becomes negative. The tight monetary policy undertaken by Reserve bank of Australia is one
major contributor of negative economic growth during this time. However, the economy gradually
recovered and attained a maximum growth rate of 5.1% in 1999. Beyond 1999, the growth rate though
fluctuates and undergone with some upturn and downturn but remain positive and around its average
Introduction
Australia is well known for its mixed economic structure and highly developed nature. It is one of
wealthier nations of world. Both in terms of nominal GDP and PPP-adjusted GDP Australia is ahead of
several nations. When compared with per capita GDP, Australia ranks ahead of Canada, Germany, UK
and France. Agriculture in Australia constitutes 3% of GDP. The large stock of natural resources
especially minerals helps to build a strong mining sector. Despite having several industries, the
contribution of manufacturing in economic growth has declined in recent years. This gap is filled with
growth of service sectors especially financial services. Four largest banks in Australia are listed among 50
safest banks of world. Australia has a comparative advantage over a range of goods and services
including products with high technology like scientific and medical equipment, processed food and high
quality wine. The service exports of Australia include tourism and education, financial and professional
services. Along with domestic sectors, trade has made significant contribution to economic growth of
Australia.
In the current research paper, performance trend of Australia is evaluate using some of the basic
indicators. Economic growth is captured from the movement of real GDP which in turn affects
employment and price level. Cash rate controlled by monetary authority influences investment and
growth. The performance of external sector depends on the trend exchange rate and balance of trade.
Performance Analysis
Evaluation of economic relation between GDP and other important variables
Gross Domestic product of a nation is measure of the value of goods and services of a nation in
money terms. All the produced goods and services are evaluated in terms of their market price. Now,
there are two approaches for computing GDP. One is to use market price for the accounting year and
other is to consider prices of a fixed based year. The former is called nominal GDP while the latter is
known as real GDP (Baumol and Blinder, 2016). Real GDP being adjusted for inflation is a more accurate
measure of economic output and hence growth. For this, while evaluating economic growth of Australia
real GDP is used.
1 99 0 1 99 5 2 00 0 2 00 5 2 01 0 2 01 5 2 02 0
-1.00
0.00
1.00
2.00
3.00
4.00
5.00
6.00
Real GDP growth rate
Year
Growth rate (%)
Figure 1: Trend in real GDP
(Data source: data.worldbank.org, 2018)
The figure above shows trend in real GDP for the chosen sample period. Mean growth rate in
Australia for the period is 3.1%. The growth rate has constituted a fluctuating trend flowing crisis in
domestic and international economies. A steep fall in the growth rate is experienced during 1991. The
growth becomes negative. The tight monetary policy undertaken by Reserve bank of Australia is one
major contributor of negative economic growth during this time. However, the economy gradually
recovered and attained a maximum growth rate of 5.1% in 1999. Beyond 1999, the growth rate though
fluctuates and undergone with some upturn and downturn but remain positive and around its average
Paraphrase This Document
Need a fresh take? Get an instant paraphrase of this document with our AI Paraphraser
4ECONOMIC PERFORMANCE OF AUSTRALIA
trend. Australia being closely related with United States was supposed to be affected from mortgage crisis
occurred in US during 2008 (Easterly and Levine, 2016). However, the support from Australian
government in the form of a stimulatory package of $11.8 billion and a relatively strong banking and
financial sector has helped to minimize the recession risk. Growth rate though fell after 2008 but remain
positive and close to 2%.
GDP is the sum of expenditure incurred in an economy in the given year . It includes consumption
expenditure, investment expenditure, government spending and net export. Therefore, each component
has direct relation with GDP (Acemoglu, Laibson and List, 2017). After analyzing trend growth rate now
the relation between GDP and other macro variables are examined.
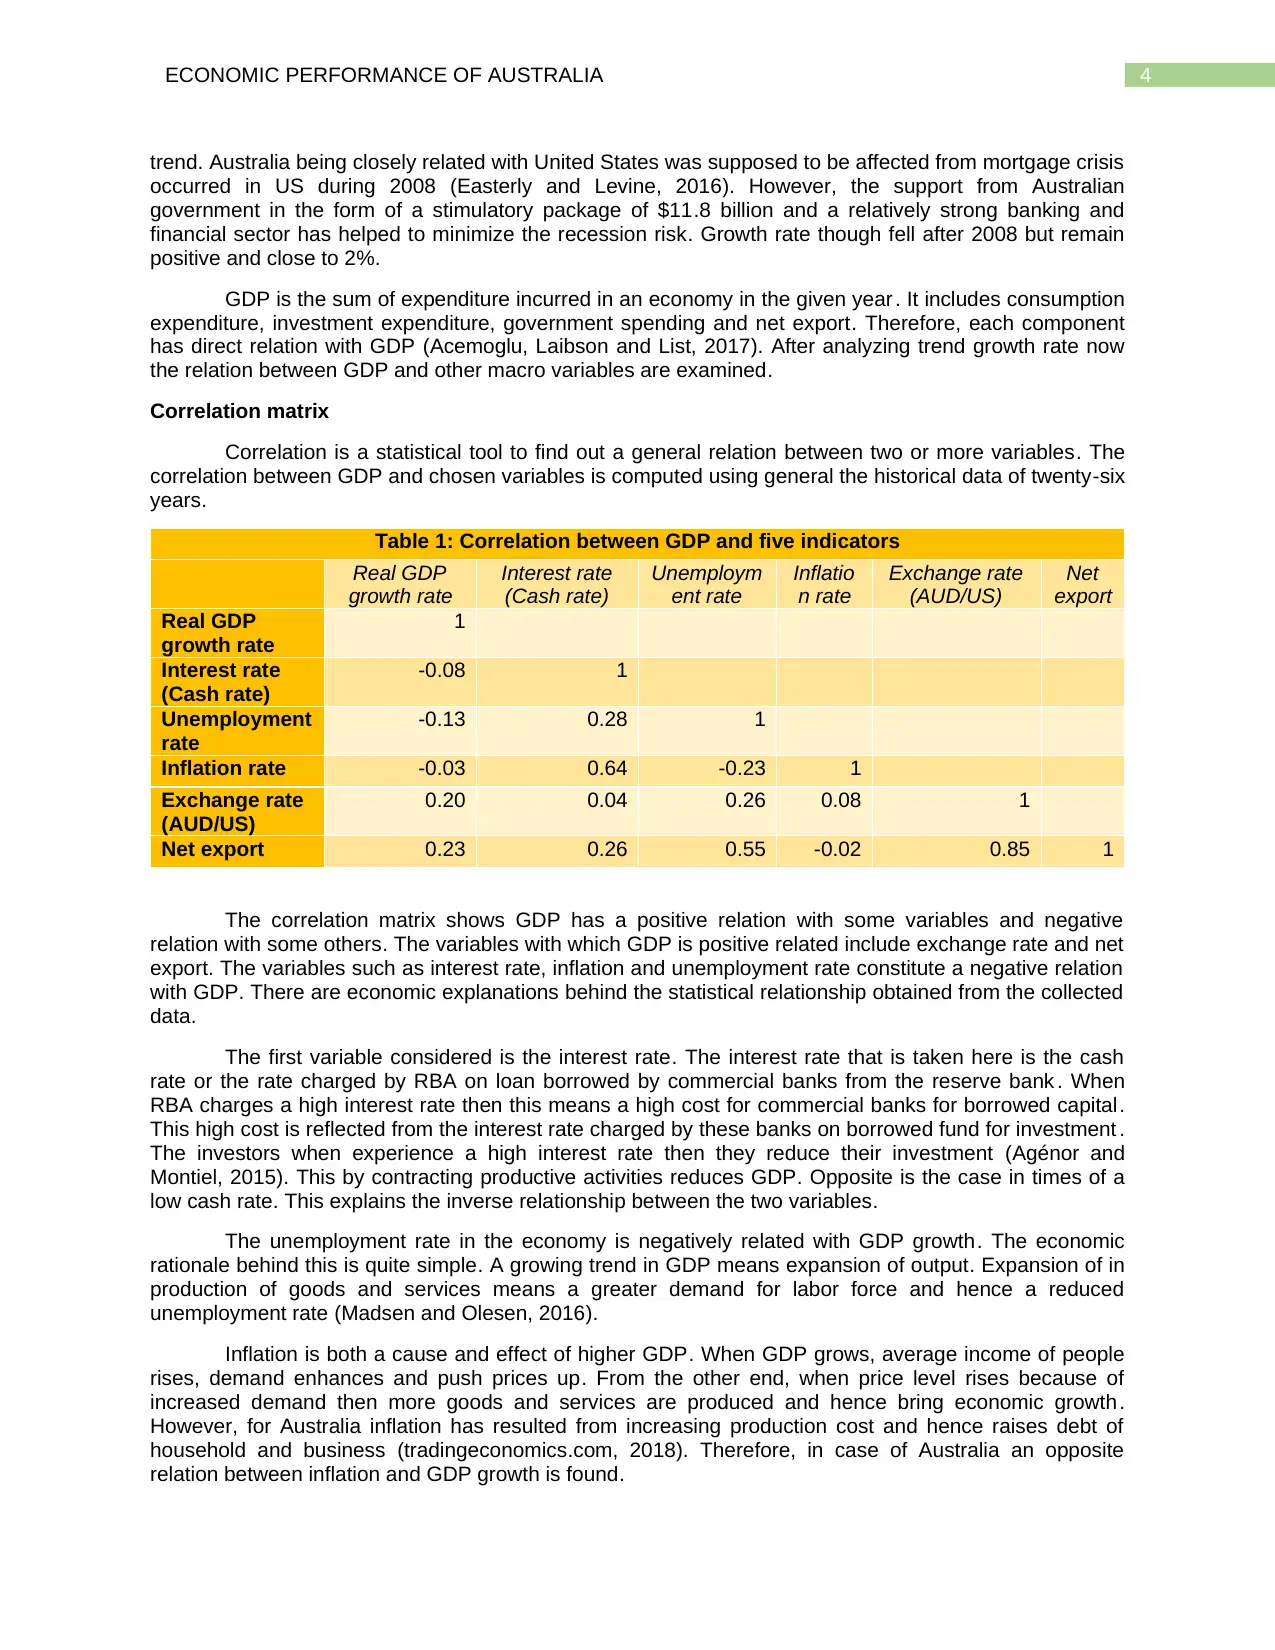
Correlation matrix
Correlation is a statistical tool to find out a general relation between two or more variables. The
correlation between GDP and chosen variables is computed using general the historical data of twenty-six
years.
Table 1: Correlation between GDP and five indicators
Real GDP
growth rate
Interest rate
(Cash rate)
Unemploym
ent rate
Inflatio
n rate
Exchange rate
(AUD/US)
Net
export
Real GDP
growth rate
1
Interest rate
(Cash rate)
-0.08 1
Unemployment
rate
-0.13 0.28 1
Inflation rate -0.03 0.64 -0.23 1
Exchange rate
(AUD/US)
0.20 0.04 0.26 0.08 1
Net export 0.23 0.26 0.55 -0.02 0.85 1
The correlation matrix shows GDP has a positive relation with some variables and negative
relation with some others. The variables with which GDP is positive related include exchange rate and net
export. The variables such as interest rate, inflation and unemployment rate constitute a negative relation
with GDP. There are economic explanations behind the statistical relationship obtained from the collected
data.
The first variable considered is the interest rate. The interest rate that is taken here is the cash
rate or the rate charged by RBA on loan borrowed by commercial banks from the reserve bank . When
RBA charges a high interest rate then this means a high cost for commercial banks for borrowed capital.
This high cost is reflected from the interest rate charged by these banks on borrowed fund for investment .
The investors when experience a high interest rate then they reduce their investment (Agénor and
Montiel, 2015). This by contracting productive activities reduces GDP. Opposite is the case in times of a
low cash rate. This explains the inverse relationship between the two variables.
The unemployment rate in the economy is negatively related with GDP growth. The economic
rationale behind this is quite simple. A growing trend in GDP means expansion of output. Expansion of in
production of goods and services means a greater demand for labor force and hence a reduced
unemployment rate (Madsen and Olesen, 2016).
Inflation is both a cause and effect of higher GDP. When GDP grows, average income of people
rises, demand enhances and push prices up. From the other end, when price level rises because of
increased demand then more goods and services are produced and hence bring economic growth .
However, for Australia inflation has resulted from increasing production cost and hence raises debt of
household and business (tradingeconomics.com, 2018). Therefore, in case of Australia an opposite
relation between inflation and GDP growth is found.
trend. Australia being closely related with United States was supposed to be affected from mortgage crisis
occurred in US during 2008 (Easterly and Levine, 2016). However, the support from Australian
government in the form of a stimulatory package of $11.8 billion and a relatively strong banking and
financial sector has helped to minimize the recession risk. Growth rate though fell after 2008 but remain
positive and close to 2%.
GDP is the sum of expenditure incurred in an economy in the given year . It includes consumption
expenditure, investment expenditure, government spending and net export. Therefore, each component
has direct relation with GDP (Acemoglu, Laibson and List, 2017). After analyzing trend growth rate now
the relation between GDP and other macro variables are examined.
Correlation matrix
Correlation is a statistical tool to find out a general relation between two or more variables. The
correlation between GDP and chosen variables is computed using general the historical data of twenty-six
years.
Table 1: Correlation between GDP and five indicators
Real GDP
growth rate
Interest rate
(Cash rate)
Unemploym
ent rate
Inflatio
n rate
Exchange rate
(AUD/US)
Net
export
Real GDP
growth rate
1
Interest rate
(Cash rate)
-0.08 1
Unemployment
rate
-0.13 0.28 1
Inflation rate -0.03 0.64 -0.23 1
Exchange rate
(AUD/US)
0.20 0.04 0.26 0.08 1
Net export 0.23 0.26 0.55 -0.02 0.85 1
The correlation matrix shows GDP has a positive relation with some variables and negative
relation with some others. The variables with which GDP is positive related include exchange rate and net
export. The variables such as interest rate, inflation and unemployment rate constitute a negative relation
with GDP. There are economic explanations behind the statistical relationship obtained from the collected
data.
The first variable considered is the interest rate. The interest rate that is taken here is the cash
rate or the rate charged by RBA on loan borrowed by commercial banks from the reserve bank . When
RBA charges a high interest rate then this means a high cost for commercial banks for borrowed capital.
This high cost is reflected from the interest rate charged by these banks on borrowed fund for investment .
The investors when experience a high interest rate then they reduce their investment (Agénor and
Montiel, 2015). This by contracting productive activities reduces GDP. Opposite is the case in times of a
low cash rate. This explains the inverse relationship between the two variables.
The unemployment rate in the economy is negatively related with GDP growth. The economic
rationale behind this is quite simple. A growing trend in GDP means expansion of output. Expansion of in
production of goods and services means a greater demand for labor force and hence a reduced
unemployment rate (Madsen and Olesen, 2016).
Inflation is both a cause and effect of higher GDP. When GDP grows, average income of people
rises, demand enhances and push prices up. From the other end, when price level rises because of
increased demand then more goods and services are produced and hence bring economic growth .
However, for Australia inflation has resulted from increasing production cost and hence raises debt of
household and business (tradingeconomics.com, 2018). Therefore, in case of Australia an opposite
relation between inflation and GDP growth is found.
5ECONOMIC PERFORMANCE OF AUSTRALIA
The exchange rate represents the cost of purchasing some other country’s currency in terms of
its domestic currency. The unit price of US dollar in terms of Australian dollar is considered for analysis. A
rise in exchange rate means Australia now have to pay a higher amount to have one unit of US dollar
than earlier. This deprecates Australian currency while appreciate US dollar. People in US now can
demand a larger amount of Australian goods and service. This stimulates export demand and brings
economic growth (Horwich and Samuelson, 2014). Therefore, a positive relation exits between exchange
rate and GDP.
Net export implies the balance of trade of a nation. A rising net export mean the country is
earning more from export than its import spending and hence GDP rises. This therefore supports the
positive correlation obtained between net export and GDP growth.
⊘ This is a preview!⊘
Do you want full access?
Subscribe today to unlock all pages.
Trusted by 1+ million students worldwide
6ECONOMIC PERFORMANCE OF AUSTRALIA
Cash rate
1 99 0 1 99 5 2 00 0 2 00 5 2 01 0 2 01 5 2 02 0
0
2
4
6
8
10
12
14
16
Interest rate (Cash rate)
Year
Cash rate
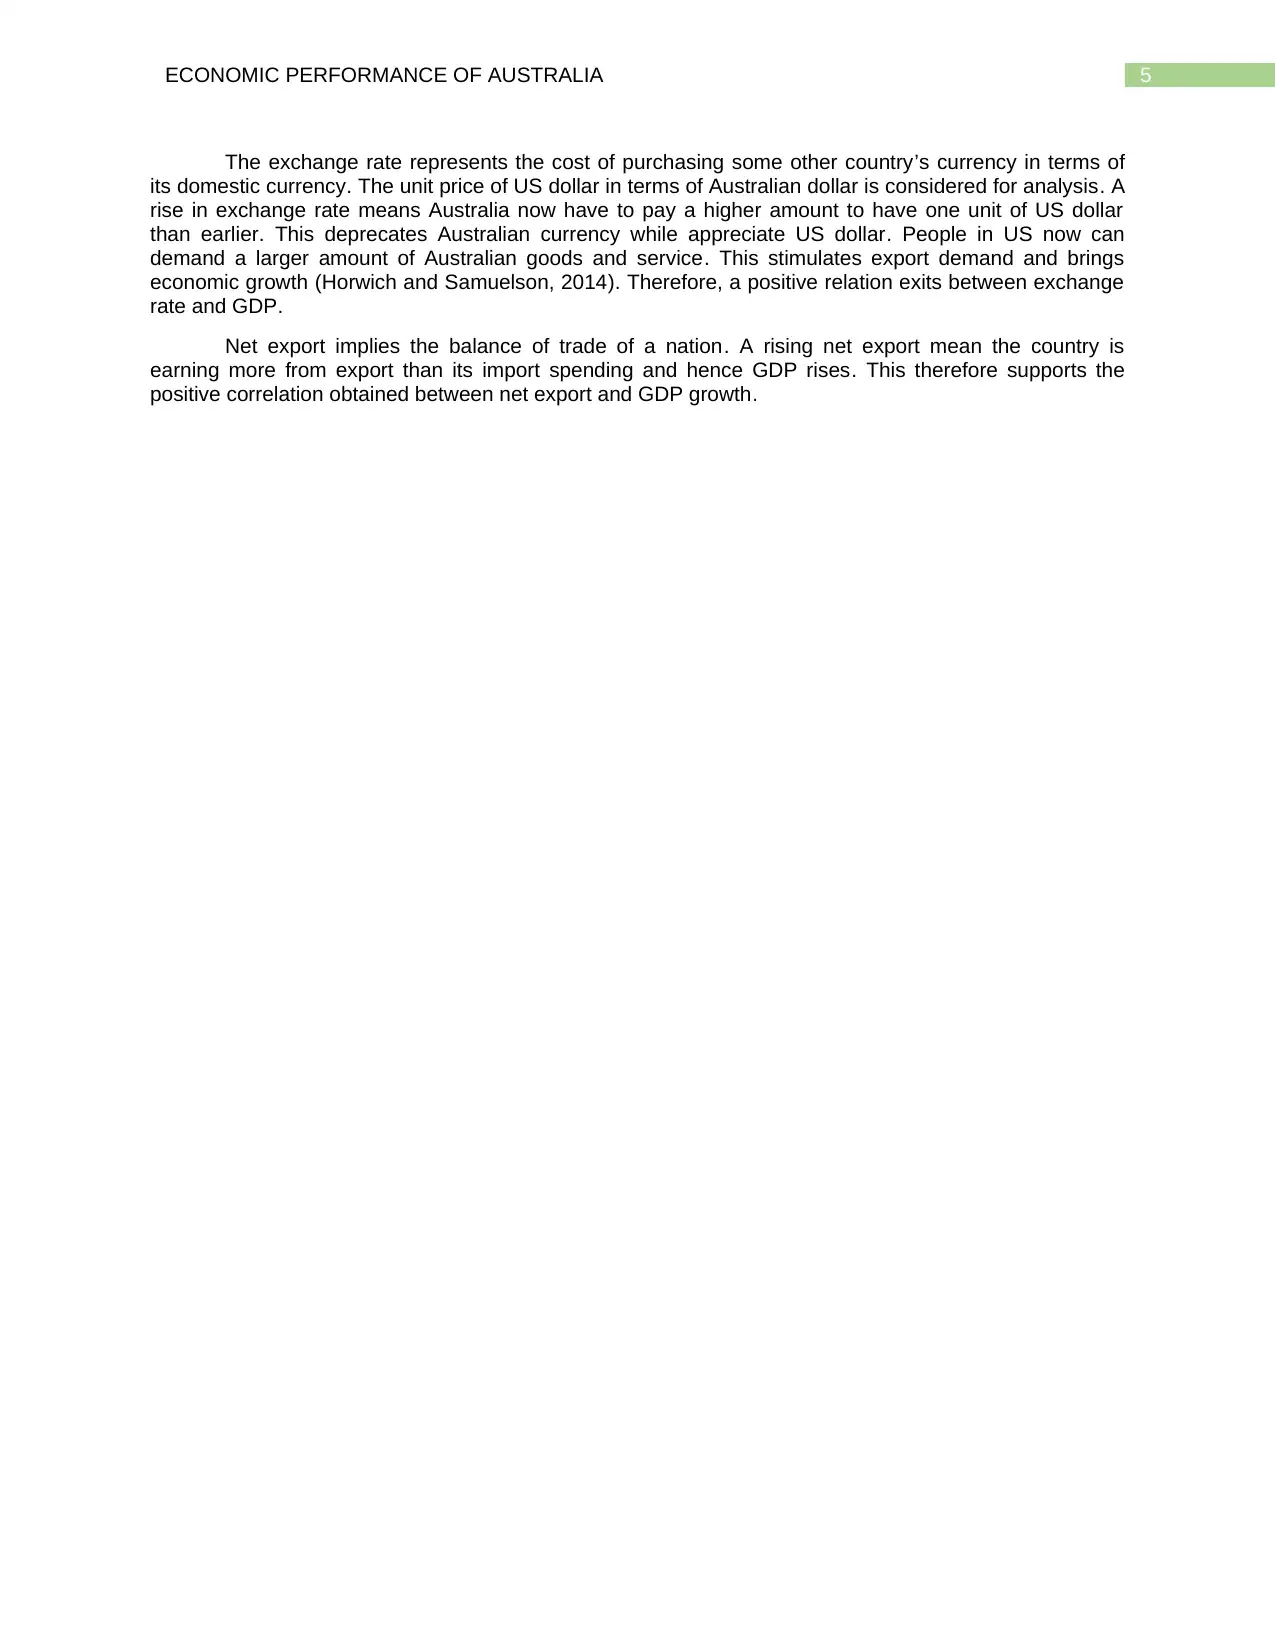
Figure 2: Trend in interest rate
(Data Source: rba.gov.au, 2018)
There is a gradual downfall in the cash rate. The cash varied for the time period varied in the
range of 15.23% to 2.13%. The high cash rate during 1990 signifies a tight monetary policy of Australian
government. However, economic recession in 1991 causes RBA to switch from a tight monetary policy to
a monetary easing (Muffels, 2014). After recession year, cash rate though fluctuates but in mostly remain
close to an average rate of 5.63%. In recent years, in order to achieve a targeted inflation of 2-3% RBA
significantly reduces interest rate. This is indicated from a continuous fall in interest from 2012. The cash
rate is now at a fairly stable rate of 1-2%.
Inflation rate
1 99 0 1 99 5 2 00 0 2 00 5 2 01 0 2 01 5 2 02 0
0
1
2
3
4
5
6
7
8
Inflation rate
Year
Inflation rate
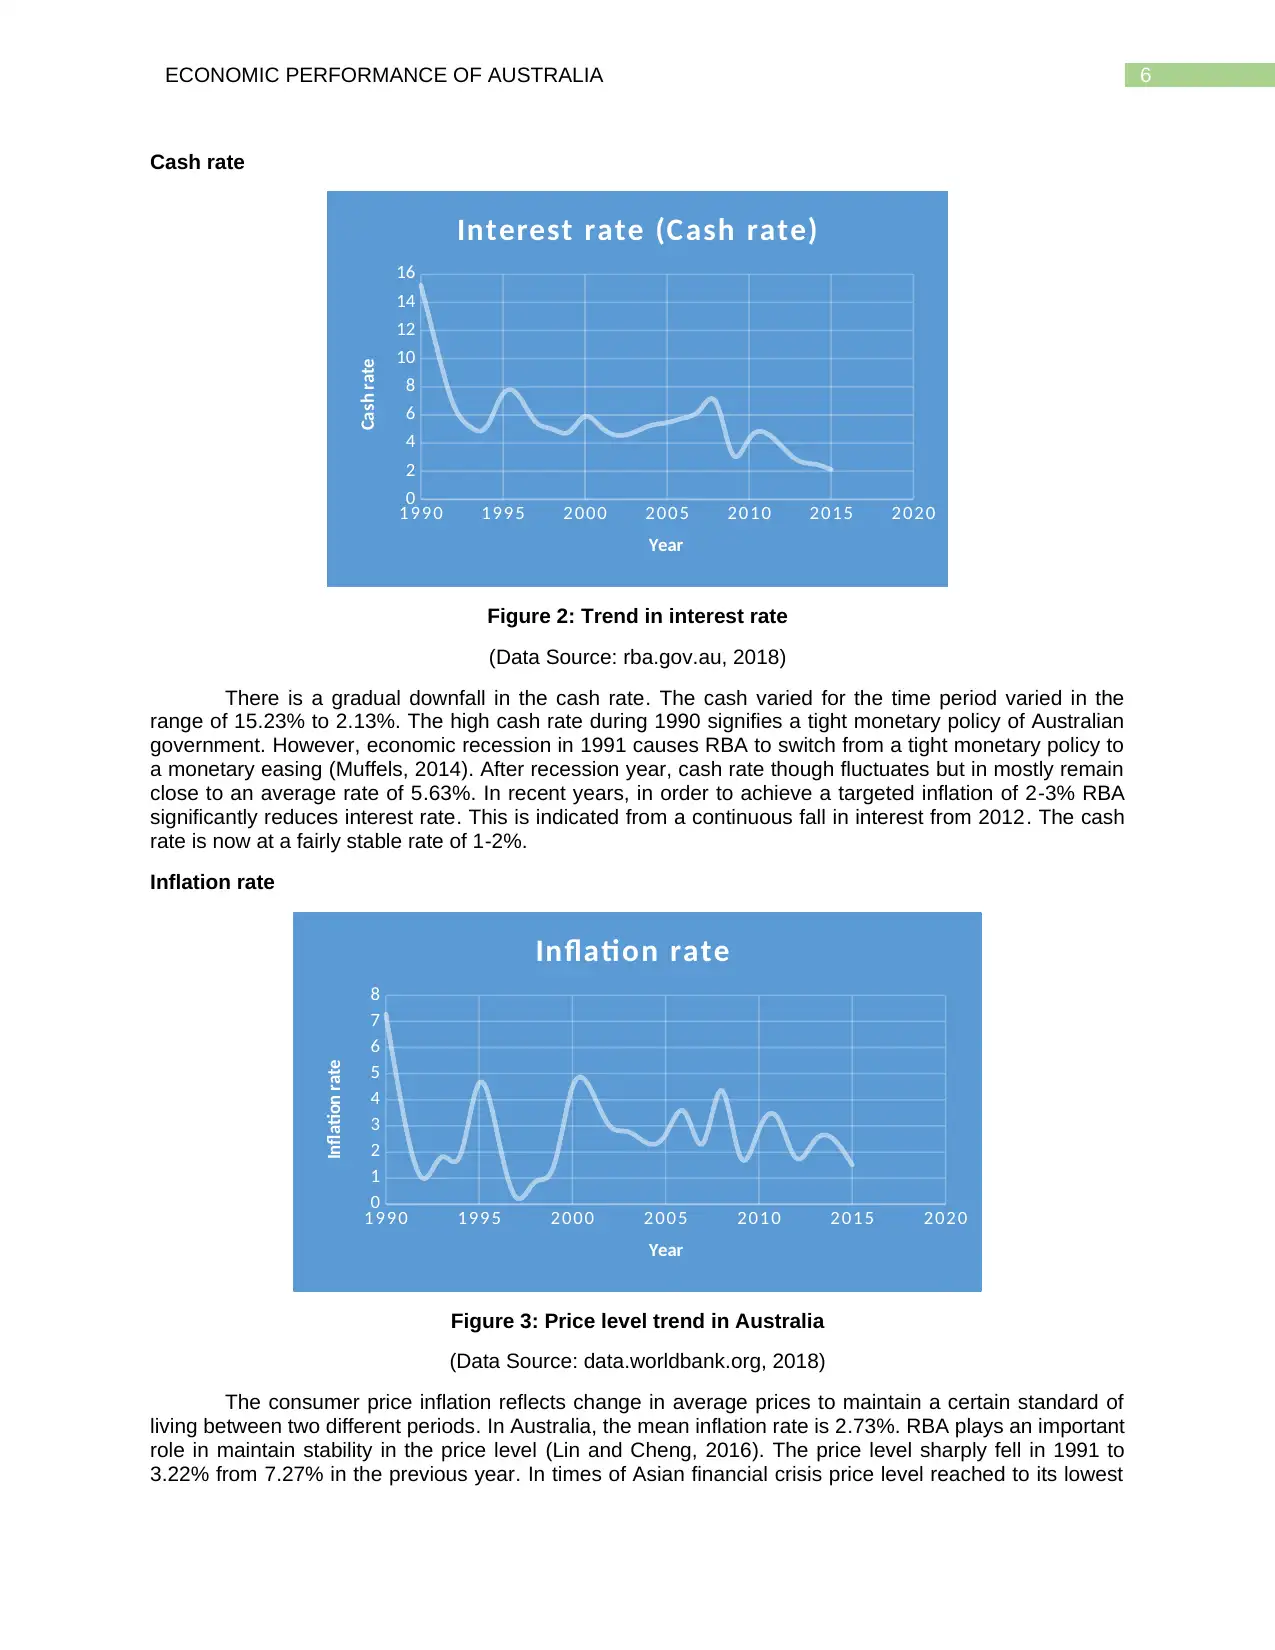
Figure 3: Price level trend in Australia
(Data Source: data.worldbank.org, 2018)
The consumer price inflation reflects change in average prices to maintain a certain standard of
living between two different periods. In Australia, the mean inflation rate is 2.73%. RBA plays an important
role in maintain stability in the price level (Lin and Cheng, 2016). The price level sharply fell in 1991 to
3.22% from 7.27% in the previous year. In times of Asian financial crisis price level reached to its lowest
Cash rate
1 99 0 1 99 5 2 00 0 2 00 5 2 01 0 2 01 5 2 02 0
0
2
4
6
8
10
12
14
16
Interest rate (Cash rate)
Year
Cash rate
Figure 2: Trend in interest rate
(Data Source: rba.gov.au, 2018)
There is a gradual downfall in the cash rate. The cash varied for the time period varied in the
range of 15.23% to 2.13%. The high cash rate during 1990 signifies a tight monetary policy of Australian
government. However, economic recession in 1991 causes RBA to switch from a tight monetary policy to
a monetary easing (Muffels, 2014). After recession year, cash rate though fluctuates but in mostly remain
close to an average rate of 5.63%. In recent years, in order to achieve a targeted inflation of 2-3% RBA
significantly reduces interest rate. This is indicated from a continuous fall in interest from 2012. The cash
rate is now at a fairly stable rate of 1-2%.
Inflation rate
1 99 0 1 99 5 2 00 0 2 00 5 2 01 0 2 01 5 2 02 0
0
1
2
3
4
5
6
7
8
Inflation rate
Year
Inflation rate
Figure 3: Price level trend in Australia
(Data Source: data.worldbank.org, 2018)
The consumer price inflation reflects change in average prices to maintain a certain standard of
living between two different periods. In Australia, the mean inflation rate is 2.73%. RBA plays an important
role in maintain stability in the price level (Lin and Cheng, 2016). The price level sharply fell in 1991 to
3.22% from 7.27% in the previous year. In times of Asian financial crisis price level reached to its lowest
Paraphrase This Document
Need a fresh take? Get an instant paraphrase of this document with our AI Paraphraser
7ECONOMIC PERFORMANCE OF AUSTRALIA
level of 0.25%. In order to recover the economy from recessionary trap stimulus has given with fiscal and
monetary policy tool (Denny and Churchill, 2016). Finally, the economy is successful in achieving a stable
price level ranging between 1 to 2 percent.
Unemployment rate
1 99 0 1 99 5 2 00 0 2 00 5 2 01 0 2 01 5 2 02 0
0
2
4
6
8
10
12
Unemployment rate
Year
Unemployment rate
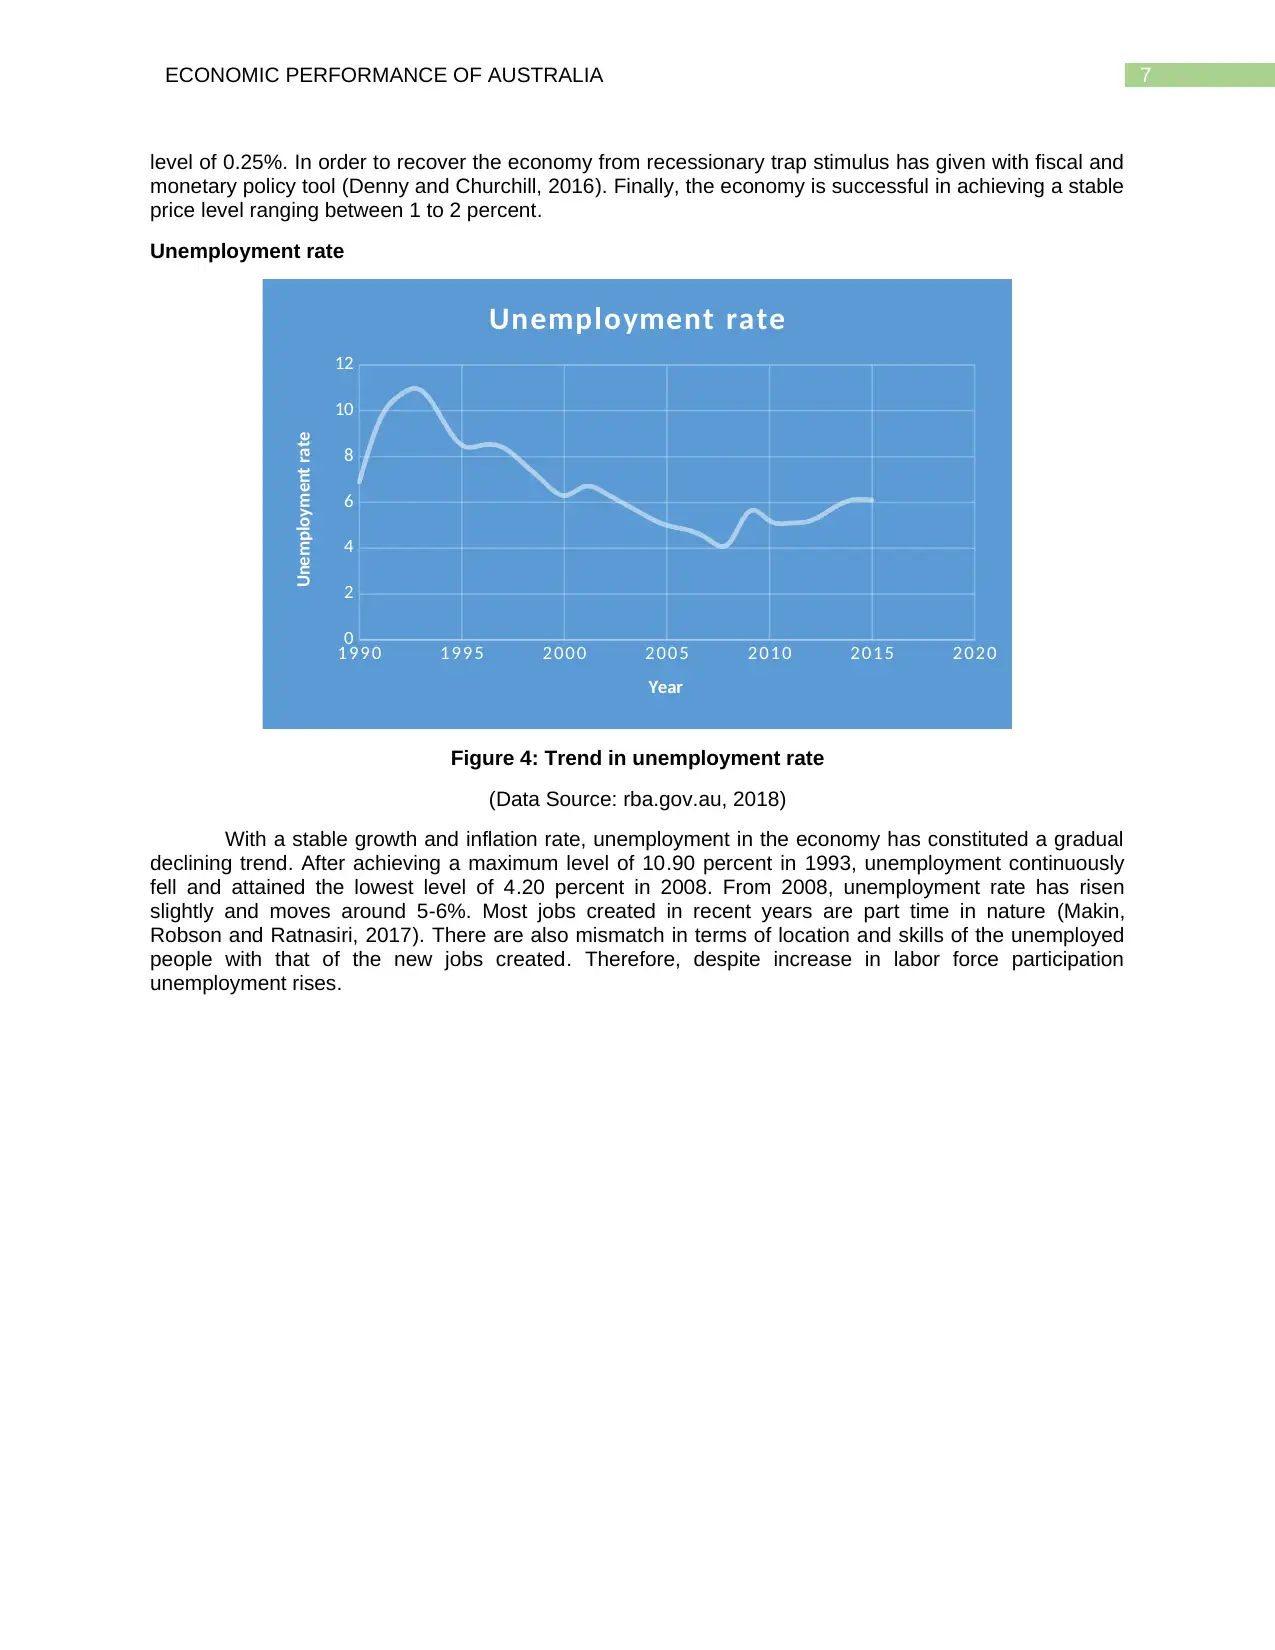
Figure 4: Trend in unemployment rate
(Data Source: rba.gov.au, 2018)
With a stable growth and inflation rate, unemployment in the economy has constituted a gradual
declining trend. After achieving a maximum level of 10.90 percent in 1993, unemployment continuously
fell and attained the lowest level of 4.20 percent in 2008. From 2008, unemployment rate has risen
slightly and moves around 5-6%. Most jobs created in recent years are part time in nature (Makin,
Robson and Ratnasiri, 2017). There are also mismatch in terms of location and skills of the unemployed
people with that of the new jobs created. Therefore, despite increase in labor force participation
unemployment rises.
level of 0.25%. In order to recover the economy from recessionary trap stimulus has given with fiscal and
monetary policy tool (Denny and Churchill, 2016). Finally, the economy is successful in achieving a stable
price level ranging between 1 to 2 percent.
Unemployment rate
1 99 0 1 99 5 2 00 0 2 00 5 2 01 0 2 01 5 2 02 0
0
2
4
6
8
10
12
Unemployment rate
Year
Unemployment rate
Figure 4: Trend in unemployment rate
(Data Source: rba.gov.au, 2018)
With a stable growth and inflation rate, unemployment in the economy has constituted a gradual
declining trend. After achieving a maximum level of 10.90 percent in 1993, unemployment continuously
fell and attained the lowest level of 4.20 percent in 2008. From 2008, unemployment rate has risen
slightly and moves around 5-6%. Most jobs created in recent years are part time in nature (Makin,
Robson and Ratnasiri, 2017). There are also mismatch in terms of location and skills of the unemployed
people with that of the new jobs created. Therefore, despite increase in labor force participation
unemployment rises.
8ECONOMIC PERFORMANCE OF AUSTRALIA
Exchange rate
1 99 0 1 99 5 2 00 0 2 00 5 2 01 0 2 01 5 2 02 0
0.00
0.50
1.00
1.50
2.00
2.50
Exchange rate (AUD/US)
Year
Exchange rate
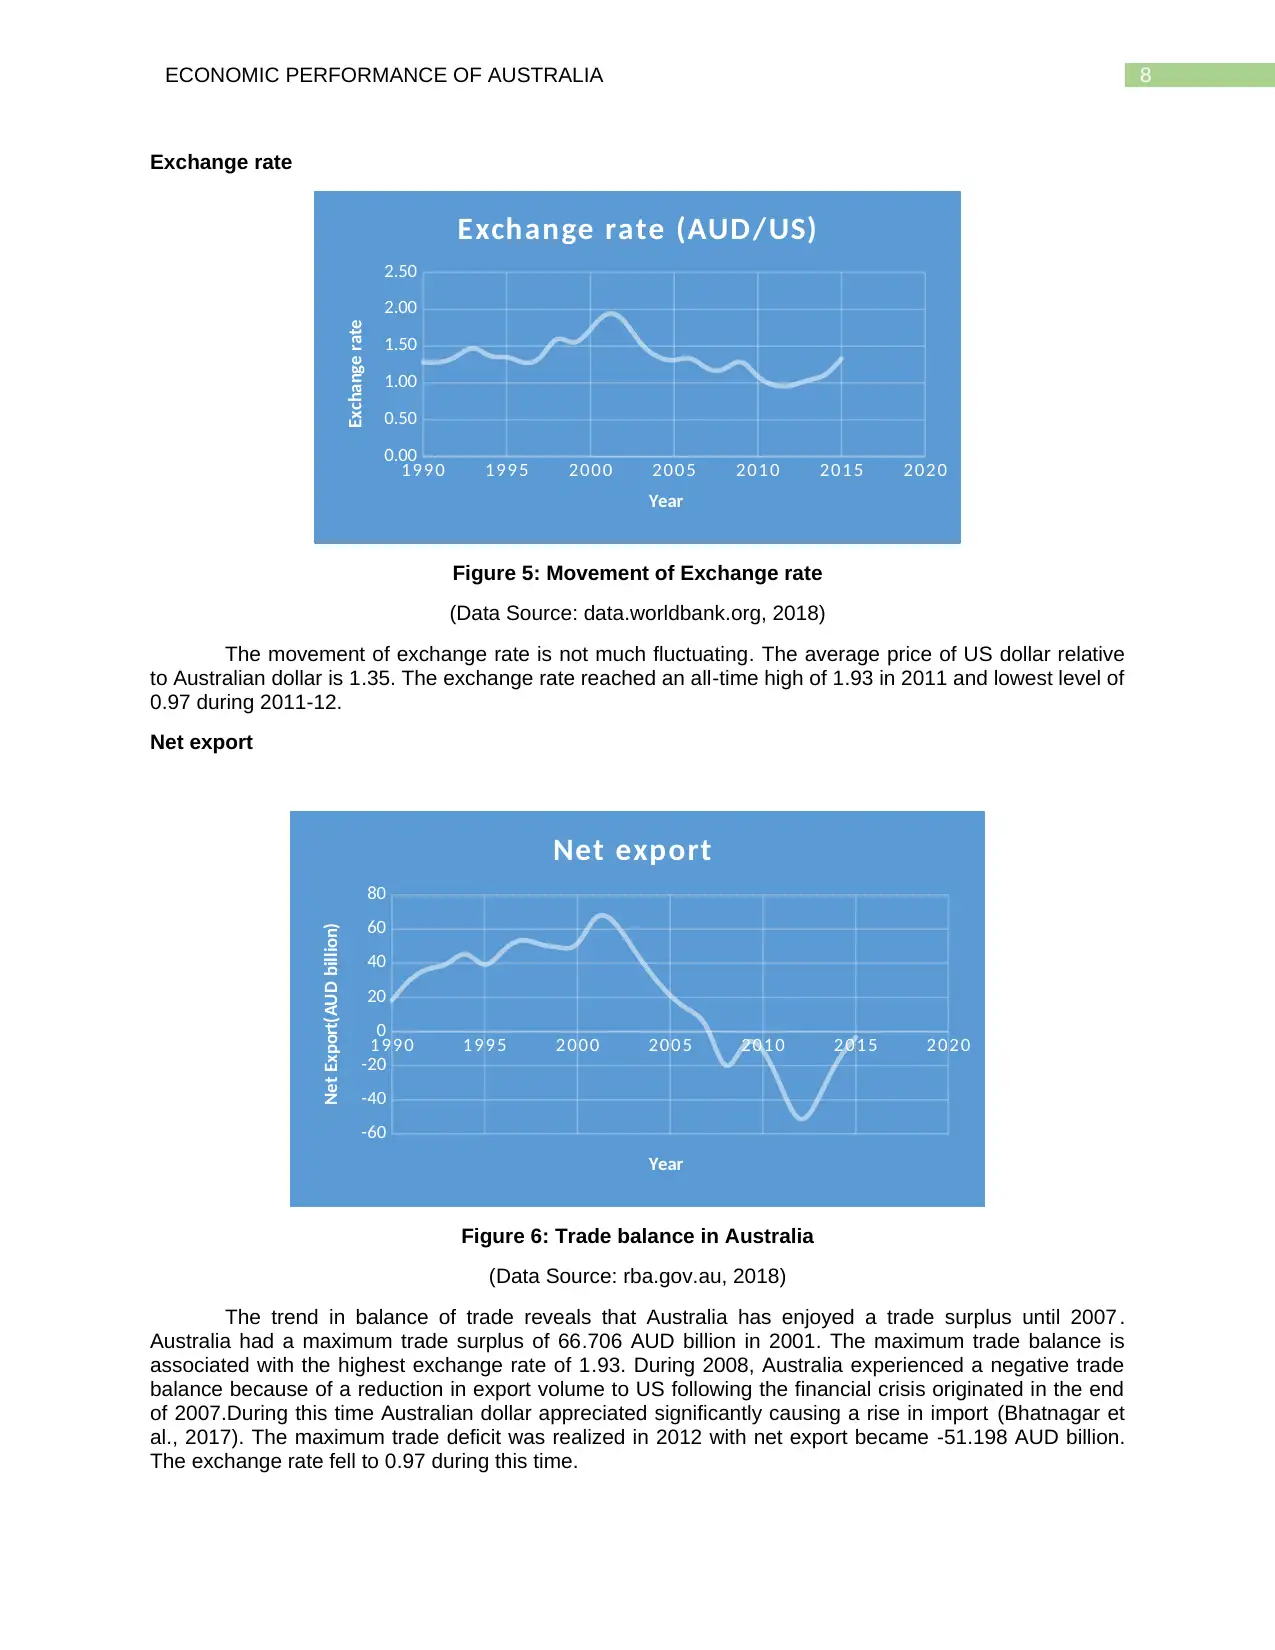
Figure 5: Movement of Exchange rate
(Data Source: data.worldbank.org, 2018)
The movement of exchange rate is not much fluctuating. The average price of US dollar relative
to Australian dollar is 1.35. The exchange rate reached an all-time high of 1.93 in 2011 and lowest level of
0.97 during 2011-12.
Net export
1 99 0 1 99 5 2 00 0 2 00 5 2 01 0 2 01 5 2 02 0
-60
-40
-20
0
20
40
60
80
Net export
Year
Net Export(AUD billion)
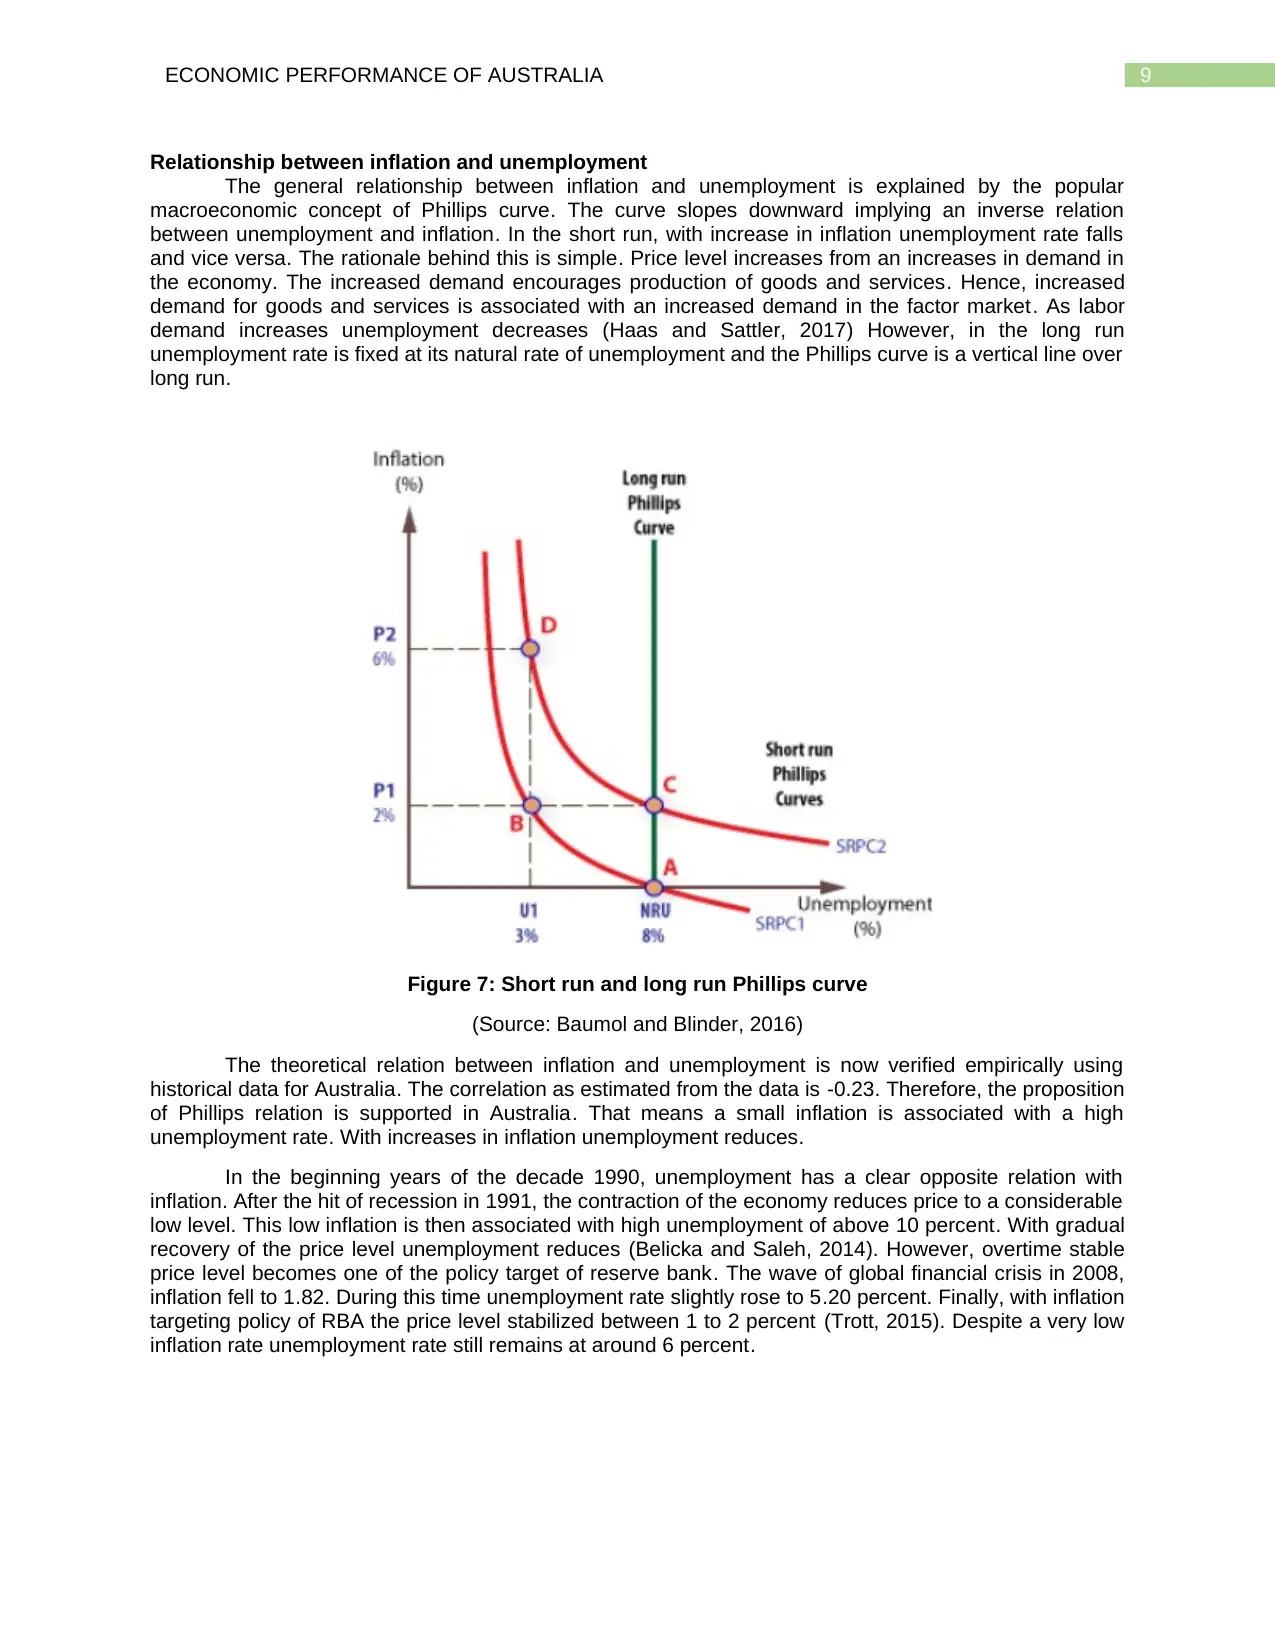
Figure 6: Trade balance in Australia
(Data Source: rba.gov.au, 2018)
The trend in balance of trade reveals that Australia has enjoyed a trade surplus until 2007 .
Australia had a maximum trade surplus of 66.706 AUD billion in 2001. The maximum trade balance is
associated with the highest exchange rate of 1.93. During 2008, Australia experienced a negative trade
balance because of a reduction in export volume to US following the financial crisis originated in the end
of 2007.During this time Australian dollar appreciated significantly causing a rise in import (Bhatnagar et
al., 2017). The maximum trade deficit was realized in 2012 with net export became -51.198 AUD billion.
The exchange rate fell to 0.97 during this time.
Exchange rate
1 99 0 1 99 5 2 00 0 2 00 5 2 01 0 2 01 5 2 02 0
0.00
0.50
1.00
1.50
2.00
2.50
Exchange rate (AUD/US)
Year
Exchange rate
Figure 5: Movement of Exchange rate
(Data Source: data.worldbank.org, 2018)
The movement of exchange rate is not much fluctuating. The average price of US dollar relative
to Australian dollar is 1.35. The exchange rate reached an all-time high of 1.93 in 2011 and lowest level of
0.97 during 2011-12.
Net export
1 99 0 1 99 5 2 00 0 2 00 5 2 01 0 2 01 5 2 02 0
-60
-40
-20
0
20
40
60
80
Net export
Year
Net Export(AUD billion)
Figure 6: Trade balance in Australia
(Data Source: rba.gov.au, 2018)
The trend in balance of trade reveals that Australia has enjoyed a trade surplus until 2007 .
Australia had a maximum trade surplus of 66.706 AUD billion in 2001. The maximum trade balance is
associated with the highest exchange rate of 1.93. During 2008, Australia experienced a negative trade
balance because of a reduction in export volume to US following the financial crisis originated in the end
of 2007.During this time Australian dollar appreciated significantly causing a rise in import (Bhatnagar et
al., 2017). The maximum trade deficit was realized in 2012 with net export became -51.198 AUD billion.
The exchange rate fell to 0.97 during this time.
⊘ This is a preview!⊘
Do you want full access?
Subscribe today to unlock all pages.
Trusted by 1+ million students worldwide
9ECONOMIC PERFORMANCE OF AUSTRALIA
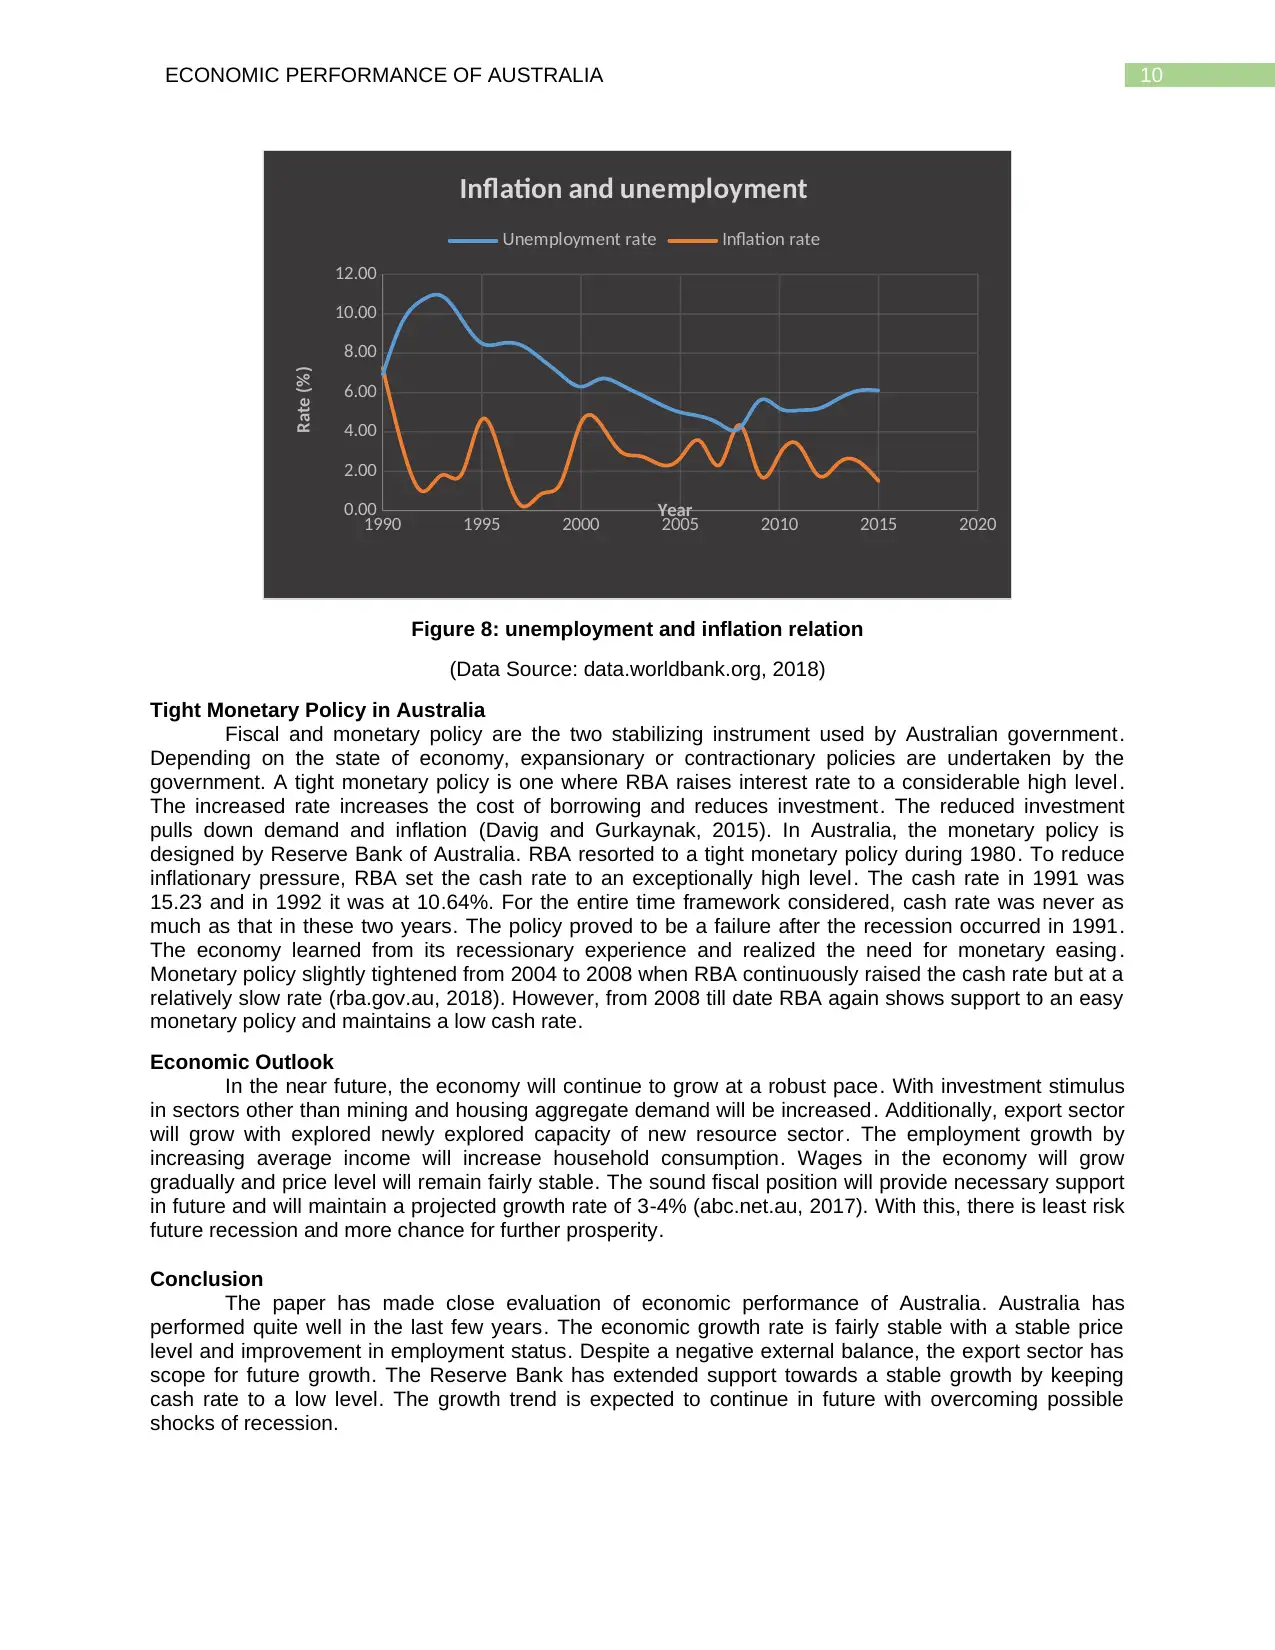
Relationship between inflation and unemployment
The general relationship between inflation and unemployment is explained by the popular
macroeconomic concept of Phillips curve. The curve slopes downward implying an inverse relation
between unemployment and inflation. In the short run, with increase in inflation unemployment rate falls
and vice versa. The rationale behind this is simple. Price level increases from an increases in demand in
the economy. The increased demand encourages production of goods and services. Hence, increased
demand for goods and services is associated with an increased demand in the factor market. As labor
demand increases unemployment decreases (Haas and Sattler, 2017) However, in the long run
unemployment rate is fixed at its natural rate of unemployment and the Phillips curve is a vertical line over
long run.
Figure 7: Short run and long run Phillips curve
(Source: Baumol and Blinder, 2016)
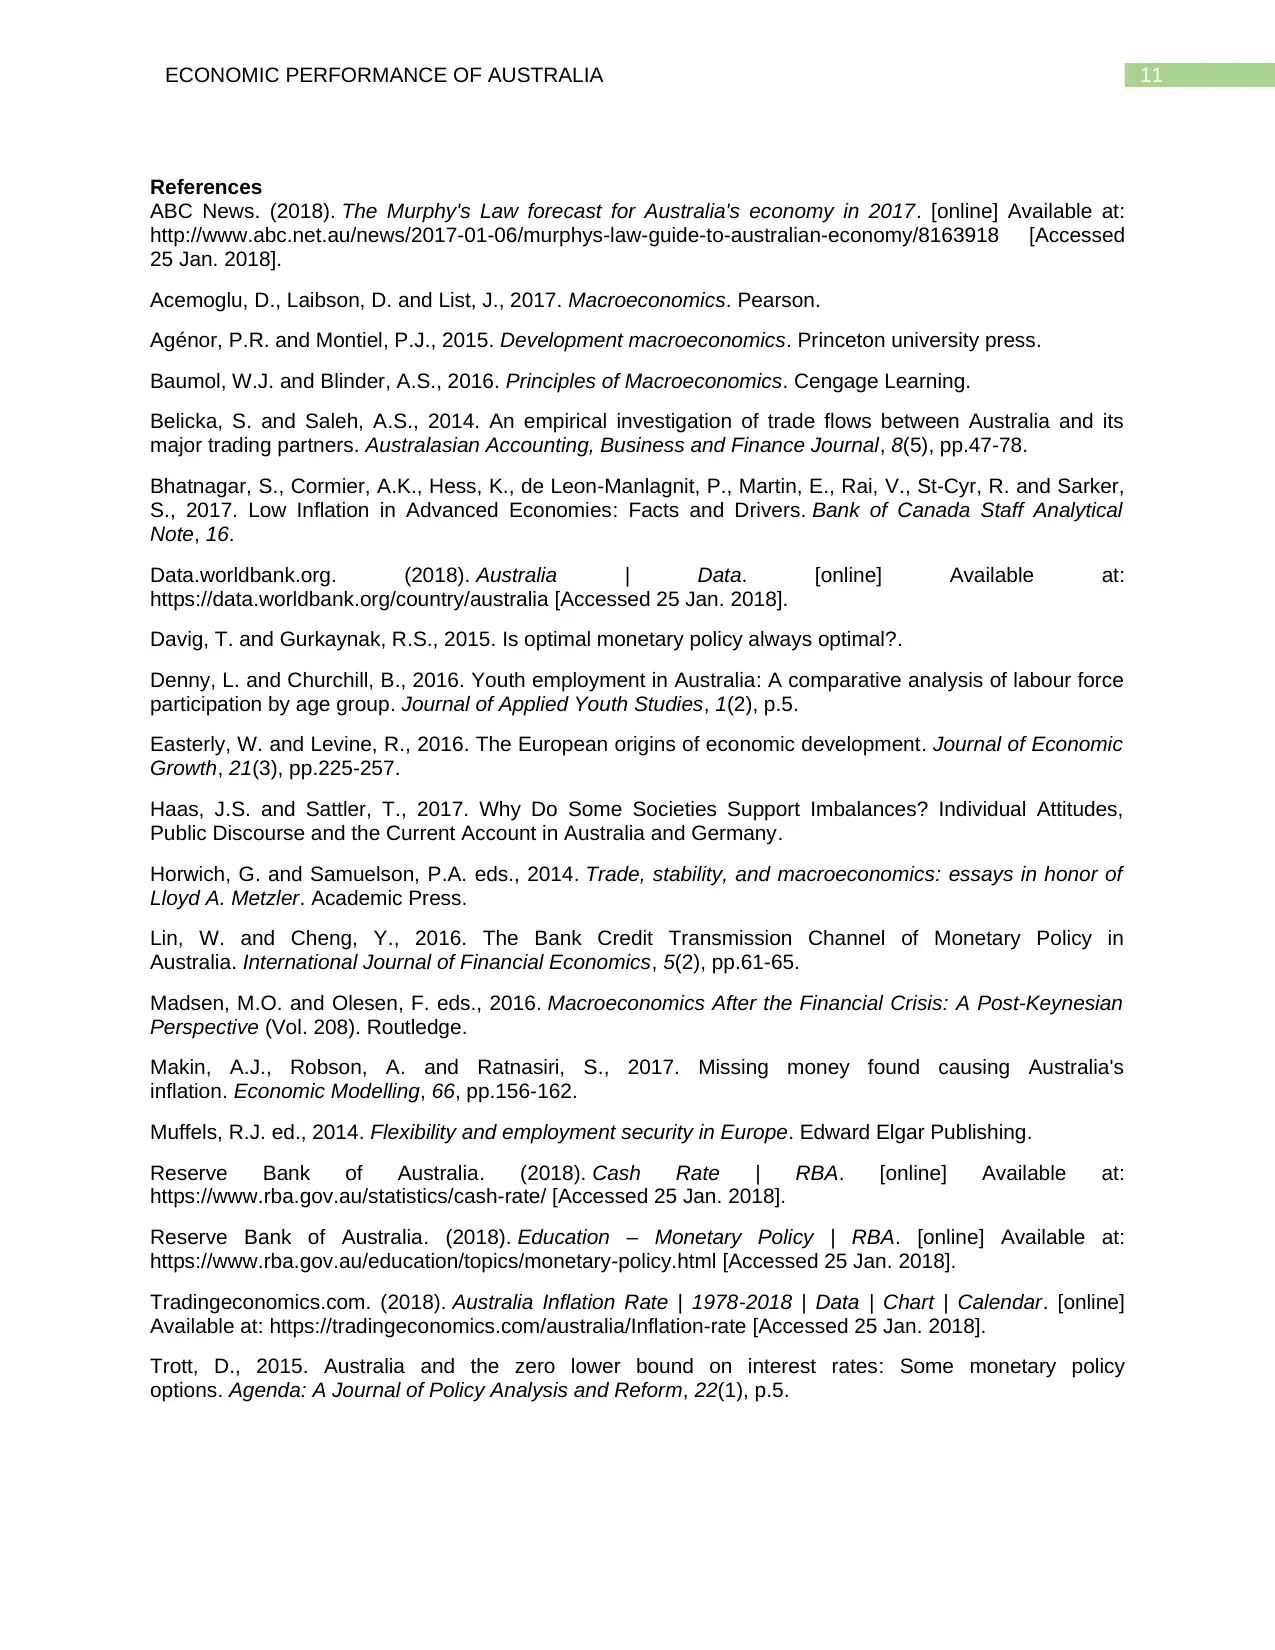
The theoretical relation between inflation and unemployment is now verified empirically using
historical data for Australia. The correlation as estimated from the data is -0.23. Therefore, the proposition
of Phillips relation is supported in Australia. That means a small inflation is associated with a high
unemployment rate. With increases in inflation unemployment reduces.
In the beginning years of the decade 1990, unemployment has a clear opposite relation with
inflation. After the hit of recession in 1991, the contraction of the economy reduces price to a considerable
low level. This low inflation is then associated with high unemployment of above 10 percent. With gradual
recovery of the price level unemployment reduces (Belicka and Saleh, 2014). However, overtime stable
price level becomes one of the policy target of reserve bank. The wave of global financial crisis in 2008,
inflation fell to 1.82. During this time unemployment rate slightly rose to 5.20 percent. Finally, with inflation
targeting policy of RBA the price level stabilized between 1 to 2 percent (Trott, 2015). Despite a very low
inflation rate unemployment rate still remains at around 6 percent.
Relationship between inflation and unemployment
The general relationship between inflation and unemployment is explained by the popular
macroeconomic concept of Phillips curve. The curve slopes downward implying an inverse relation
between unemployment and inflation. In the short run, with increase in inflation unemployment rate falls
and vice versa. The rationale behind this is simple. Price level increases from an increases in demand in
the economy. The increased demand encourages production of goods and services. Hence, increased
demand for goods and services is associated with an increased demand in the factor market. As labor
demand increases unemployment decreases (Haas and Sattler, 2017) However, in the long run
unemployment rate is fixed at its natural rate of unemployment and the Phillips curve is a vertical line over
long run.
Figure 7: Short run and long run Phillips curve
(Source: Baumol and Blinder, 2016)
The theoretical relation between inflation and unemployment is now verified empirically using
historical data for Australia. The correlation as estimated from the data is -0.23. Therefore, the proposition
of Phillips relation is supported in Australia. That means a small inflation is associated with a high
unemployment rate. With increases in inflation unemployment reduces.
In the beginning years of the decade 1990, unemployment has a clear opposite relation with
inflation. After the hit of recession in 1991, the contraction of the economy reduces price to a considerable
low level. This low inflation is then associated with high unemployment of above 10 percent. With gradual
recovery of the price level unemployment reduces (Belicka and Saleh, 2014). However, overtime stable
price level becomes one of the policy target of reserve bank. The wave of global financial crisis in 2008,
inflation fell to 1.82. During this time unemployment rate slightly rose to 5.20 percent. Finally, with inflation
targeting policy of RBA the price level stabilized between 1 to 2 percent (Trott, 2015). Despite a very low
inflation rate unemployment rate still remains at around 6 percent.
Paraphrase This Document
Need a fresh take? Get an instant paraphrase of this document with our AI Paraphraser
10ECONOMIC PERFORMANCE OF AUSTRALIA
1990 1995 2000 2005 2010 2015 2020
0.00
2.00
4.00
6.00
8.00
10.00
12.00
Inflation and unemployment
Unemployment rate Inflation rate
Year
Rate (%)
Figure 8: unemployment and inflation relation
(Data Source: data.worldbank.org, 2018)
Tight Monetary Policy in Australia
Fiscal and monetary policy are the two stabilizing instrument used by Australian government.
Depending on the state of economy, expansionary or contractionary policies are undertaken by the
government. A tight monetary policy is one where RBA raises interest rate to a considerable high level.
The increased rate increases the cost of borrowing and reduces investment. The reduced investment
pulls down demand and inflation (Davig and Gurkaynak, 2015). In Australia, the monetary policy is
designed by Reserve Bank of Australia. RBA resorted to a tight monetary policy during 1980. To reduce
inflationary pressure, RBA set the cash rate to an exceptionally high level. The cash rate in 1991 was
15.23 and in 1992 it was at 10.64%. For the entire time framework considered, cash rate was never as
much as that in these two years. The policy proved to be a failure after the recession occurred in 1991.
The economy learned from its recessionary experience and realized the need for monetary easing .
Monetary policy slightly tightened from 2004 to 2008 when RBA continuously raised the cash rate but at a
relatively slow rate (rba.gov.au, 2018). However, from 2008 till date RBA again shows support to an easy
monetary policy and maintains a low cash rate.
Economic Outlook
In the near future, the economy will continue to grow at a robust pace. With investment stimulus
in sectors other than mining and housing aggregate demand will be increased. Additionally, export sector
will grow with explored newly explored capacity of new resource sector. The employment growth by
increasing average income will increase household consumption. Wages in the economy will grow
gradually and price level will remain fairly stable. The sound fiscal position will provide necessary support
in future and will maintain a projected growth rate of 3-4% (abc.net.au, 2017). With this, there is least risk
future recession and more chance for further prosperity.
Conclusion
The paper has made close evaluation of economic performance of Australia. Australia has
performed quite well in the last few years. The economic growth rate is fairly stable with a stable price
level and improvement in employment status. Despite a negative external balance, the export sector has
scope for future growth. The Reserve Bank has extended support towards a stable growth by keeping
cash rate to a low level. The growth trend is expected to continue in future with overcoming possible
shocks of recession.
11ECONOMIC PERFORMANCE OF AUSTRALIA
References
ABC News. (2018). The Murphy's Law forecast for Australia's economy in 2017. [online] Available at:
http://www.abc.net.au/news/2017-01-06/murphys-law-guide-to-australian-economy/8163918 [Accessed
25 Jan. 2018].
Acemoglu, D., Laibson, D. and List, J., 2017. Macroeconomics. Pearson.
Agénor, P.R. and Montiel, P.J., 2015. Development macroeconomics. Princeton university press.
Baumol, W.J. and Blinder, A.S., 2016. Principles of Macroeconomics. Cengage Learning.
Belicka, S. and Saleh, A.S., 2014. An empirical investigation of trade flows between Australia and its
major trading partners. Australasian Accounting, Business and Finance Journal, 8(5), pp.47-78.
Bhatnagar, S., Cormier, A.K., Hess, K., de Leon-Manlagnit, P., Martin, E., Rai, V., St-Cyr, R. and Sarker,
S., 2017. Low Inflation in Advanced Economies: Facts and Drivers. Bank of Canada Staff Analytical
Note, 16.
Data.worldbank.org. (2018). Australia | Data. [online] Available at:
https://data.worldbank.org/country/australia [Accessed 25 Jan. 2018].
Davig, T. and Gurkaynak, R.S., 2015. Is optimal monetary policy always optimal?.
Denny, L. and Churchill, B., 2016. Youth employment in Australia: A comparative analysis of labour force
participation by age group. Journal of Applied Youth Studies, 1(2), p.5.
Easterly, W. and Levine, R., 2016. The European origins of economic development. Journal of Economic
Growth, 21(3), pp.225-257.
Haas, J.S. and Sattler, T., 2017. Why Do Some Societies Support Imbalances? Individual Attitudes,
Public Discourse and the Current Account in Australia and Germany.
Horwich, G. and Samuelson, P.A. eds., 2014. Trade, stability, and macroeconomics: essays in honor of
Lloyd A. Metzler. Academic Press.
Lin, W. and Cheng, Y., 2016. The Bank Credit Transmission Channel of Monetary Policy in
Australia. International Journal of Financial Economics, 5(2), pp.61-65.
Madsen, M.O. and Olesen, F. eds., 2016. Macroeconomics After the Financial Crisis: A Post-Keynesian
Perspective (Vol. 208). Routledge.
Makin, A.J., Robson, A. and Ratnasiri, S., 2017. Missing money found causing Australia's
inflation. Economic Modelling, 66, pp.156-162.
Muffels, R.J. ed., 2014. Flexibility and employment security in Europe. Edward Elgar Publishing.
Reserve Bank of Australia. (2018). Cash Rate | RBA. [online] Available at:
https://www.rba.gov.au/statistics/cash-rate/ [Accessed 25 Jan. 2018].
Reserve Bank of Australia. (2018). Education – Monetary Policy | RBA. [online] Available at:
https://www.rba.gov.au/education/topics/monetary-policy.html [Accessed 25 Jan. 2018].
Tradingeconomics.com. (2018). Australia Inflation Rate | 1978-2018 | Data | Chart | Calendar. [online]
Available at: https://tradingeconomics.com/australia/Inflation-rate [Accessed 25 Jan. 2018].
Trott, D., 2015. Australia and the zero lower bound on interest rates: Some monetary policy
options. Agenda: A Journal of Policy Analysis and Reform, 22(1), p.5.
⊘ This is a preview!⊘
Do you want full access?
Subscribe today to unlock all pages.
Trusted by 1+ million students worldwide
1 out of 16
Related Documents


Your All-in-One AI-Powered Toolkit for Academic Success.
+13062052269
info@desklib.com
Available 24*7 on WhatsApp / Email
![[object Object]](/_next/static/media/star-bottom.7253800d.svg)
Unlock your academic potential
Copyright © 2020–2026 A2Z Services. All Rights Reserved. Developed and managed by ZUCOL.