Examining Australia's Economic Growth: GDP Analysis and Key Factors

Verified

Added on  2023/06/11

|5
|1166
|287
Report
AI Summary
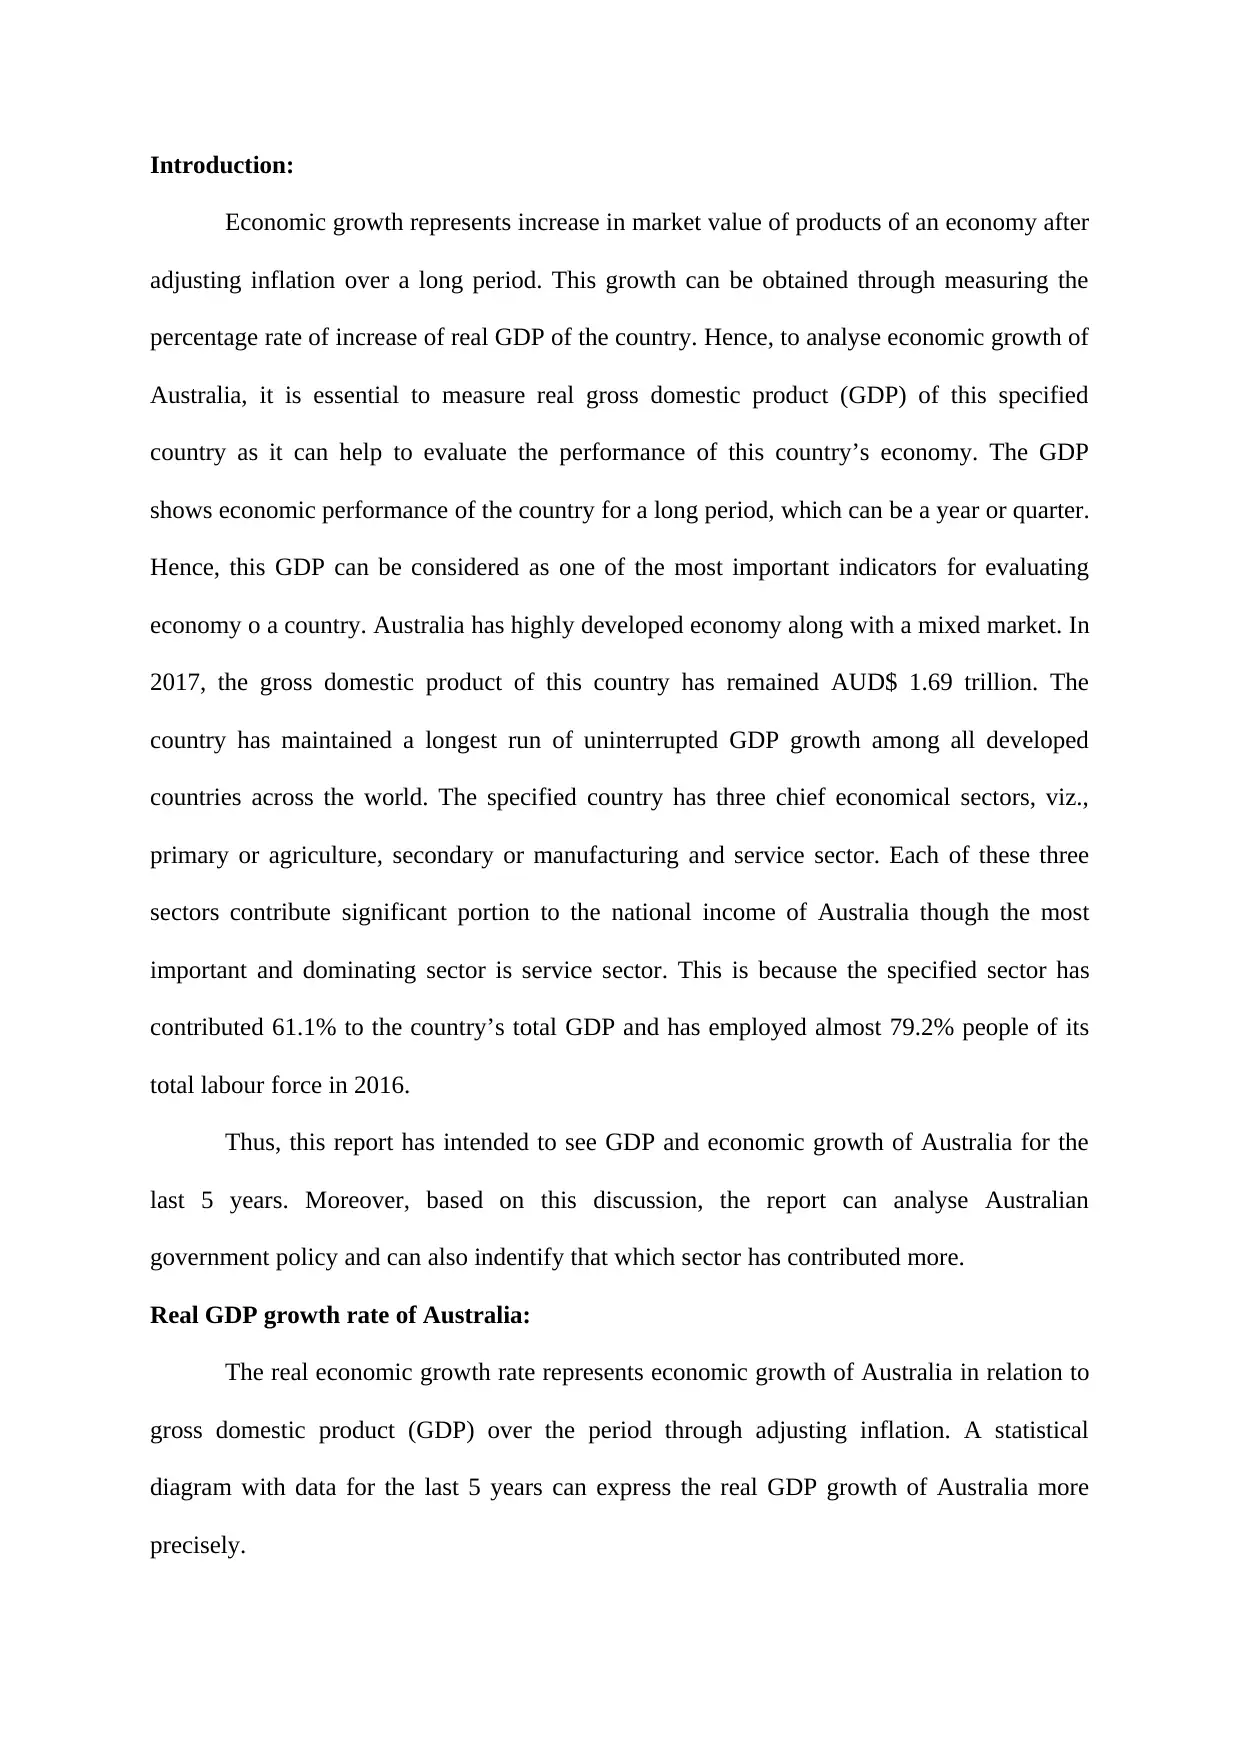
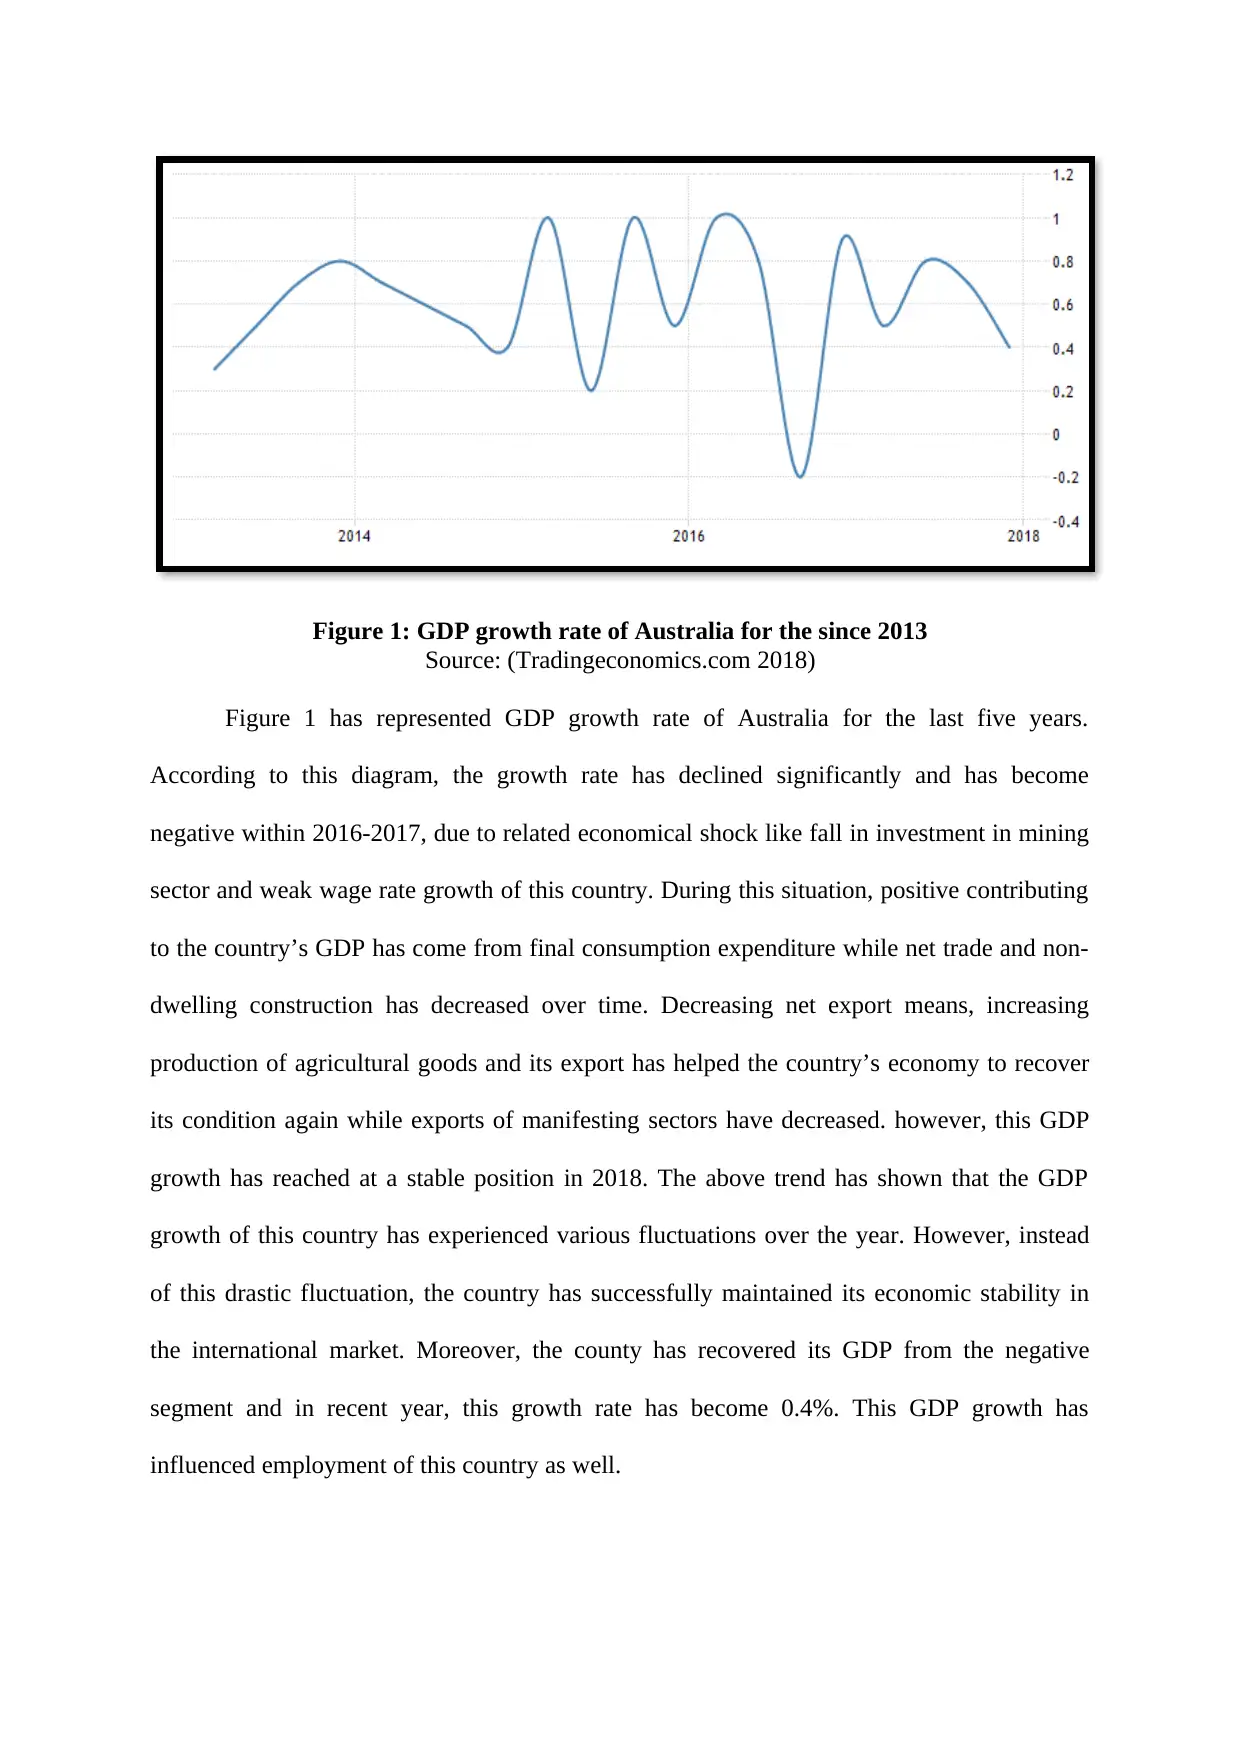
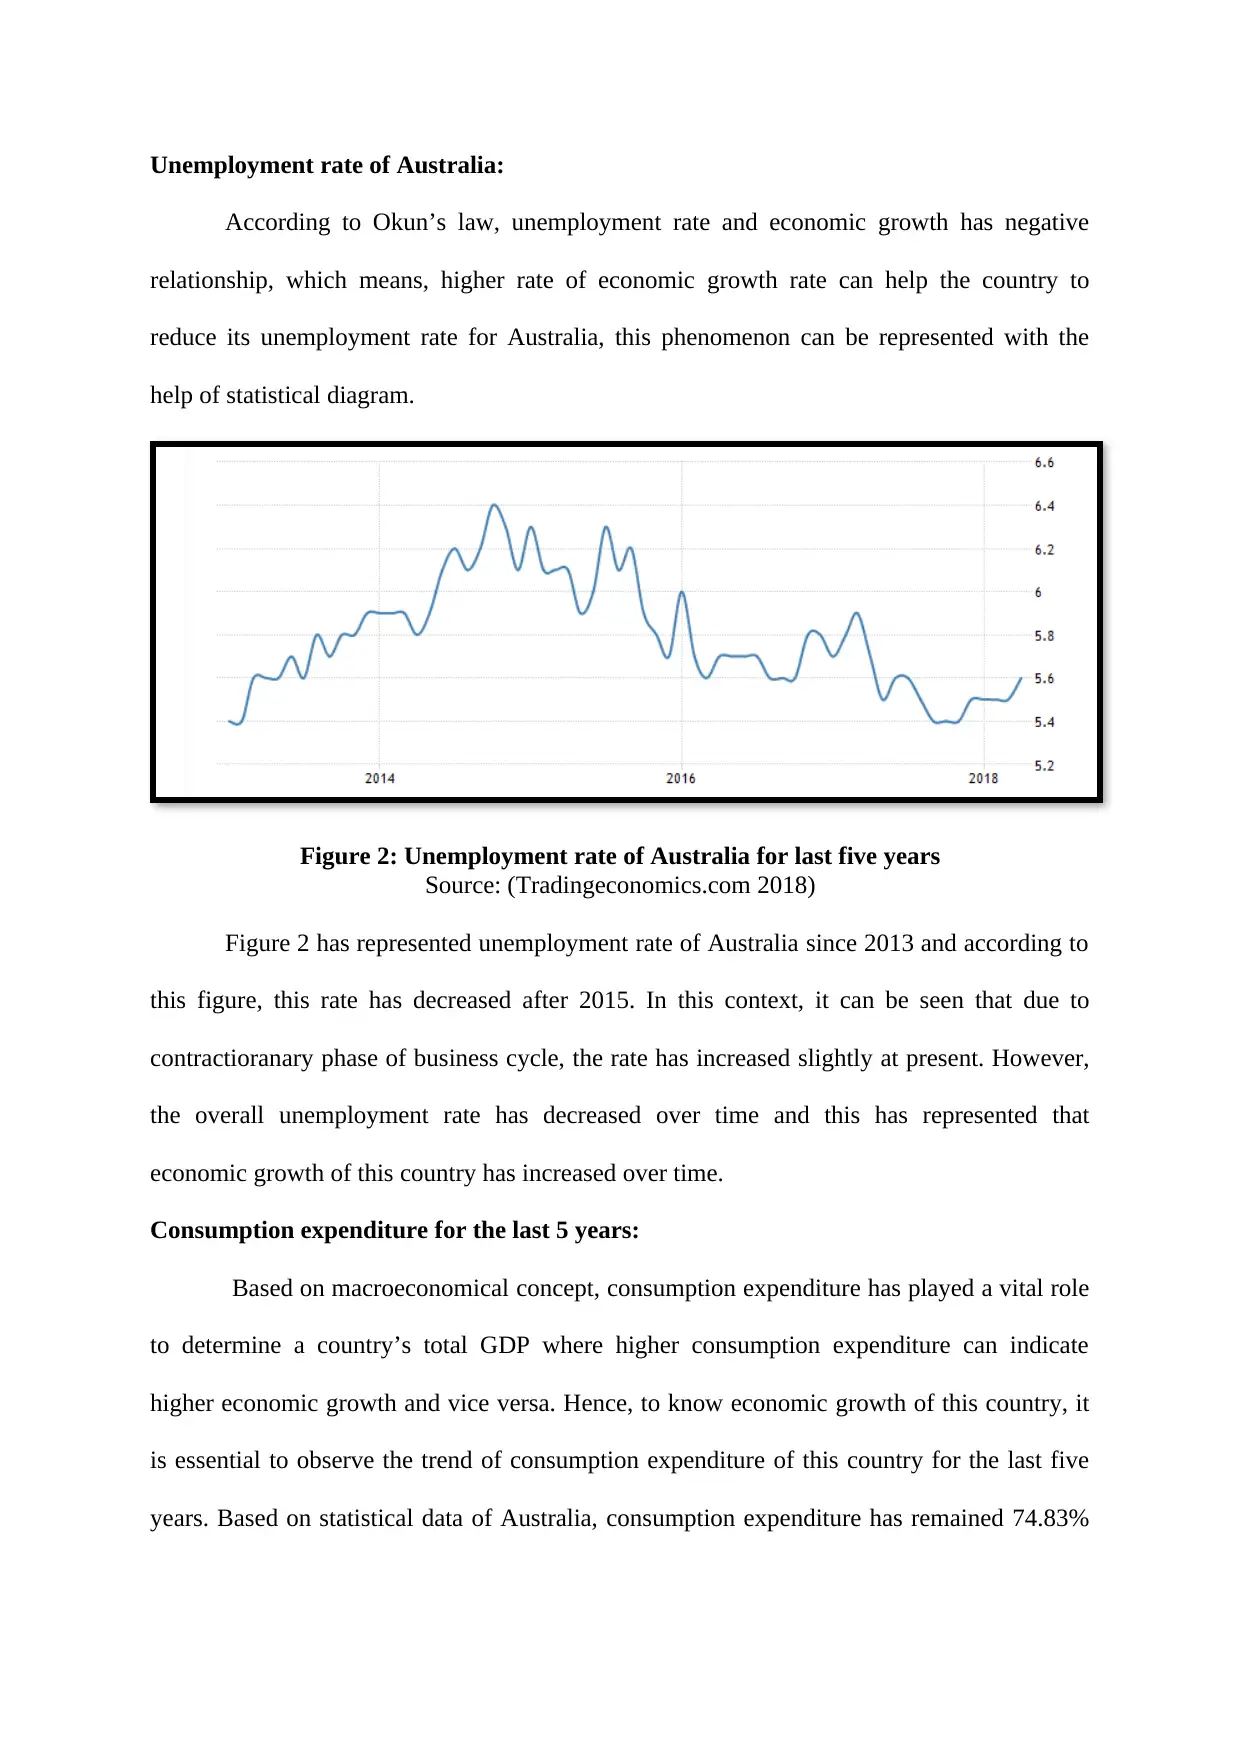
This report analyzes Australia's economic growth by examining its Gross Domestic Product (GDP) over the last five years. It highlights that Australia has a highly developed economy with a mixed market, achieving a long period of uninterrupted GDP growth among developed countries. The report identifies the primary, secondary, and service sectors as key contributors to the national income, with the service sector being the most dominant. The analysis includes real GDP growth rates, unemployment rates, and consumption expenditure trends, revealing fluctuations and a recent recovery in GDP growth. The relationship between unemployment and economic growth is discussed using Okun's law, and the impact of consumer confidence on consumption expenditure is also explored. The report concludes that increased consumer confidence and spending have contributed to Australia's economic stability and growth.
Document Page
Introduction:
Economic growth represents increase in market value of products of an economy after
adjusting inflation over a long period. This growth can be obtained through measuring the
percentage rate of increase of real GDP of the country. Hence, to analyse economic growth of
Australia, it is essential to measure real gross domestic product (GDP) of this specified
country as it can help to evaluate the performance of this country’s economy. The GDP
shows economic performance of the country for a long period, which can be a year or quarter.
Hence, this GDP can be considered as one of the most important indicators for evaluating
economy o a country. Australia has highly developed economy along with a mixed market. In
2017, the gross domestic product of this country has remained AUD$ 1.69 trillion. The
country has maintained a longest run of uninterrupted GDP growth among all developed
countries across the world. The specified country has three chief economical sectors, viz.,
primary or agriculture, secondary or manufacturing and service sector. Each of these three
sectors contribute significant portion to the national income of Australia though the most
important and dominating sector is service sector. This is because the specified sector has
contributed 61.1% to the country’s total GDP and has employed almost 79.2% people of its
total labour force in 2016.
Thus, this report has intended to see GDP and economic growth of Australia for the
last 5 years. Moreover, based on this discussion, the report can analyse Australian
government policy and can also indentify that which sector has contributed more.
Real GDP growth rate of Australia:
The real economic growth rate represents economic growth of Australia in relation to
gross domestic product (GDP) over the period through adjusting inflation. A statistical
diagram with data for the last 5 years can express the real GDP growth of Australia more
precisely.
tabler-icon-diamond-filled.svg

Paraphrase This Document

Need a fresh take? Get an instant paraphrase of this document with our AI Paraphraser
Document Page
Figure 1: GDP growth rate of Australia for the since 2013
Source: (Tradingeconomics.com 2018)
Figure 1 has represented GDP growth rate of Australia for the last five years.
According to this diagram, the growth rate has declined significantly and has become
negative within 2016-2017, due to related economical shock like fall in investment in mining
sector and weak wage rate growth of this country. During this situation, positive contributing
to the country’s GDP has come from final consumption expenditure while net trade and non-
dwelling construction has decreased over time. Decreasing net export means, increasing
production of agricultural goods and its export has helped the country’s economy to recover
its condition again while exports of manifesting sectors have decreased. however, this GDP
growth has reached at a stable position in 2018. The above trend has shown that the GDP
growth of this country has experienced various fluctuations over the year. However, instead
of this drastic fluctuation, the country has successfully maintained its economic stability in
the international market. Moreover, the county has recovered its GDP from the negative
segment and in recent year, this growth rate has become 0.4%. This GDP growth has
influenced employment of this country as well.
Document Page
Unemployment rate of Australia:
According to Okun’s law, unemployment rate and economic growth has negative
relationship, which means, higher rate of economic growth rate can help the country to
reduce its unemployment rate for Australia, this phenomenon can be represented with the
help of statistical diagram.
Figure 2: Unemployment rate of Australia for last five years
Source: (Tradingeconomics.com 2018)
Figure 2 has represented unemployment rate of Australia since 2013 and according to
this figure, this rate has decreased after 2015. In this context, it can be seen that due to
contractioranary phase of business cycle, the rate has increased slightly at present. However,
the overall unemployment rate has decreased over time and this has represented that
economic growth of this country has increased over time.
Consumption expenditure for the last 5 years:
Based on macroeconomical concept, consumption expenditure has played a vital role
to determine a country’s total GDP where higher consumption expenditure can indicate
higher economic growth and vice versa. Hence, to know economic growth of this country, it
is essential to observe the trend of consumption expenditure of this country for the last five
years. Based on statistical data of Australia, consumption expenditure has remained 74.83%
Document Page
of the country’s GDP. Thus, this statistical figure has shown that consumption expenditure
has become an important element to develop the country’s economic growth.
Figure 3: Consumer spending of Australia for the last five years
Source: (Tradingeconomics.com 2018)
Figure 3 has represented consumer spending of Australia for the last five years. This
figure has represented a sharp increase of this expenditure since 2013 and this in turn can
indicate that national income of this country has also increased continuously. This economic
phenomenon has indicated that better confidence of consumers in market can lead the
economic growth of this country to an upward direction. Hence, to understand this more
precisely, a statistical diagram of consumer confidence of this specified country for the last
five years can be used.
tabler-icon-diamond-filled.svg

Paraphrase This Document

Need a fresh take? Get an instant paraphrase of this document with our AI Paraphraser
Document Page
Figure 4: Consumer confidence of Australia
Source: (Tradingeconomics.com 2018)
According to figure 4, consumer confidence of Australia has fluctuated drastically
over the last five years however, due to strong economical condition the value of this index
has increased gradually, which in turn has indicated that people have obtained positive
confidence to spend more money and this lead the economic growth of this country to
increase further. On the other side, decreasing consumer confidence indicates slower
economic growth while consumers prefer to decrease their expenditure. However, based on
data of 2018, it can be stated that consumer confidence has increased and this in turn has
helped the country to improve its economical condition. in 2015, this confidence index has git
its lower value though after some times, the country has gradually improved its economic
condition.
Moreover, based on the ABS data it can be state that production of household goods
has increased by 0.9% while sales of those products have also increased by 0.8% in 2017
compare to the last year. Thus, this data has proved that consumption expenditure of this
country has increased at a sustainable rate and this in turn has led the economy towards a
sustainable position.
chevron_up_icon
1 out of 5
circle_padding
hide_on_mobile
zoom_out_icon
[object Object]