Economic Growth in Australia: Mining, China & Policy (2005-2015)

Verified

Added on  2023/06/11

|9
|1644
|186
Report
AI Summary
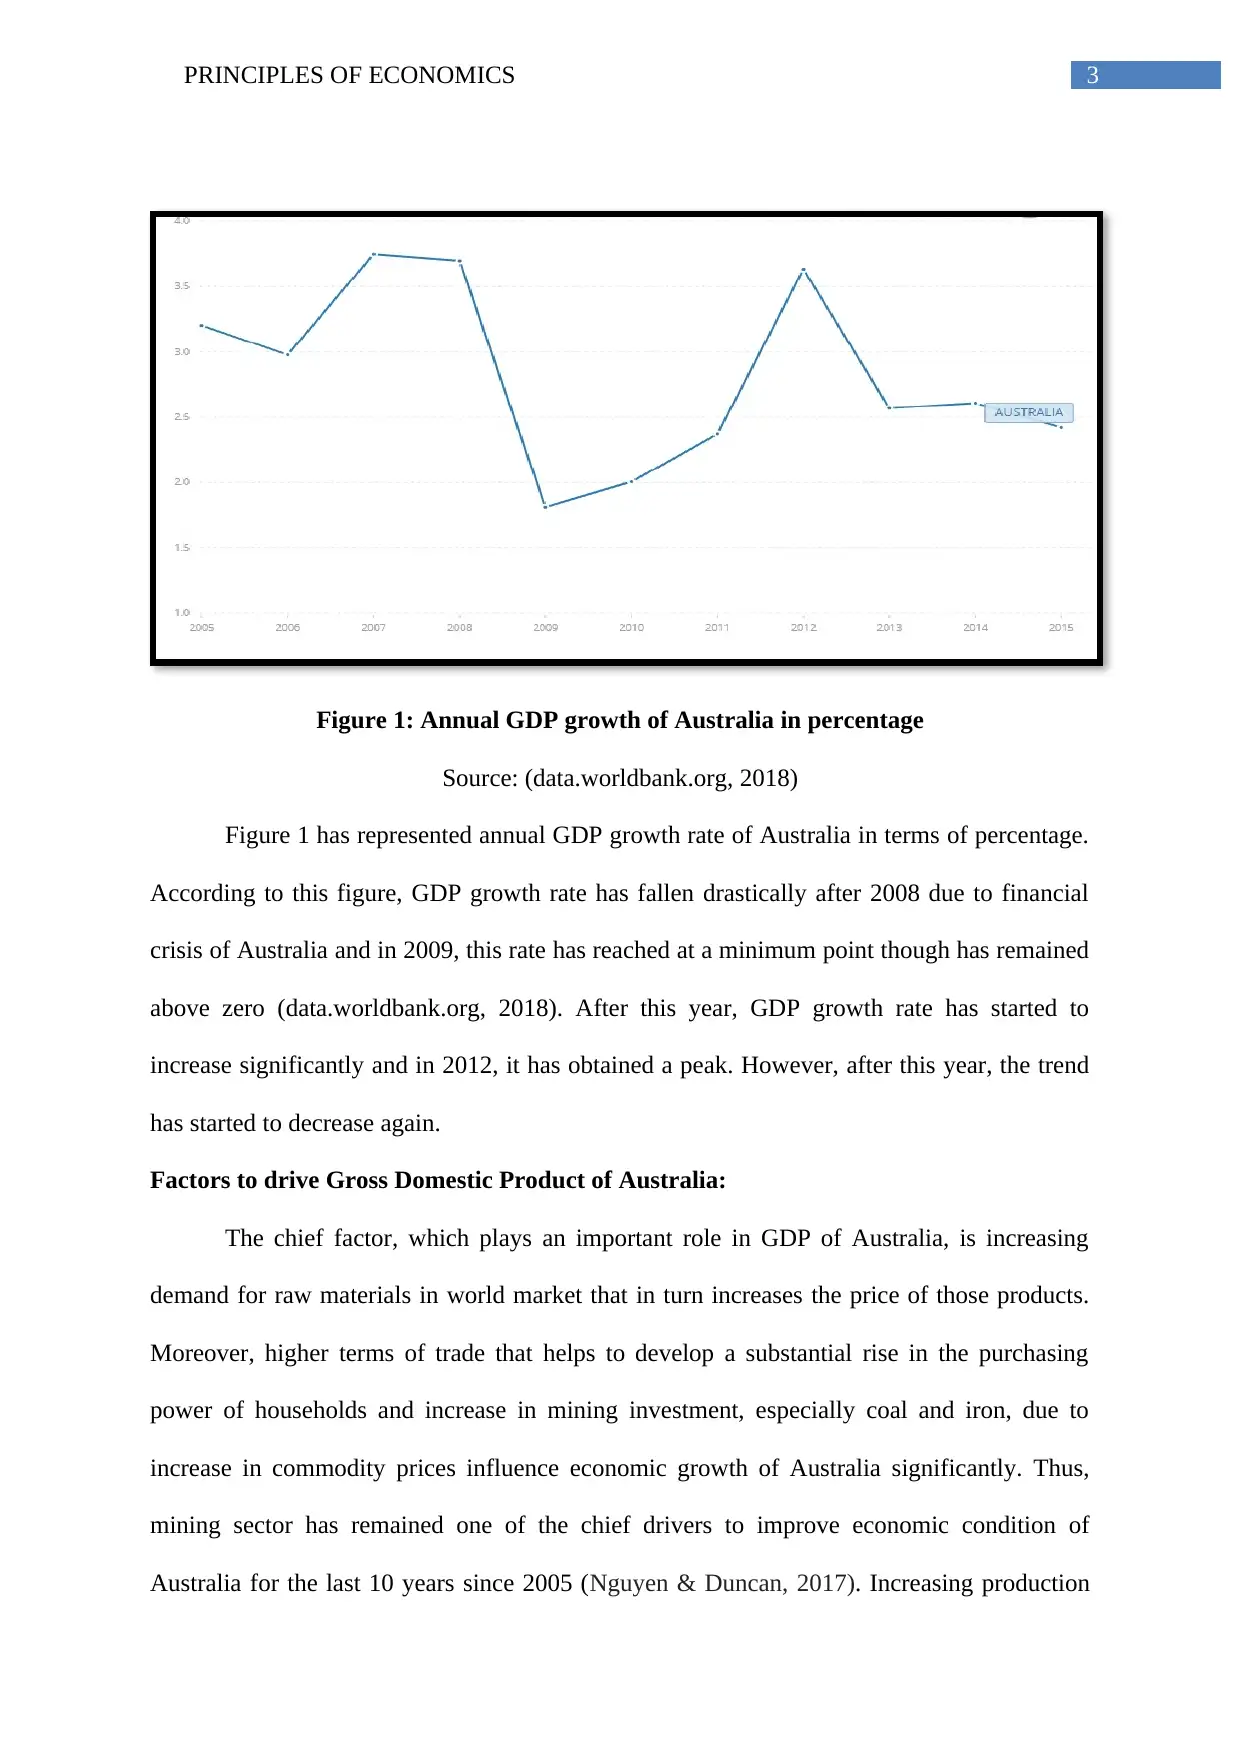
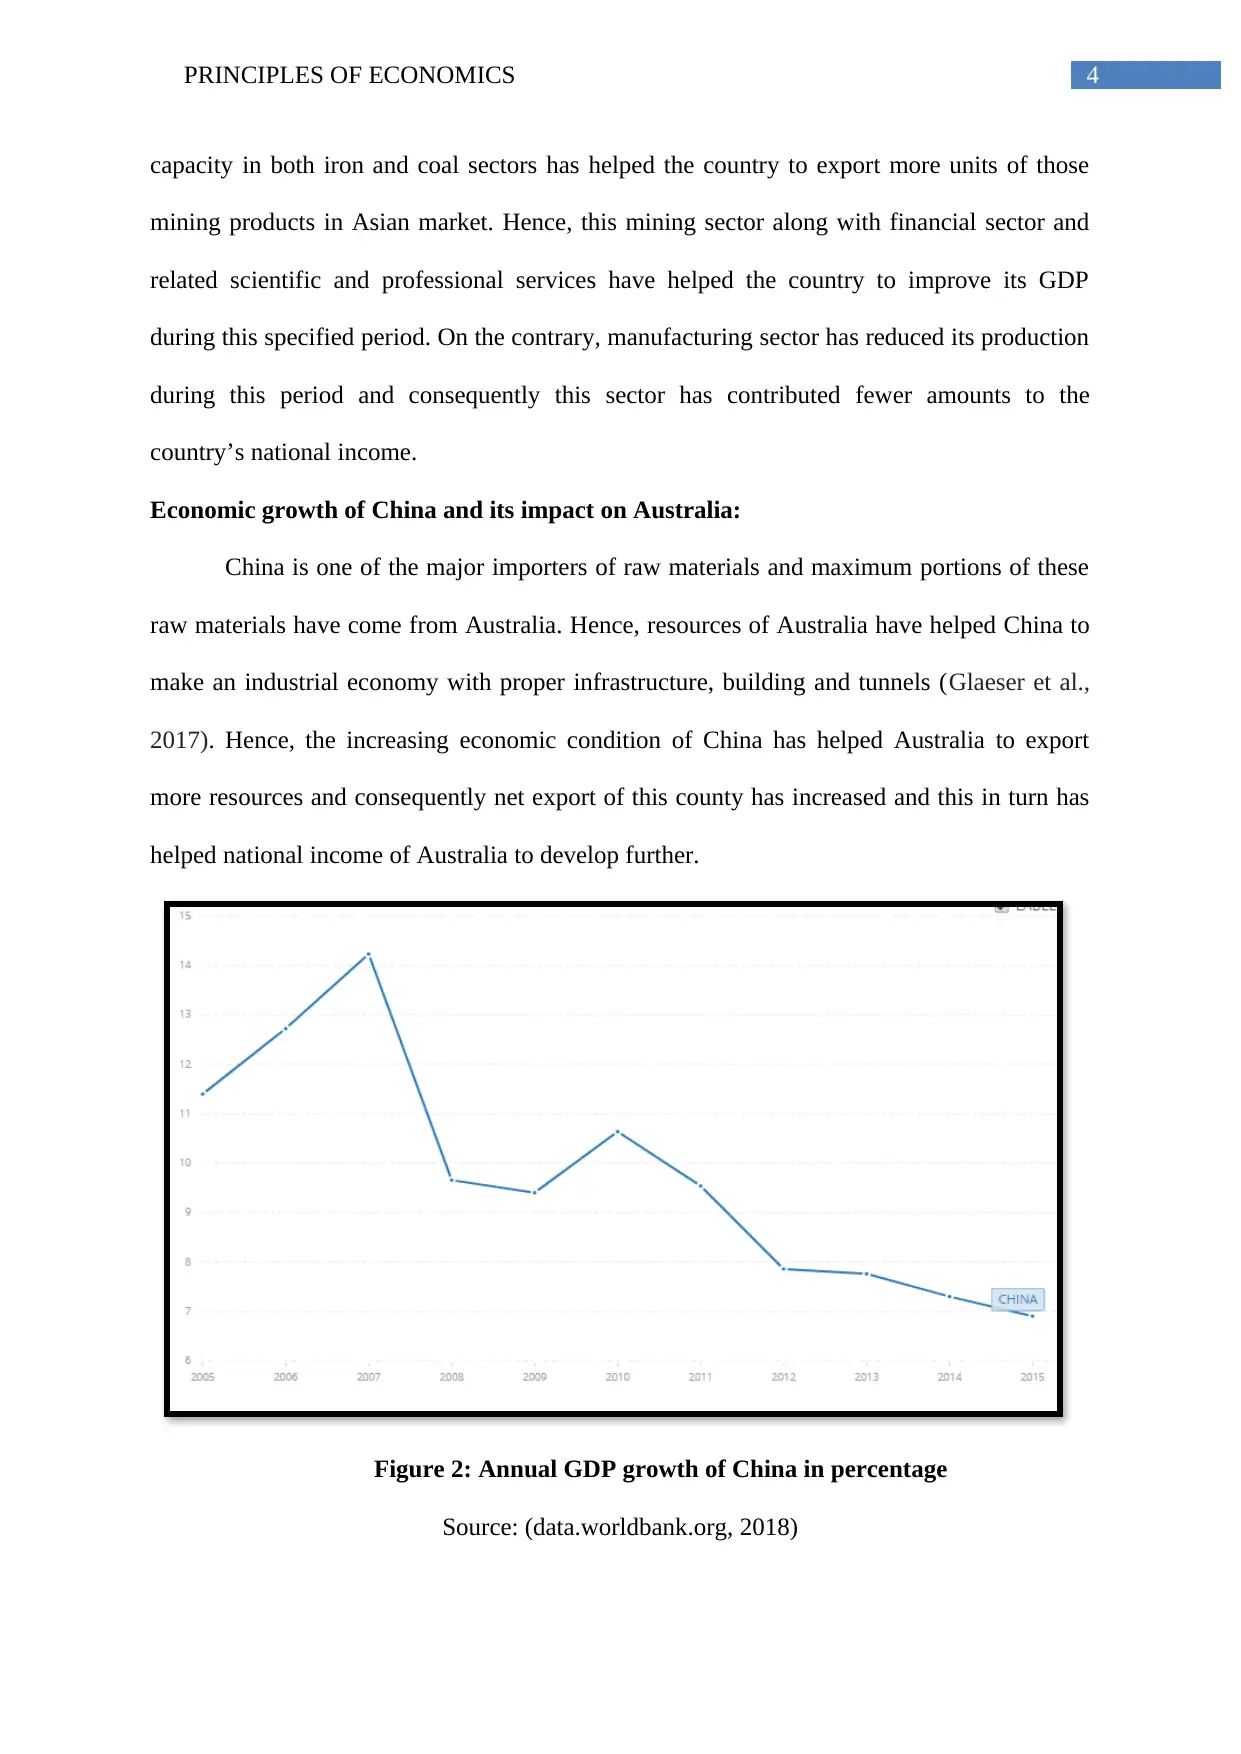
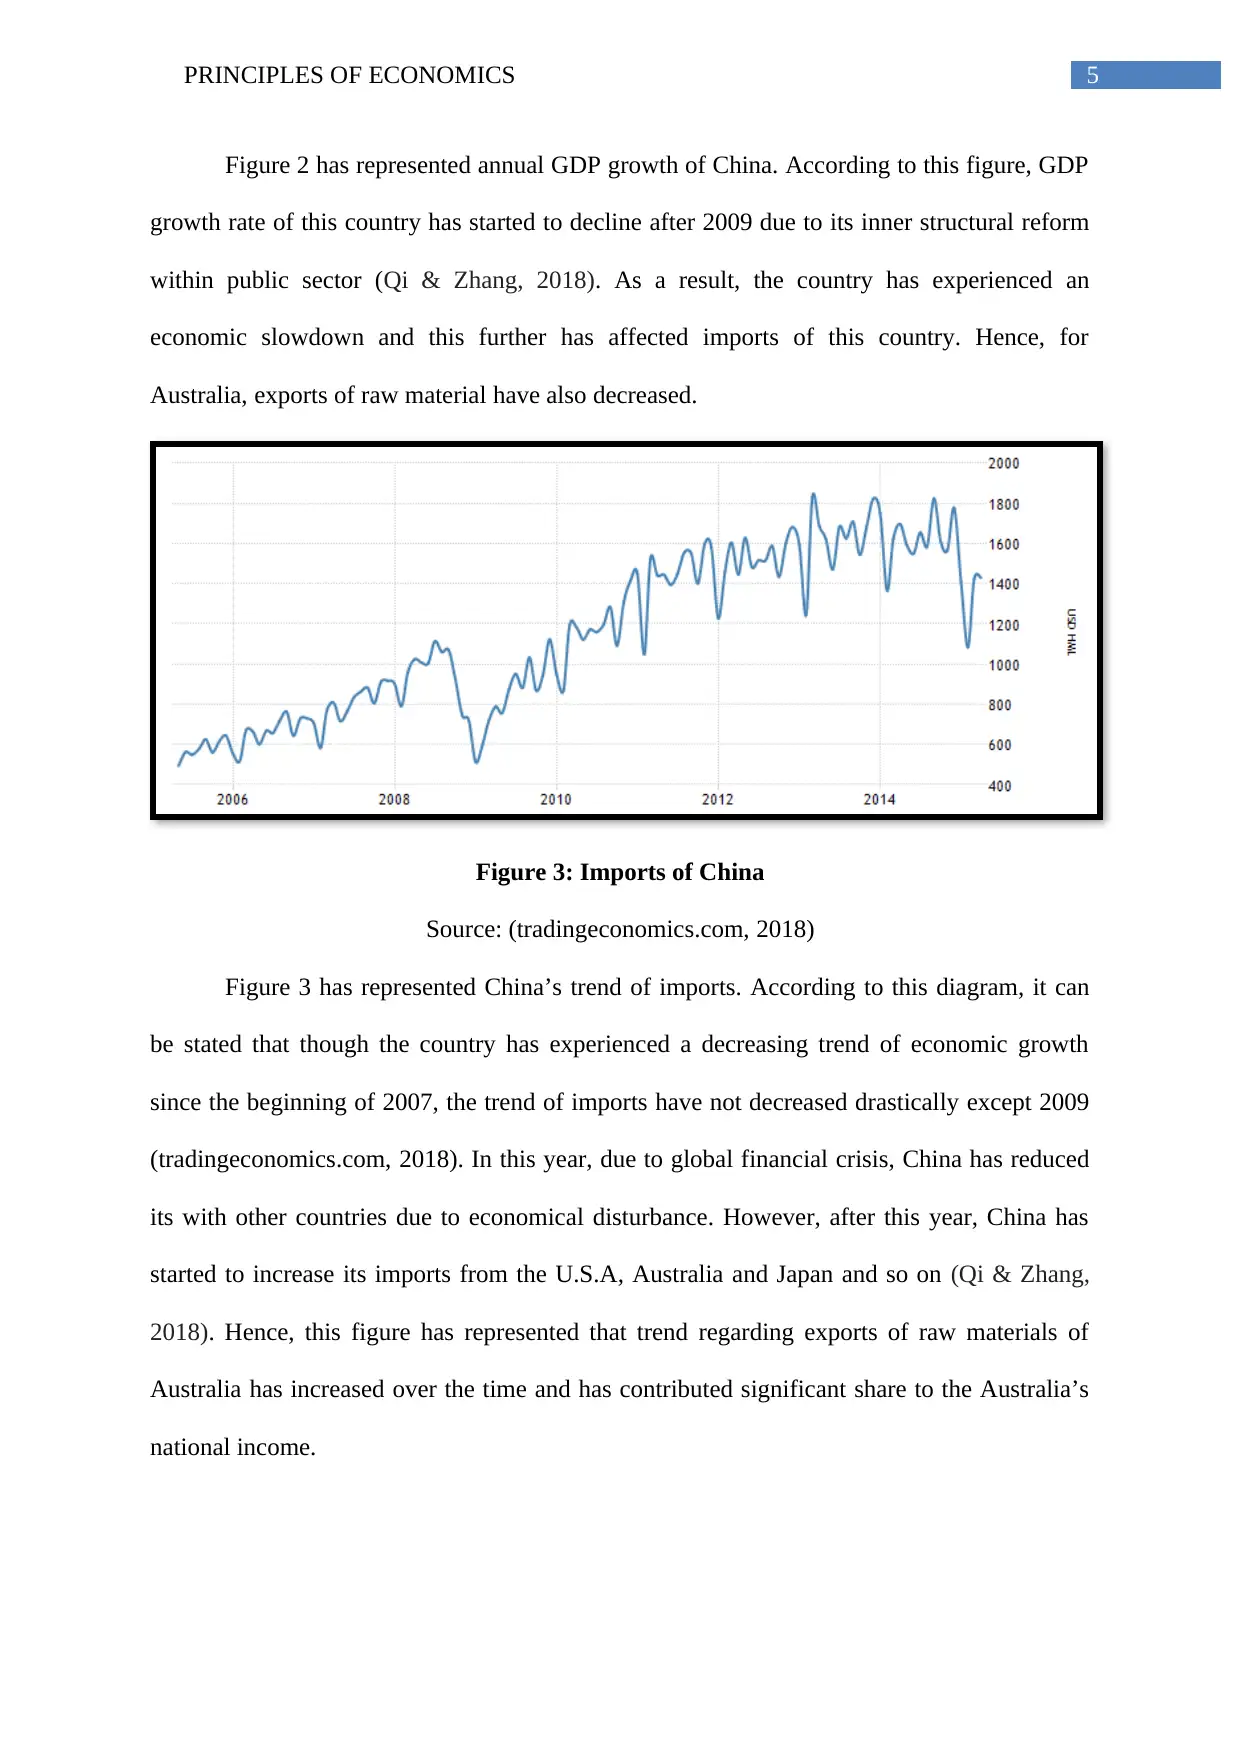
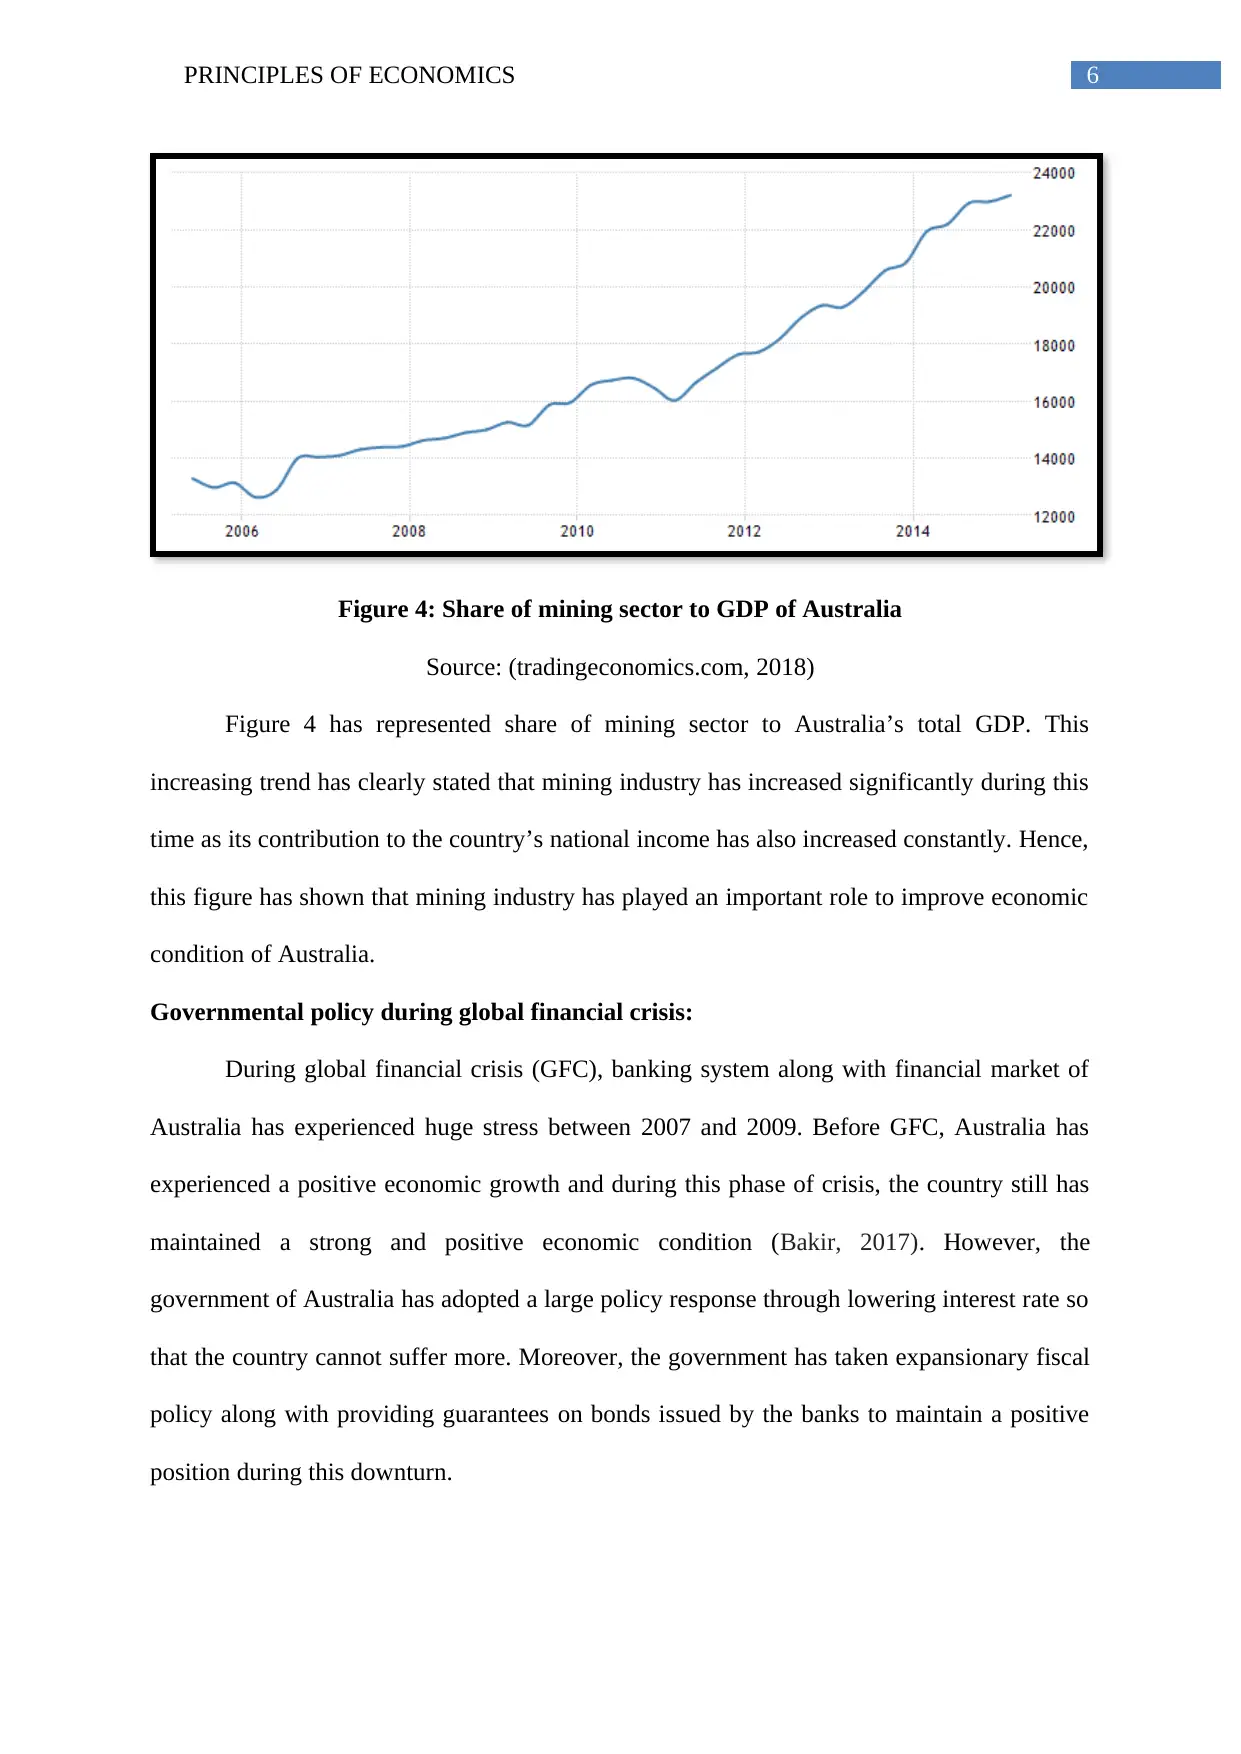
This report analyzes the fluctuations in Australia's economic growth between 2005 and 2015, attributing these variations to several key factors. The global financial crisis of 2009 significantly impacted Australia's GDP, leading to a slowdown in growth. Conversely, the development of the mining sector, driven by increasing global demand for raw materials, played a crucial role in boosting the country's economic performance. The economic growth of China, a major importer of Australian resources, also influenced Australia's GDP, with increased exports contributing to national income. Government policies implemented during the global financial crisis, such as lowering interest rates and adopting expansionary fiscal measures, helped mitigate the crisis's impact. The report also highlights the challenges of transitioning to a post-mining economy and the policy responses needed to sustain higher growth rates. Desklib offers a range of similar reports and study tools for students.
tabler-icon-diamond-filled.svg

Contribute Materials

Your contribution can guide someone’s learning journey. Share your documents today.
Document Page
Running head: PRINCIPLES OF ECONOMICS
Principles of economics
Name of the student
Name o the university
Author Note
tabler-icon-diamond-filled.svg

Secure Best Marks with AI Grader

Need help grading? Try our AI Grader for instant feedback on your assignments.
Document Page
1PRINCIPLES OF ECONOMICS
Table of Contents
Introduction:...............................................................................................................................2
Reasons for the variation of Australia’s growth rate:................................................................2
Factors to drive Gross Domestic Product of Australia:.............................................................3
Economic growth of China and its impact on Australia:...........................................................4
Governmental policy during global financial crisis:..................................................................6
Conclusion:................................................................................................................................7
References:.................................................................................................................................8
Document Page
2PRINCIPLES OF ECONOMICS
Introduction:
Growth rate for an economy represents the annual rate of change based on which
gross national income (GDP) of a country increases or decreases. Hence, this growth rate
helps to measure recession or expansion of a country, for instance, two consecutive years of
GDP decline indicates that the country is experiencing a recessionary period. Moreover, this
measurement helps to understand the economic performance of a nation more precisely and
at the same time, other factors can be analysed for which this GDP growth can change
drastically. Hence, this report has intended to observe and analyse those factors for which
economic growth of Australia has fluctuated drastically between 2005 and 2015 (Anderson,
2017).
Hence, to discuss the affect for changing economic growth of Australia, it can be
beneficial to analyse the increasing economic condition of China and its impact on
Australia’s economic growth along with boom in mining industry of Australia and global
financial crisis.
Reasons for the variation of Australia’s growth rate:
Australia has experienced great recession during 1999 to 2008 and for this
GDP growth rate between 2005 and 2008 has remained around 3.4% on an average for each
year. After that, in 2009 economic growth of this country has slowed down to 1.6% due to
global financial crisis. Hence, this year has remained the worst year for this country after the
recession of 1991. However, instead of this drastic fall in GDP growth rate, Australia has
remained one of those few developed countries, which have secured positive value of GDP in
2009. After this year, economic performance of this country has improved and consequently
the country has experienced GDP growth of an average of 2.7% from 2010 to 2013
(Anderson, 2017). Hence, this dynamic changing pattern of Australia’s total GDP can be
explained with the help of an appropriate diagram.
Document Page
3PRINCIPLES OF ECONOMICS
Figure 1: Annual GDP growth of Australia in percentage
Source: (data.worldbank.org, 2018)
Figure 1 has represented annual GDP growth rate of Australia in terms of percentage.
According to this figure, GDP growth rate has fallen drastically after 2008 due to financial
crisis of Australia and in 2009, this rate has reached at a minimum point though has remained
above zero (data.worldbank.org, 2018). After this year, GDP growth rate has started to
increase significantly and in 2012, it has obtained a peak. However, after this year, the trend
has started to decrease again.
Factors to drive Gross Domestic Product of Australia:
The chief factor, which plays an important role in GDP of Australia, is increasing
demand for raw materials in world market that in turn increases the price of those products.
Moreover, higher terms of trade that helps to develop a substantial rise in the purchasing
power of households and increase in mining investment, especially coal and iron, due to
increase in commodity prices influence economic growth of Australia significantly. Thus,
mining sector has remained one of the chief drivers to improve economic condition of
Australia for the last 10 years since 2005 (Nguyen & Duncan, 2017). Increasing production
tabler-icon-diamond-filled.svg

Secure Best Marks with AI Grader

Need help grading? Try our AI Grader for instant feedback on your assignments.
Document Page
4PRINCIPLES OF ECONOMICS
capacity in both iron and coal sectors has helped the country to export more units of those
mining products in Asian market. Hence, this mining sector along with financial sector and
related scientific and professional services have helped the country to improve its GDP
during this specified period. On the contrary, manufacturing sector has reduced its production
during this period and consequently this sector has contributed fewer amounts to the
country’s national income.
Economic growth of China and its impact on Australia:
China is one of the major importers of raw materials and maximum portions of these
raw materials have come from Australia. Hence, resources of Australia have helped China to
make an industrial economy with proper infrastructure, building and tunnels (Glaeser et al.,
2017). Hence, the increasing economic condition of China has helped Australia to export
more resources and consequently net export of this county has increased and this in turn has
helped national income of Australia to develop further.
Figure 2: Annual GDP growth of China in percentage
Source: (data.worldbank.org, 2018)
Document Page
5PRINCIPLES OF ECONOMICS
Figure 2 has represented annual GDP growth of China. According to this figure, GDP
growth rate of this country has started to decline after 2009 due to its inner structural reform
within public sector (Qi & Zhang, 2018). As a result, the country has experienced an
economic slowdown and this further has affected imports of this country. Hence, for
Australia, exports of raw material have also decreased.
Figure 3: Imports of China
Source: (tradingeconomics.com, 2018)
Figure 3 has represented China’s trend of imports. According to this diagram, it can
be stated that though the country has experienced a decreasing trend of economic growth
since the beginning of 2007, the trend of imports have not decreased drastically except 2009
(tradingeconomics.com, 2018). In this year, due to global financial crisis, China has reduced
its with other countries due to economical disturbance. However, after this year, China has
started to increase its imports from the U.S.A, Australia and Japan and so on (Qi & Zhang,
2018). Hence, this figure has represented that trend regarding exports of raw materials of
Australia has increased over the time and has contributed significant share to the Australia’s
national income.
Document Page
6PRINCIPLES OF ECONOMICS
Figure 4: Share of mining sector to GDP of Australia
Source: (tradingeconomics.com, 2018)
Figure 4 has represented share of mining sector to Australia’s total GDP. This
increasing trend has clearly stated that mining industry has increased significantly during this
time as its contribution to the country’s national income has also increased constantly. Hence,
this figure has shown that mining industry has played an important role to improve economic
condition of Australia.
Governmental policy during global financial crisis:
During global financial crisis (GFC), banking system along with financial market of
Australia has experienced huge stress between 2007 and 2009. Before GFC, Australia has
experienced a positive economic growth and during this phase of crisis, the country still has
maintained a strong and positive economic condition (Bakir, 2017). However, the
government of Australia has adopted a large policy response through lowering interest rate so
that the country cannot suffer more. Moreover, the government has taken expansionary fiscal
policy along with providing guarantees on bonds issued by the banks to maintain a positive
position during this downturn.
tabler-icon-diamond-filled.svg

Paraphrase This Document

Need a fresh take? Get an instant paraphrase of this document with our AI Paraphraser
Document Page
7PRINCIPLES OF ECONOMICS
Conclusion:
Thus, from above discussion it can be stated that economic growth of Australia has
experienced various external affected during 2005 and 2015 among which, global financial
crisis in 2009 has played a major role. On other side, development of mining sector and
economic growth and downfall of China can also be considered as important reasons behind
this huge fluctuation of Australia.
Document Page
8PRINCIPLES OF ECONOMICS
References:
Anderson, K. (2017). Sectoral Trends and Shocks in Australia's Economic
Growth. Australian Economic History Review, 57(1), 2-21.
Australia GDP From Mining | 1974-2018 | Data | Chart | Calendar | Forecast. (2018).
Retrieved from https://tradingeconomics.com/australia/gdp-from-mining
Bakir, C. (2017). How can interactions among interdependent structures, institutions, and
agents inform financial stability? What we have still to learn from global financial
crisis. Policy Sciences, 50(2), 217-239.
GDP growth (annual %) | Data. (2018). Retrieved from
https://data.worldbank.org/indicator/NY.GDP.MKTP.KD.ZG?
end=2015&locations=CN&start=2005
GDP growth (annual %) | Data. 2018. Retrieved from
https://data.worldbank.org/indicator/NY.GDP.MKTP.KD.ZG?
end=2015&locations=AU&start=2005
Glaeser, E., Huang, W., Ma, Y., & Shleifer, A. (2017). A real estate boom with Chinese
Characteristics. Journal of Economic Perspectives, 31(1), 93-116.
Nguyen, H. T., & Duncan, A. S. (2017). Exchange rate fluctuations and immigrants' labour
market outcomes: New evidence from Australian household panel data. Journal of
International Economics, 105, 174-186.
Qi, C., & Zhang, J. X. (2018). The economic impacts of the China-Australia Free Trade
Agreement-A general equilibrium analysis. China Economic Review, 47, 1-11.
chevron_up_icon
1 out of 9
circle_padding
hide_on_mobile
zoom_out_icon
logo.png

Your All-in-One AI-Powered Toolkit for Academic Success.

Available 24*7 on WhatsApp / Email

[object Object]