Economics Assignment: Australia's Macroeconomic Performance Analysis
VerifiedAdded on 2021/06/17
|13
|3611
|62
Report
AI Summary
This economics assignment analyzes the macroeconomic performance of Australia from 1990 to 2016, evaluating key indicators like real GDP growth, inflation, unemployment, exchange rates, net exports, and cash rates. The report investigates the relationships between real GDP growth, inflation, and unemployment, as well as the connection between the cash rate and the Federal Reserve's fund rate. It also examines the relationship between net exports and the real exchange rate. The analysis includes statistical summaries, time series graphs, and discussions of business cycles to provide a comprehensive understanding of the Australian economy's trends and fluctuations over the specified period, offering insights into the country's economic outlook. The report concludes with a brief overview of the future prospects of the Australian economy based on its past performance.
Running Head: ECONOMICS ASSIGNMENT
Economics Assignment
Name of the Student
Name of the University
Course ID
Economics Assignment
Name of the Student
Name of the University
Course ID
Paraphrase This Document
Need a fresh take? Get an instant paraphrase of this document with our AI Paraphraser
1ECONOMICS ASSIGNMENT
Executive Summary
The paper sheds light on macroeconomic performance of Australia for a considerably long
period extending from 1990 to 2016. The performance has been evaluated in terms of real GDP
growth rate, inflation, unemployment rate, exchange rate, net export and cash rate. In the
process, the report tries to find whether there exists any relation between trend in real GDP
growth rate and that of inflation and unemployment. The decision regarding cash rate is often
influenced by the movement of interest rate in other nation. In this regard, focus is also given to
trace out any association between cash rate and federal’s fund rate. The movement of grade
balance is examined along with the movement of official exchange rate. Finally, based on the
past performance brief description is given on future outlook of the economy.
2ECONOMICS ASSIGNMENT
Table of Contents
Introduction......................................................................................................................................3
Relation between real GDP growth and inflation and unemployment rate.....................................3
Real GDP growth and inflation...................................................................................................3
Real GDP growth and unemployment rate..................................................................................4
Relation between net export and real exchange rate between Australia and USA..........................6
Australia’s cash rate and Federal Reserve’s fund rate.....................................................................8
Macroeconomic Outlook for Australia............................................................................................9
Conclusion.......................................................................................................................................9
Reference list.................................................................................................................................11
⊘ This is a preview!⊘
Do you want full access?
Subscribe today to unlock all pages.
Trusted by 1+ million students worldwide
3ECONOMICS ASSIGNMENT
Introduction
Australia is the 14th largest economy in the world. The nation in the past few decades
have accounted an outstanding growth and development. Service sector is the most dominating
sector of the economy making the highest contribution in GDP. Australia also has a strong
industrial and agricultural sector. The nation shares international relation with a number of
developed and developing nations. Trade account a significant portion of Australia’s GDP. In the
last few years however Australia has accounted a decline in is economic growth rate (RBA,
2018). The steady performance of Australian economy makes it an interesting area of research.
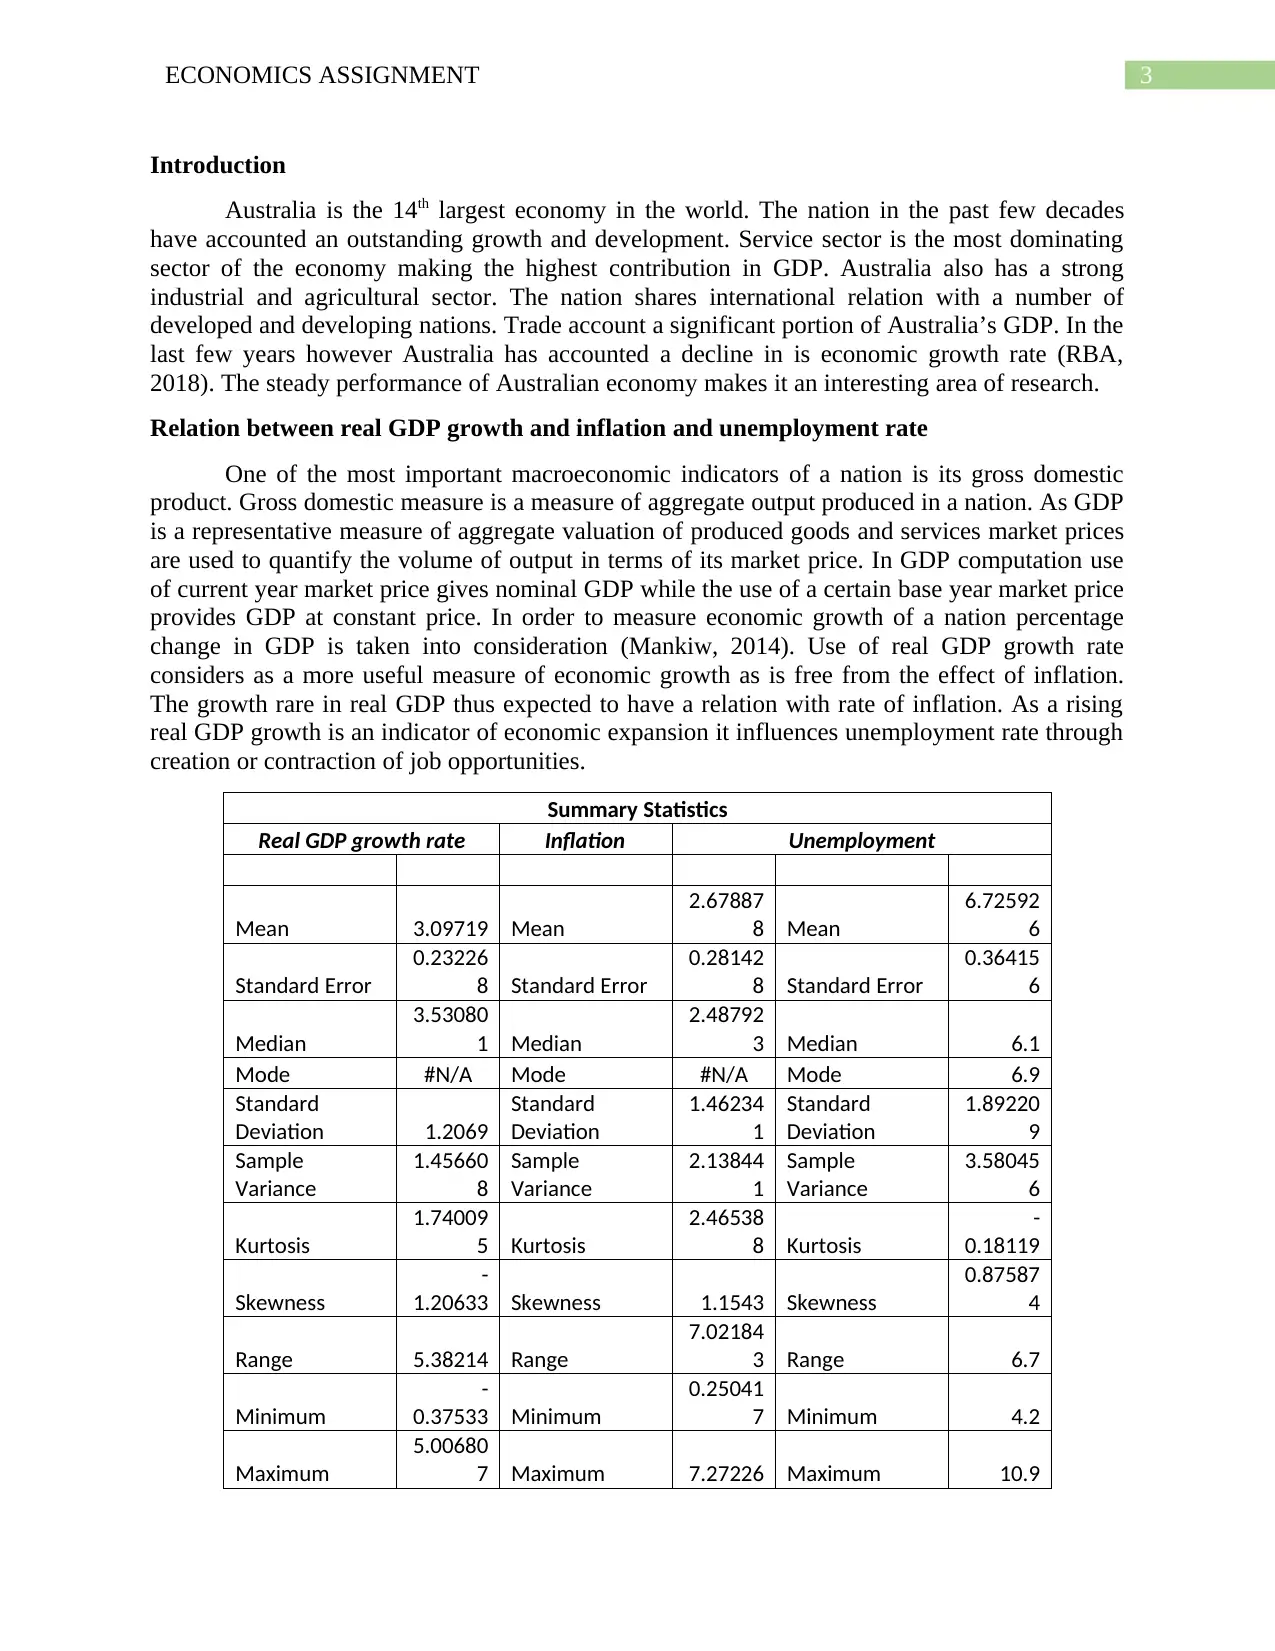
Relation between real GDP growth and inflation and unemployment rate
One of the most important macroeconomic indicators of a nation is its gross domestic
product. Gross domestic measure is a measure of aggregate output produced in a nation. As GDP
is a representative measure of aggregate valuation of produced goods and services market prices
are used to quantify the volume of output in terms of its market price. In GDP computation use
of current year market price gives nominal GDP while the use of a certain base year market price
provides GDP at constant price. In order to measure economic growth of a nation percentage
change in GDP is taken into consideration (Mankiw, 2014). Use of real GDP growth rate
considers as a more useful measure of economic growth as is free from the effect of inflation.
The growth rare in real GDP thus expected to have a relation with rate of inflation. As a rising
real GDP growth is an indicator of economic expansion it influences unemployment rate through
creation or contraction of job opportunities.
Summary Statistics
Real GDP growth rate Inflation Unemployment
Mean 3.09719 Mean
2.67887
8 Mean
6.72592
6
Standard Error
0.23226
8 Standard Error
0.28142
8 Standard Error
0.36415
6
Median
3.53080
1 Median
2.48792
3 Median 6.1
Mode #N/A Mode #N/A Mode 6.9
Standard
Deviation 1.2069
Standard
Deviation
1.46234
1
Standard
Deviation
1.89220
9
Sample
Variance
1.45660
8
Sample
Variance
2.13844
1
Sample
Variance
3.58045
6
Kurtosis
1.74009
5 Kurtosis
2.46538
8 Kurtosis
-
0.18119
Skewness
-
1.20633 Skewness 1.1543 Skewness
0.87587
4
Range 5.38214 Range
7.02184
3 Range 6.7
Minimum
-
0.37533 Minimum
0.25041
7 Minimum 4.2
Maximum
5.00680
7 Maximum 7.27226 Maximum 10.9
Introduction
Australia is the 14th largest economy in the world. The nation in the past few decades
have accounted an outstanding growth and development. Service sector is the most dominating
sector of the economy making the highest contribution in GDP. Australia also has a strong
industrial and agricultural sector. The nation shares international relation with a number of
developed and developing nations. Trade account a significant portion of Australia’s GDP. In the
last few years however Australia has accounted a decline in is economic growth rate (RBA,
2018). The steady performance of Australian economy makes it an interesting area of research.
Relation between real GDP growth and inflation and unemployment rate
One of the most important macroeconomic indicators of a nation is its gross domestic
product. Gross domestic measure is a measure of aggregate output produced in a nation. As GDP
is a representative measure of aggregate valuation of produced goods and services market prices
are used to quantify the volume of output in terms of its market price. In GDP computation use
of current year market price gives nominal GDP while the use of a certain base year market price
provides GDP at constant price. In order to measure economic growth of a nation percentage
change in GDP is taken into consideration (Mankiw, 2014). Use of real GDP growth rate
considers as a more useful measure of economic growth as is free from the effect of inflation.
The growth rare in real GDP thus expected to have a relation with rate of inflation. As a rising
real GDP growth is an indicator of economic expansion it influences unemployment rate through
creation or contraction of job opportunities.
Summary Statistics
Real GDP growth rate Inflation Unemployment
Mean 3.09719 Mean
2.67887
8 Mean
6.72592
6
Standard Error
0.23226
8 Standard Error
0.28142
8 Standard Error
0.36415
6
Median
3.53080
1 Median
2.48792
3 Median 6.1
Mode #N/A Mode #N/A Mode 6.9
Standard
Deviation 1.2069
Standard
Deviation
1.46234
1
Standard
Deviation
1.89220
9
Sample
Variance
1.45660
8
Sample
Variance
2.13844
1
Sample
Variance
3.58045
6
Kurtosis
1.74009
5 Kurtosis
2.46538
8 Kurtosis
-
0.18119
Skewness
-
1.20633 Skewness 1.1543 Skewness
0.87587
4
Range 5.38214 Range
7.02184
3 Range 6.7
Minimum
-
0.37533 Minimum
0.25041
7 Minimum 4.2
Maximum
5.00680
7 Maximum 7.27226 Maximum 10.9
Paraphrase This Document
Need a fresh take? Get an instant paraphrase of this document with our AI Paraphraser
4ECONOMICS ASSIGNMENT
Sum
83.6241
4 Sum 72.3297 Sum 181.6
Count 27 Count 27 Count 27
Real GDP growth and inflation
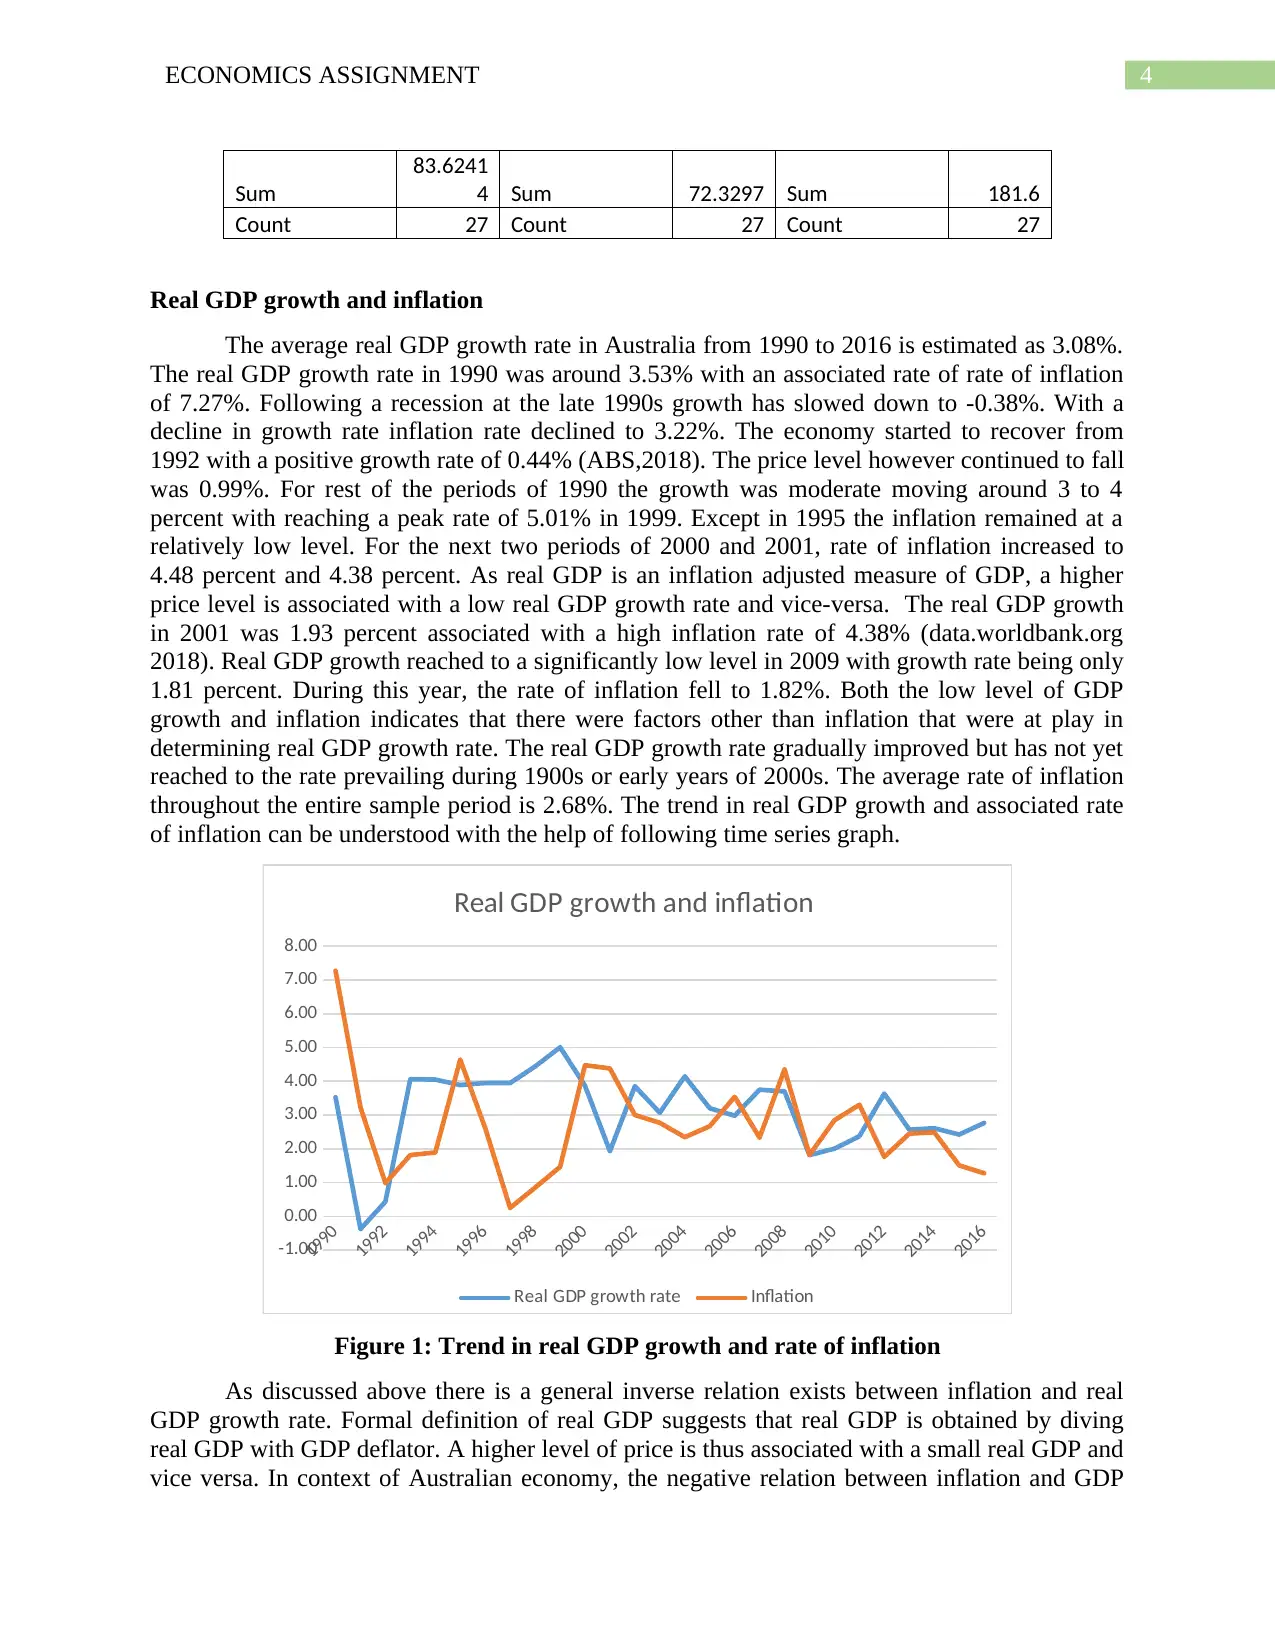
The average real GDP growth rate in Australia from 1990 to 2016 is estimated as 3.08%.
The real GDP growth rate in 1990 was around 3.53% with an associated rate of rate of inflation
of 7.27%. Following a recession at the late 1990s growth has slowed down to -0.38%. With a
decline in growth rate inflation rate declined to 3.22%. The economy started to recover from
1992 with a positive growth rate of 0.44% (ABS,2018). The price level however continued to fall
was 0.99%. For rest of the periods of 1990 the growth was moderate moving around 3 to 4
percent with reaching a peak rate of 5.01% in 1999. Except in 1995 the inflation remained at a
relatively low level. For the next two periods of 2000 and 2001, rate of inflation increased to
4.48 percent and 4.38 percent. As real GDP is an inflation adjusted measure of GDP, a higher
price level is associated with a low real GDP growth rate and vice-versa. The real GDP growth
in 2001 was 1.93 percent associated with a high inflation rate of 4.38% (data.worldbank.org
2018). Real GDP growth reached to a significantly low level in 2009 with growth rate being only
1.81 percent. During this year, the rate of inflation fell to 1.82%. Both the low level of GDP
growth and inflation indicates that there were factors other than inflation that were at play in
determining real GDP growth rate. The real GDP growth rate gradually improved but has not yet
reached to the rate prevailing during 1900s or early years of 2000s. The average rate of inflation
throughout the entire sample period is 2.68%. The trend in real GDP growth and associated rate
of inflation can be understood with the help of following time series graph.
1990
1992
1994
1996
1998
2000
2002
2004
2006
2008
2010
2012
2014
2016
-1.00
0.00
1.00
2.00
3.00
4.00
5.00
6.00
7.00
8.00
Real GDP growth and inflation
Real GDP growth rate Inflation
Figure 1: Trend in real GDP growth and rate of inflation
As discussed above there is a general inverse relation exists between inflation and real
GDP growth rate. Formal definition of real GDP suggests that real GDP is obtained by diving
real GDP with GDP deflator. A higher level of price is thus associated with a small real GDP and
vice versa. In context of Australian economy, the negative relation between inflation and GDP
Sum
83.6241
4 Sum 72.3297 Sum 181.6
Count 27 Count 27 Count 27
Real GDP growth and inflation
The average real GDP growth rate in Australia from 1990 to 2016 is estimated as 3.08%.
The real GDP growth rate in 1990 was around 3.53% with an associated rate of rate of inflation
of 7.27%. Following a recession at the late 1990s growth has slowed down to -0.38%. With a
decline in growth rate inflation rate declined to 3.22%. The economy started to recover from
1992 with a positive growth rate of 0.44% (ABS,2018). The price level however continued to fall
was 0.99%. For rest of the periods of 1990 the growth was moderate moving around 3 to 4
percent with reaching a peak rate of 5.01% in 1999. Except in 1995 the inflation remained at a
relatively low level. For the next two periods of 2000 and 2001, rate of inflation increased to
4.48 percent and 4.38 percent. As real GDP is an inflation adjusted measure of GDP, a higher
price level is associated with a low real GDP growth rate and vice-versa. The real GDP growth
in 2001 was 1.93 percent associated with a high inflation rate of 4.38% (data.worldbank.org
2018). Real GDP growth reached to a significantly low level in 2009 with growth rate being only
1.81 percent. During this year, the rate of inflation fell to 1.82%. Both the low level of GDP
growth and inflation indicates that there were factors other than inflation that were at play in
determining real GDP growth rate. The real GDP growth rate gradually improved but has not yet
reached to the rate prevailing during 1900s or early years of 2000s. The average rate of inflation
throughout the entire sample period is 2.68%. The trend in real GDP growth and associated rate
of inflation can be understood with the help of following time series graph.
1990
1992
1994
1996
1998
2000
2002
2004
2006
2008
2010
2012
2014
2016
-1.00
0.00
1.00
2.00
3.00
4.00
5.00
6.00
7.00
8.00
Real GDP growth and inflation
Real GDP growth rate Inflation
Figure 1: Trend in real GDP growth and rate of inflation
As discussed above there is a general inverse relation exists between inflation and real
GDP growth rate. Formal definition of real GDP suggests that real GDP is obtained by diving
real GDP with GDP deflator. A higher level of price is thus associated with a small real GDP and
vice versa. In context of Australian economy, the negative relation between inflation and GDP
5ECONOMICS ASSIGNMENT
growth is found to be valid for most of the years (Svensson, 2015). However, there are some
exception years where both real GDP and inflation declined simultaneously. These are the period
of entire economic slowdown. Such periods include late 1990s to 1991 and in 2009.
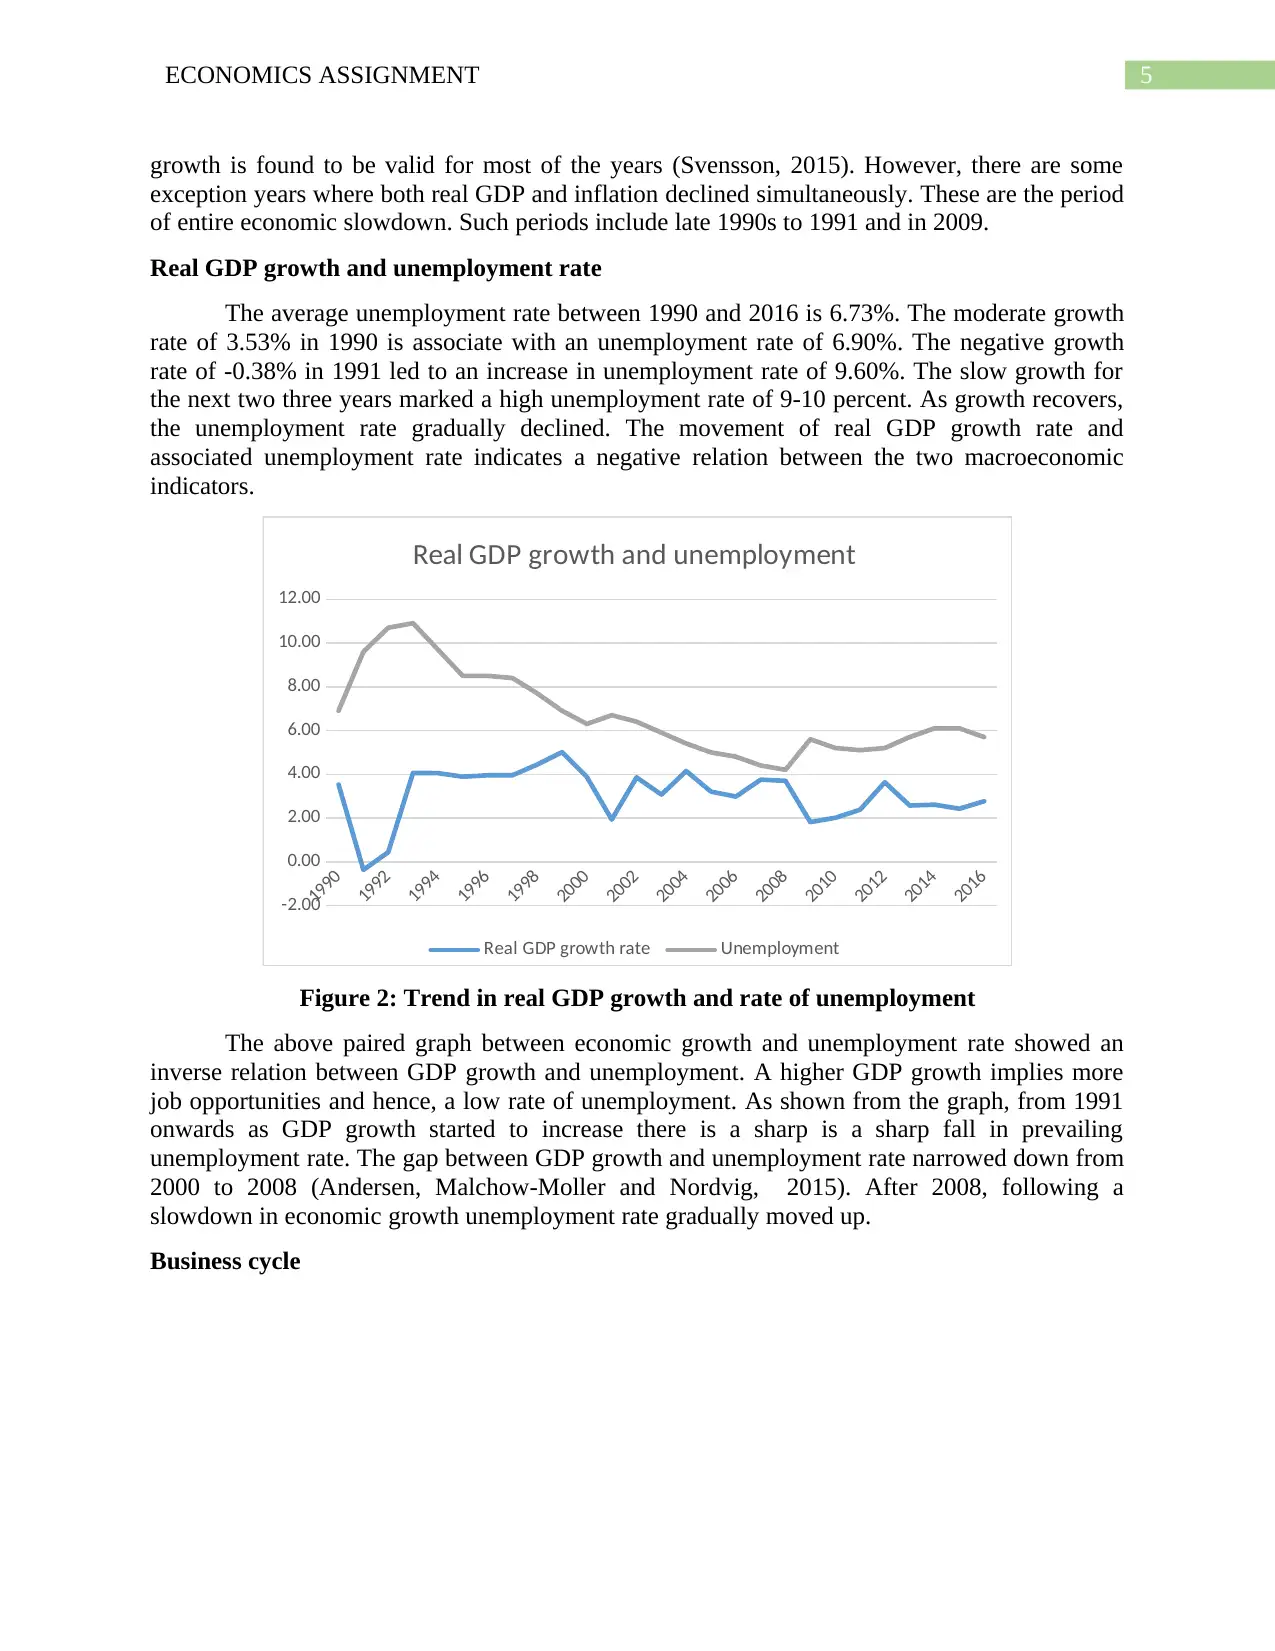
Real GDP growth and unemployment rate
The average unemployment rate between 1990 and 2016 is 6.73%. The moderate growth
rate of 3.53% in 1990 is associate with an unemployment rate of 6.90%. The negative growth
rate of -0.38% in 1991 led to an increase in unemployment rate of 9.60%. The slow growth for
the next two three years marked a high unemployment rate of 9-10 percent. As growth recovers,
the unemployment rate gradually declined. The movement of real GDP growth rate and
associated unemployment rate indicates a negative relation between the two macroeconomic
indicators.
1990
1992
1994
1996
1998
2000
2002
2004
2006
2008
2010
2012
2014
2016
-2.00
0.00
2.00
4.00
6.00
8.00
10.00
12.00
Real GDP growth and unemployment
Real GDP growth rate Unemployment
Figure 2: Trend in real GDP growth and rate of unemployment
The above paired graph between economic growth and unemployment rate showed an
inverse relation between GDP growth and unemployment. A higher GDP growth implies more
job opportunities and hence, a low rate of unemployment. As shown from the graph, from 1991
onwards as GDP growth started to increase there is a sharp is a sharp fall in prevailing
unemployment rate. The gap between GDP growth and unemployment rate narrowed down from
2000 to 2008 (Andersen, Malchow-Moller and Nordvig, 2015). After 2008, following a
slowdown in economic growth unemployment rate gradually moved up.
Business cycle
growth is found to be valid for most of the years (Svensson, 2015). However, there are some
exception years where both real GDP and inflation declined simultaneously. These are the period
of entire economic slowdown. Such periods include late 1990s to 1991 and in 2009.
Real GDP growth and unemployment rate
The average unemployment rate between 1990 and 2016 is 6.73%. The moderate growth
rate of 3.53% in 1990 is associate with an unemployment rate of 6.90%. The negative growth
rate of -0.38% in 1991 led to an increase in unemployment rate of 9.60%. The slow growth for
the next two three years marked a high unemployment rate of 9-10 percent. As growth recovers,
the unemployment rate gradually declined. The movement of real GDP growth rate and
associated unemployment rate indicates a negative relation between the two macroeconomic
indicators.
1990
1992
1994
1996
1998
2000
2002
2004
2006
2008
2010
2012
2014
2016
-2.00
0.00
2.00
4.00
6.00
8.00
10.00
12.00
Real GDP growth and unemployment
Real GDP growth rate Unemployment
Figure 2: Trend in real GDP growth and rate of unemployment
The above paired graph between economic growth and unemployment rate showed an
inverse relation between GDP growth and unemployment. A higher GDP growth implies more
job opportunities and hence, a low rate of unemployment. As shown from the graph, from 1991
onwards as GDP growth started to increase there is a sharp is a sharp fall in prevailing
unemployment rate. The gap between GDP growth and unemployment rate narrowed down from
2000 to 2008 (Andersen, Malchow-Moller and Nordvig, 2015). After 2008, following a
slowdown in economic growth unemployment rate gradually moved up.
Business cycle
⊘ This is a preview!⊘
Do you want full access?
Subscribe today to unlock all pages.
Trusted by 1+ million students worldwide
6ECONOMICS ASSIGNMENT
1990
1992
1994
1996
1998
2000
2002
2004
2006
2008
2010
2012
2014
2016
-1.00
0.00
1.00
2.00
3.00
4.00
5.00
6.00
Real GDP growth rate
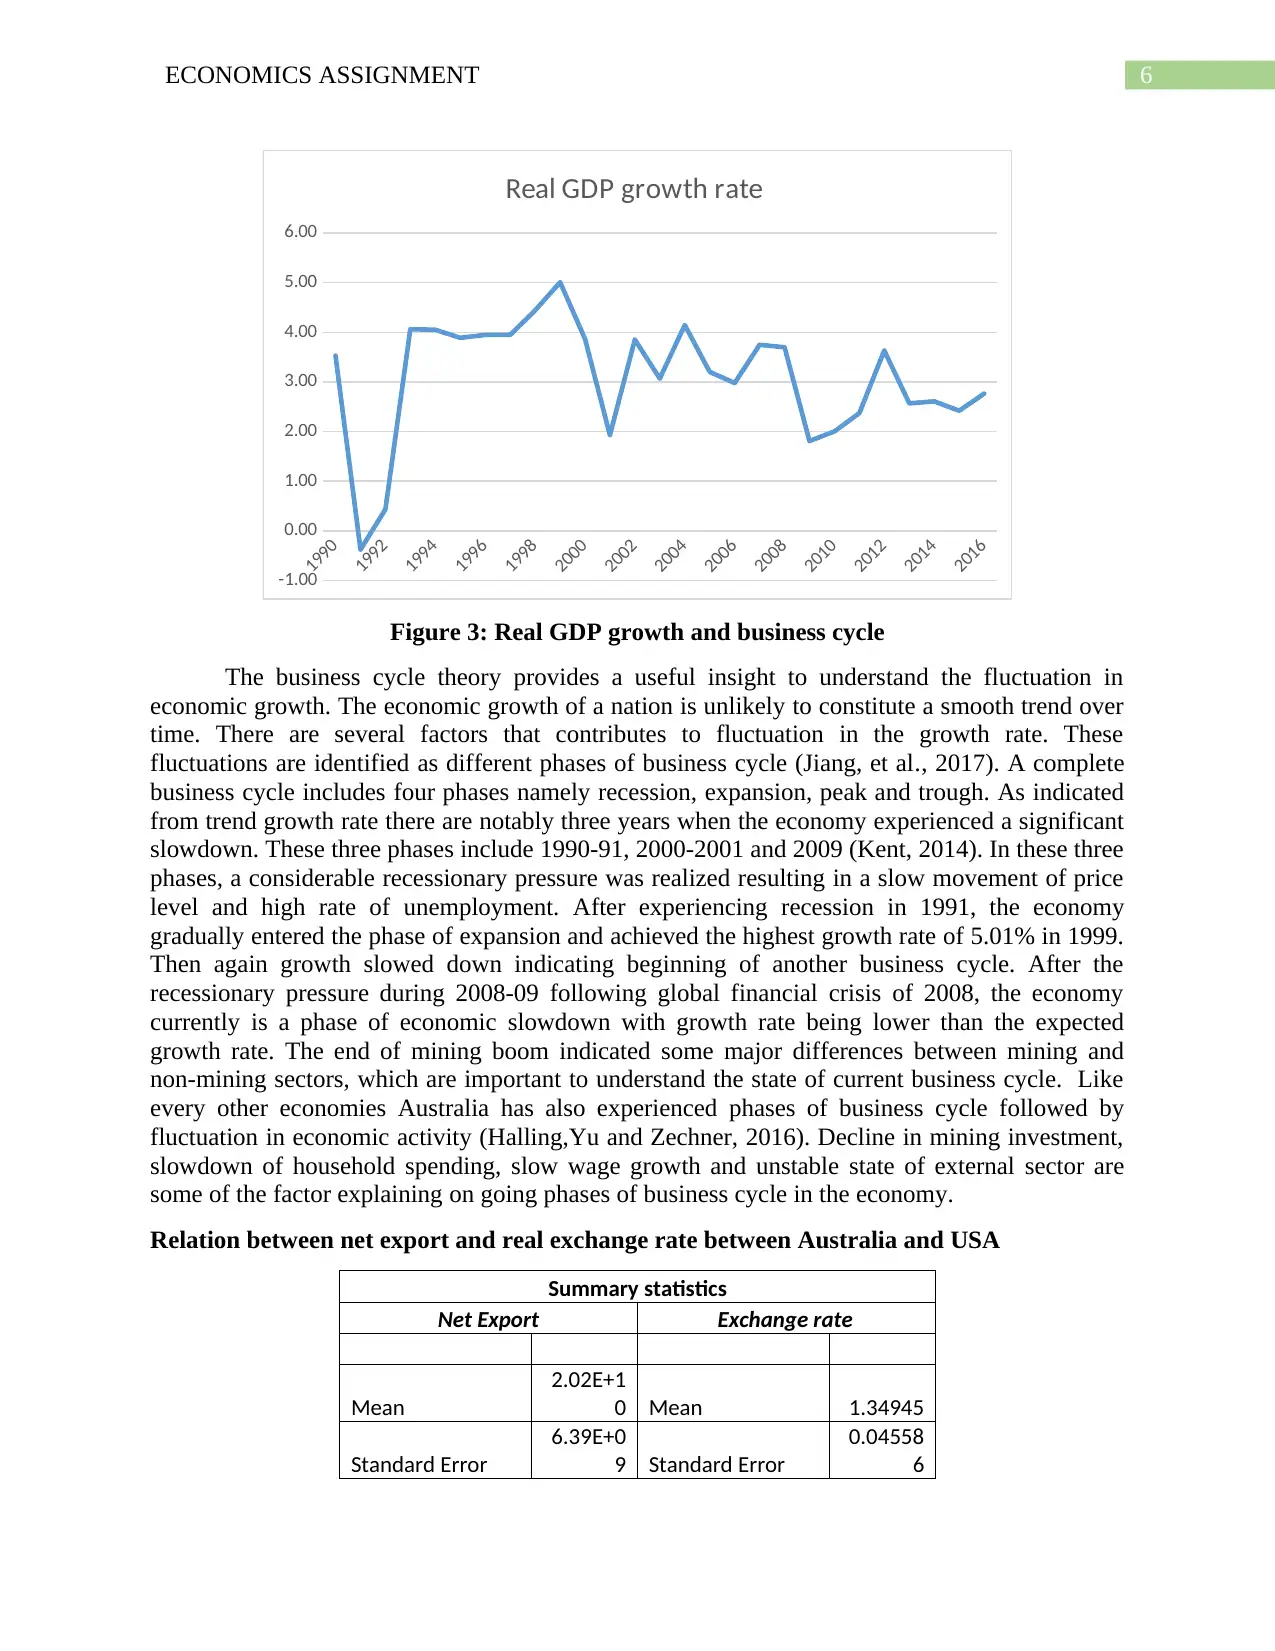
Figure 3: Real GDP growth and business cycle
The business cycle theory provides a useful insight to understand the fluctuation in
economic growth. The economic growth of a nation is unlikely to constitute a smooth trend over
time. There are several factors that contributes to fluctuation in the growth rate. These
fluctuations are identified as different phases of business cycle (Jiang, et al., 2017). A complete
business cycle includes four phases namely recession, expansion, peak and trough. As indicated
from trend growth rate there are notably three years when the economy experienced a significant
slowdown. These three phases include 1990-91, 2000-2001 and 2009 (Kent, 2014). In these three
phases, a considerable recessionary pressure was realized resulting in a slow movement of price
level and high rate of unemployment. After experiencing recession in 1991, the economy
gradually entered the phase of expansion and achieved the highest growth rate of 5.01% in 1999.
Then again growth slowed down indicating beginning of another business cycle. After the
recessionary pressure during 2008-09 following global financial crisis of 2008, the economy
currently is a phase of economic slowdown with growth rate being lower than the expected
growth rate. The end of mining boom indicated some major differences between mining and
non-mining sectors, which are important to understand the state of current business cycle. Like
every other economies Australia has also experienced phases of business cycle followed by
fluctuation in economic activity (Halling,Yu and Zechner, 2016). Decline in mining investment,
slowdown of household spending, slow wage growth and unstable state of external sector are
some of the factor explaining on going phases of business cycle in the economy.
Relation between net export and real exchange rate between Australia and USA
Summary statistics
Net Export Exchange rate
Mean
2.02E+1
0 Mean 1.34945
Standard Error
6.39E+0
9 Standard Error
0.04558
6
1990
1992
1994
1996
1998
2000
2002
2004
2006
2008
2010
2012
2014
2016
-1.00
0.00
1.00
2.00
3.00
4.00
5.00
6.00
Real GDP growth rate
Figure 3: Real GDP growth and business cycle
The business cycle theory provides a useful insight to understand the fluctuation in
economic growth. The economic growth of a nation is unlikely to constitute a smooth trend over
time. There are several factors that contributes to fluctuation in the growth rate. These
fluctuations are identified as different phases of business cycle (Jiang, et al., 2017). A complete
business cycle includes four phases namely recession, expansion, peak and trough. As indicated
from trend growth rate there are notably three years when the economy experienced a significant
slowdown. These three phases include 1990-91, 2000-2001 and 2009 (Kent, 2014). In these three
phases, a considerable recessionary pressure was realized resulting in a slow movement of price
level and high rate of unemployment. After experiencing recession in 1991, the economy
gradually entered the phase of expansion and achieved the highest growth rate of 5.01% in 1999.
Then again growth slowed down indicating beginning of another business cycle. After the
recessionary pressure during 2008-09 following global financial crisis of 2008, the economy
currently is a phase of economic slowdown with growth rate being lower than the expected
growth rate. The end of mining boom indicated some major differences between mining and
non-mining sectors, which are important to understand the state of current business cycle. Like
every other economies Australia has also experienced phases of business cycle followed by
fluctuation in economic activity (Halling,Yu and Zechner, 2016). Decline in mining investment,
slowdown of household spending, slow wage growth and unstable state of external sector are
some of the factor explaining on going phases of business cycle in the economy.
Relation between net export and real exchange rate between Australia and USA
Summary statistics
Net Export Exchange rate
Mean
2.02E+1
0 Mean 1.34945
Standard Error
6.39E+0
9 Standard Error
0.04558
6
Paraphrase This Document
Need a fresh take? Get an instant paraphrase of this document with our AI Paraphraser
7ECONOMICS ASSIGNMENT
Median
3.05E+1
0 Median 1.33109
Mode #N/A Mode #N/A
Standard
Deviation
3.32E+1
0
Standard
Deviation
0.23687
2
Sample Variance 1.1E+21 Sample Variance
0.05610
8
Kurtosis -0.71044 Kurtosis
0.65764
6
Skewness -0.5941 Skewness
0.68558
1
Range
1.18E+1
1 Range
0.96764
1
Minimum -5.1E+10 Minimum
0.96580
1
Maximum
6.67E+1
0 Maximum
1.93344
3
Sum
5.44E+1
1 Sum
36.4351
4
Count 27 Count 27
One of the important components of GDP is net export. The term net export indicates net
earnings from external sector and obtained as a different between export and import (Keynes
2016). International trade constitutes a steady proportion of Australian GDP. The share of trade
is Australia has increased steadily since 1980s reaching peak at 2008 when trade accounts for
about 23 percent of GDP. Estimates suggest that almost one third of Australian produced and
services are exchanged internationally. The main exported commodities of Australia include iron
ores and concentrates. Coal, education and travel service, natural gas, gold, crude petroleum,
aluminum, wheat, professional services and others. The op export destinations for Australia are
China, Japan, United States, South Korea, India, Singapore, New Zealand and others. The main
imports of Australia are cars, computers, refined petroleum and packaged medicament. The top
five export partners of Australia are China, Japan, United State, Singapore and Germany
(Parliament of Australia, 2018). In determining volume of export and import the relative price of
currency play an important role. Real exchange rate is a measure that present value of one
country’s currency in terms of another. A higher exchange rate implies a higher relative value of
currency. This is known as the deprecation of currency. A depreciated currency helps to improve
the trade balance by stimulating export volume because of a lower relative price of export in the
international market. The appreciation of currency on the other hand worsens the trade balance
by reducing volume of export. As most of the exported goods in the international market is
measured in terms of US dollar the exchange rate between Australia and USA are crucial in
determining the extent of net export (Zhang, Dufour and Galbraith, 2016). The movement of real
exchange rate and net export of Australia is shown in the figure given below.
8ECONOMICS ASSIGNMENT
1990
1992
1994
1996
1998
2000
2002
2004
2006
2008
2010
2012
2014
2016
-60000000000
-40000000000
-20000000000
0
20000000000
40000000000
60000000000
80000000000
0.00
0.50
1.00
1.50
2.00
2.50
Net export and Real exchange rate
Net Export Exchange rate
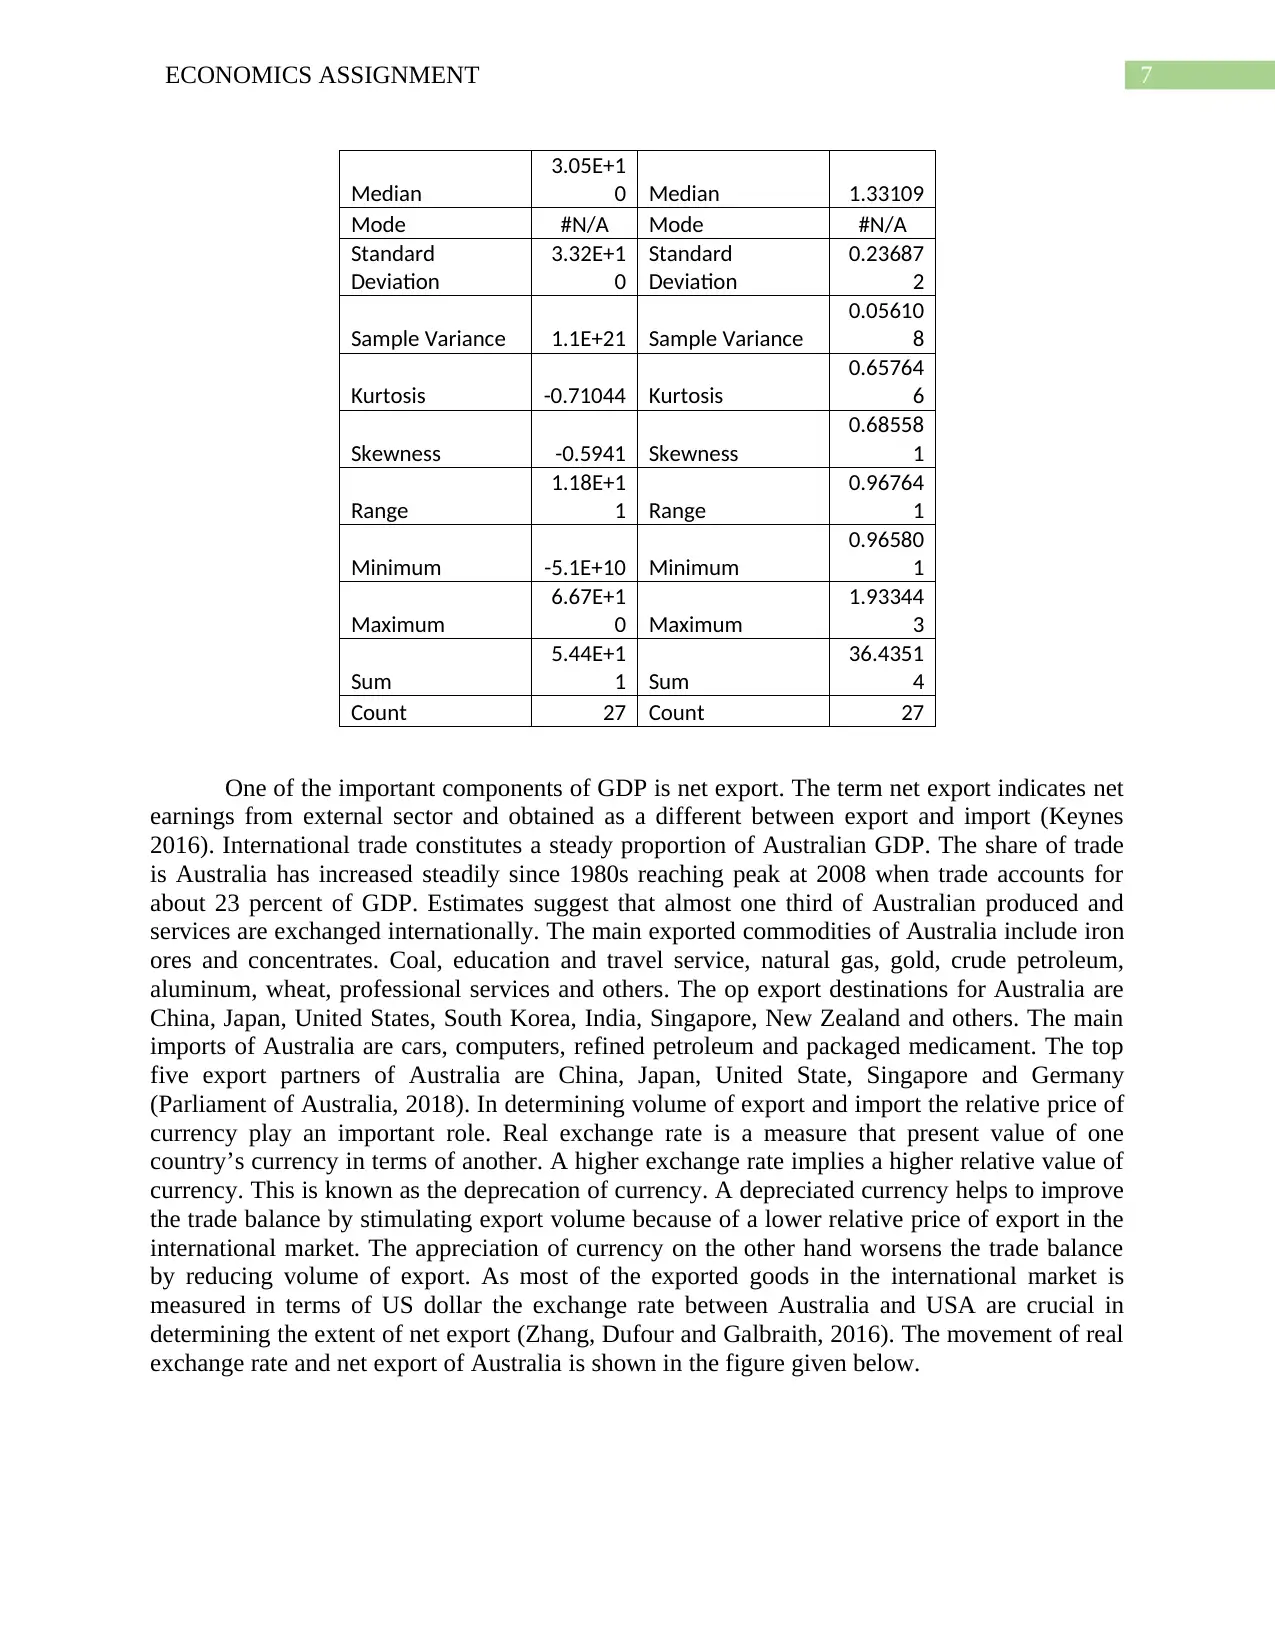
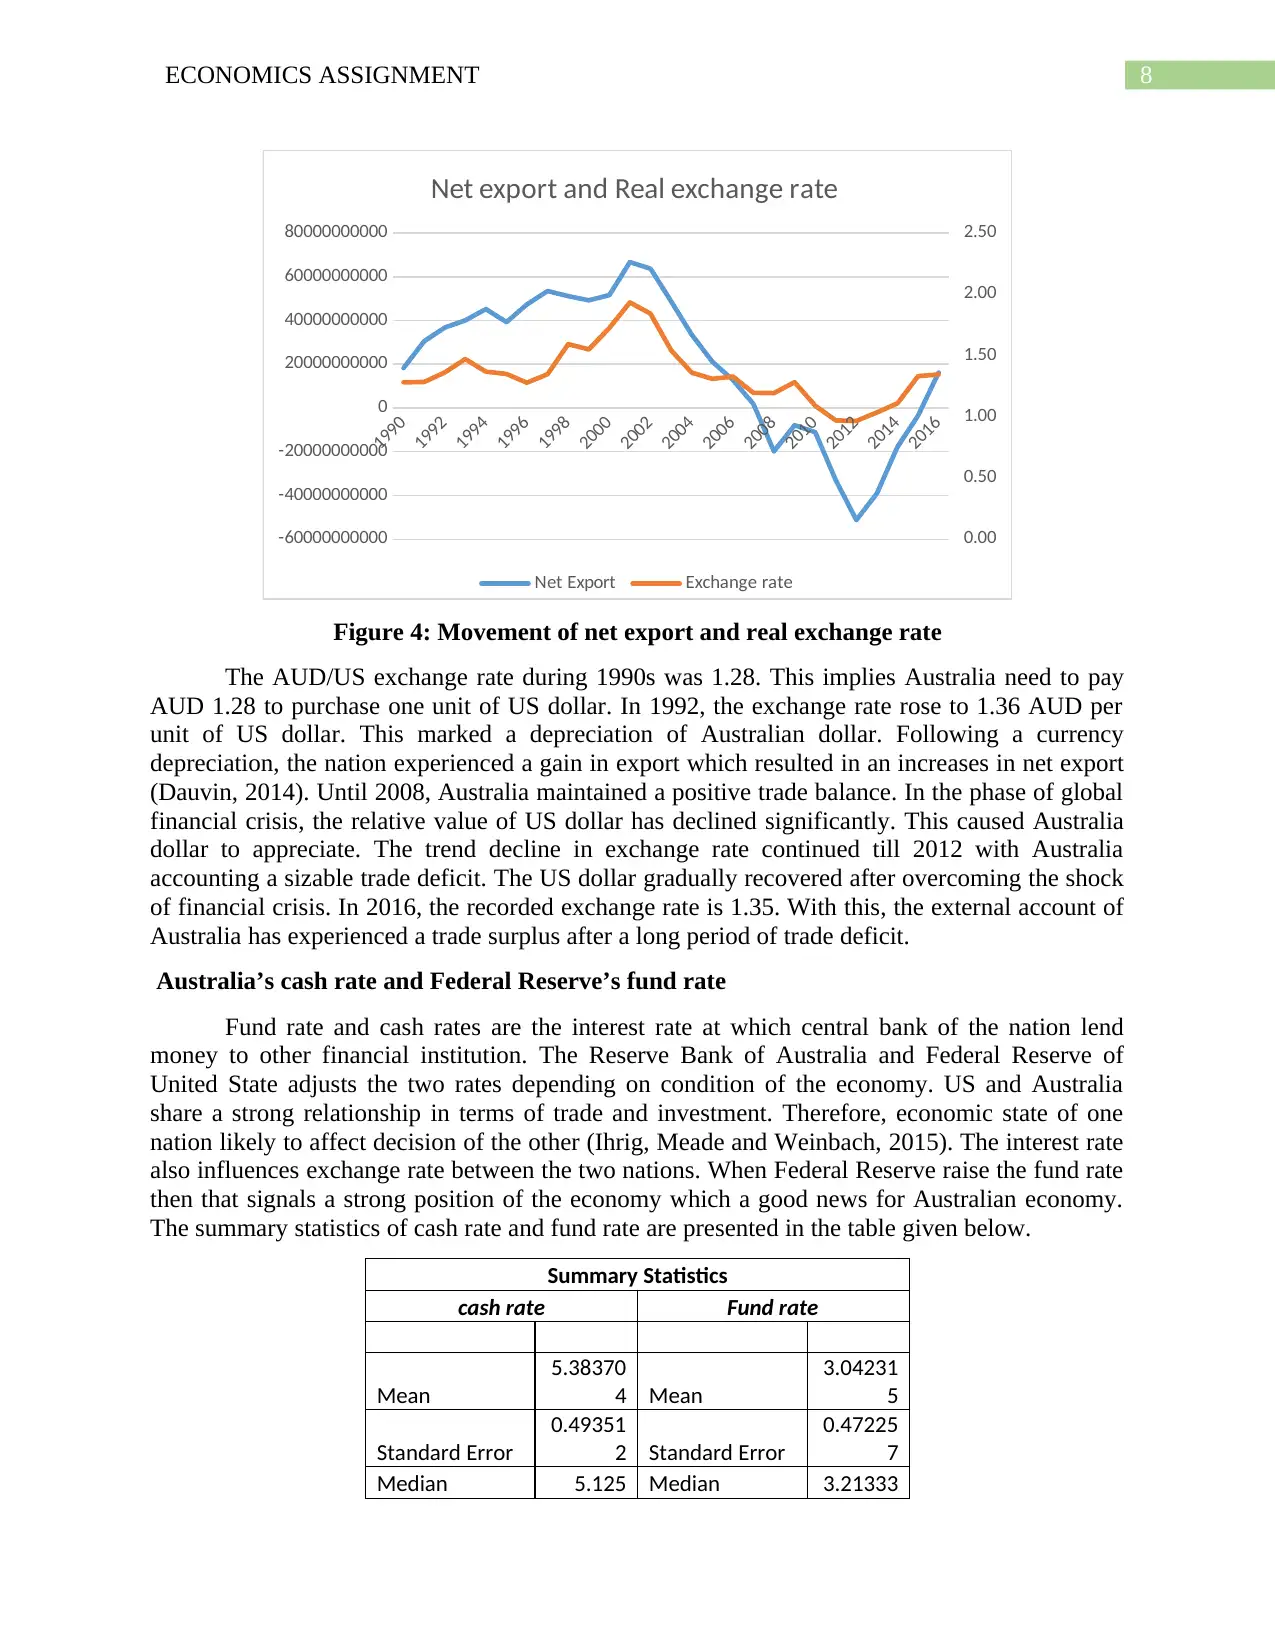
Figure 4: Movement of net export and real exchange rate
The AUD/US exchange rate during 1990s was 1.28. This implies Australia need to pay
AUD 1.28 to purchase one unit of US dollar. In 1992, the exchange rate rose to 1.36 AUD per
unit of US dollar. This marked a depreciation of Australian dollar. Following a currency
depreciation, the nation experienced a gain in export which resulted in an increases in net export
(Dauvin, 2014). Until 2008, Australia maintained a positive trade balance. In the phase of global
financial crisis, the relative value of US dollar has declined significantly. This caused Australia
dollar to appreciate. The trend decline in exchange rate continued till 2012 with Australia
accounting a sizable trade deficit. The US dollar gradually recovered after overcoming the shock
of financial crisis. In 2016, the recorded exchange rate is 1.35. With this, the external account of
Australia has experienced a trade surplus after a long period of trade deficit.
Australia’s cash rate and Federal Reserve’s fund rate
Fund rate and cash rates are the interest rate at which central bank of the nation lend
money to other financial institution. The Reserve Bank of Australia and Federal Reserve of
United State adjusts the two rates depending on condition of the economy. US and Australia
share a strong relationship in terms of trade and investment. Therefore, economic state of one
nation likely to affect decision of the other (Ihrig, Meade and Weinbach, 2015). The interest rate
also influences exchange rate between the two nations. When Federal Reserve raise the fund rate
then that signals a strong position of the economy which a good news for Australian economy.
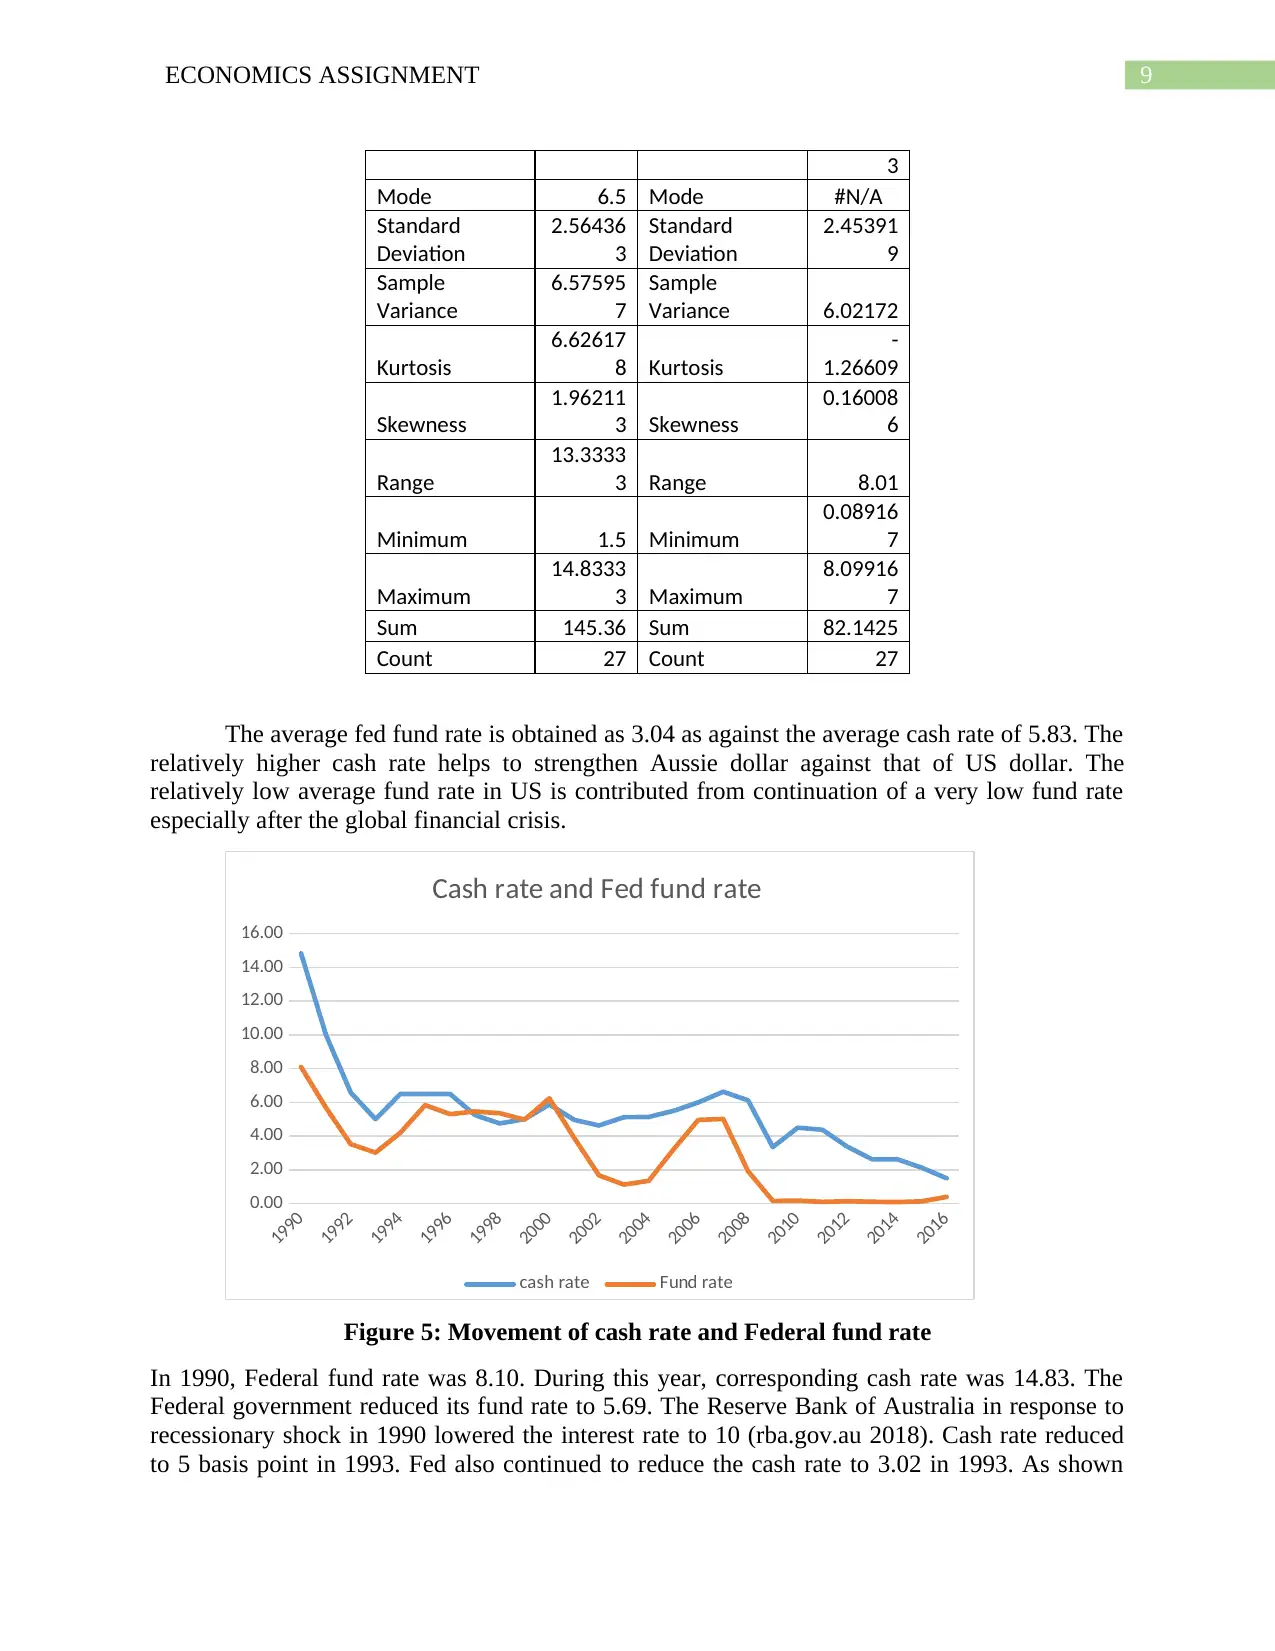
The summary statistics of cash rate and fund rate are presented in the table given below.
Summary Statistics
cash rate Fund rate
Mean
5.38370
4 Mean
3.04231
5
Standard Error
0.49351
2 Standard Error
0.47225
7
Median 5.125 Median 3.21333
1990
1992
1994
1996
1998
2000
2002
2004
2006
2008
2010
2012
2014
2016
-60000000000
-40000000000
-20000000000
0
20000000000
40000000000
60000000000
80000000000
0.00
0.50
1.00
1.50
2.00
2.50
Net export and Real exchange rate
Net Export Exchange rate
Figure 4: Movement of net export and real exchange rate
The AUD/US exchange rate during 1990s was 1.28. This implies Australia need to pay
AUD 1.28 to purchase one unit of US dollar. In 1992, the exchange rate rose to 1.36 AUD per
unit of US dollar. This marked a depreciation of Australian dollar. Following a currency
depreciation, the nation experienced a gain in export which resulted in an increases in net export
(Dauvin, 2014). Until 2008, Australia maintained a positive trade balance. In the phase of global
financial crisis, the relative value of US dollar has declined significantly. This caused Australia
dollar to appreciate. The trend decline in exchange rate continued till 2012 with Australia
accounting a sizable trade deficit. The US dollar gradually recovered after overcoming the shock
of financial crisis. In 2016, the recorded exchange rate is 1.35. With this, the external account of
Australia has experienced a trade surplus after a long period of trade deficit.
Australia’s cash rate and Federal Reserve’s fund rate
Fund rate and cash rates are the interest rate at which central bank of the nation lend
money to other financial institution. The Reserve Bank of Australia and Federal Reserve of
United State adjusts the two rates depending on condition of the economy. US and Australia
share a strong relationship in terms of trade and investment. Therefore, economic state of one
nation likely to affect decision of the other (Ihrig, Meade and Weinbach, 2015). The interest rate
also influences exchange rate between the two nations. When Federal Reserve raise the fund rate
then that signals a strong position of the economy which a good news for Australian economy.
The summary statistics of cash rate and fund rate are presented in the table given below.
Summary Statistics
cash rate Fund rate
Mean
5.38370
4 Mean
3.04231
5
Standard Error
0.49351
2 Standard Error
0.47225
7
Median 5.125 Median 3.21333
⊘ This is a preview!⊘
Do you want full access?
Subscribe today to unlock all pages.
Trusted by 1+ million students worldwide
9ECONOMICS ASSIGNMENT
3
Mode 6.5 Mode #N/A
Standard
Deviation
2.56436
3
Standard
Deviation
2.45391
9
Sample
Variance
6.57595
7
Sample
Variance 6.02172
Kurtosis
6.62617
8 Kurtosis
-
1.26609
Skewness
1.96211
3 Skewness
0.16008
6
Range
13.3333
3 Range 8.01
Minimum 1.5 Minimum
0.08916
7
Maximum
14.8333
3 Maximum
8.09916
7
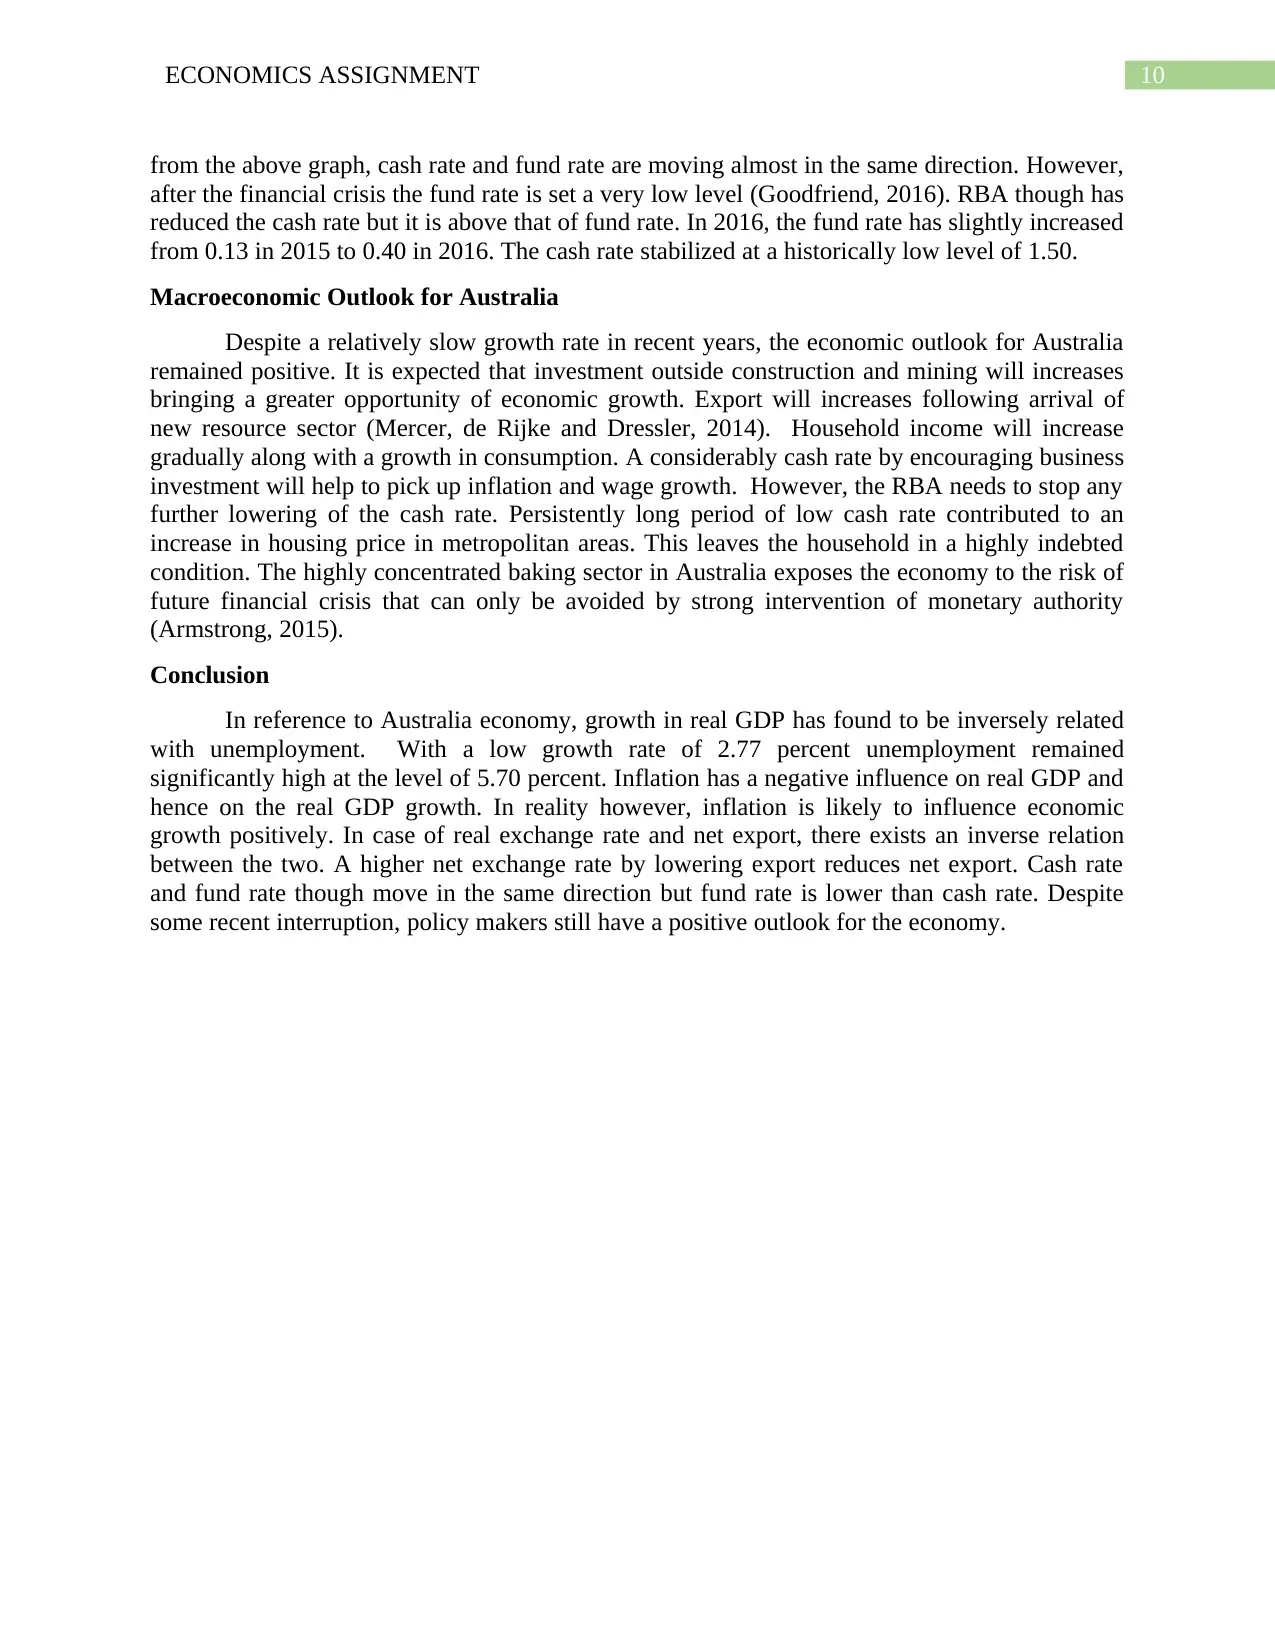
Sum 145.36 Sum 82.1425
Count 27 Count 27
The average fed fund rate is obtained as 3.04 as against the average cash rate of 5.83. The
relatively higher cash rate helps to strengthen Aussie dollar against that of US dollar. The
relatively low average fund rate in US is contributed from continuation of a very low fund rate
especially after the global financial crisis.
1990
1992
1994
1996
1998
2000
2002
2004
2006
2008
2010
2012
2014
2016
0.00
2.00
4.00
6.00
8.00
10.00
12.00
14.00
16.00
Cash rate and Fed fund rate
cash rate Fund rate
Figure 5: Movement of cash rate and Federal fund rate
In 1990, Federal fund rate was 8.10. During this year, corresponding cash rate was 14.83. The
Federal government reduced its fund rate to 5.69. The Reserve Bank of Australia in response to
recessionary shock in 1990 lowered the interest rate to 10 (rba.gov.au 2018). Cash rate reduced
to 5 basis point in 1993. Fed also continued to reduce the cash rate to 3.02 in 1993. As shown
3
Mode 6.5 Mode #N/A
Standard
Deviation
2.56436
3
Standard
Deviation
2.45391
9
Sample
Variance
6.57595
7
Sample
Variance 6.02172
Kurtosis
6.62617
8 Kurtosis
-
1.26609
Skewness
1.96211
3 Skewness
0.16008
6
Range
13.3333
3 Range 8.01
Minimum 1.5 Minimum
0.08916
7
Maximum
14.8333
3 Maximum
8.09916
7
Sum 145.36 Sum 82.1425
Count 27 Count 27
The average fed fund rate is obtained as 3.04 as against the average cash rate of 5.83. The
relatively higher cash rate helps to strengthen Aussie dollar against that of US dollar. The
relatively low average fund rate in US is contributed from continuation of a very low fund rate
especially after the global financial crisis.
1990
1992
1994
1996
1998
2000
2002
2004
2006
2008
2010
2012
2014
2016
0.00
2.00
4.00
6.00
8.00
10.00
12.00
14.00
16.00
Cash rate and Fed fund rate
cash rate Fund rate
Figure 5: Movement of cash rate and Federal fund rate
In 1990, Federal fund rate was 8.10. During this year, corresponding cash rate was 14.83. The
Federal government reduced its fund rate to 5.69. The Reserve Bank of Australia in response to
recessionary shock in 1990 lowered the interest rate to 10 (rba.gov.au 2018). Cash rate reduced
to 5 basis point in 1993. Fed also continued to reduce the cash rate to 3.02 in 1993. As shown
Paraphrase This Document
Need a fresh take? Get an instant paraphrase of this document with our AI Paraphraser
10ECONOMICS ASSIGNMENT
from the above graph, cash rate and fund rate are moving almost in the same direction. However,
after the financial crisis the fund rate is set a very low level (Goodfriend, 2016). RBA though has
reduced the cash rate but it is above that of fund rate. In 2016, the fund rate has slightly increased
from 0.13 in 2015 to 0.40 in 2016. The cash rate stabilized at a historically low level of 1.50.
Macroeconomic Outlook for Australia
Despite a relatively slow growth rate in recent years, the economic outlook for Australia
remained positive. It is expected that investment outside construction and mining will increases
bringing a greater opportunity of economic growth. Export will increases following arrival of
new resource sector (Mercer, de Rijke and Dressler, 2014). Household income will increase
gradually along with a growth in consumption. A considerably cash rate by encouraging business
investment will help to pick up inflation and wage growth. However, the RBA needs to stop any
further lowering of the cash rate. Persistently long period of low cash rate contributed to an
increase in housing price in metropolitan areas. This leaves the household in a highly indebted
condition. The highly concentrated baking sector in Australia exposes the economy to the risk of
future financial crisis that can only be avoided by strong intervention of monetary authority
(Armstrong, 2015).
Conclusion
In reference to Australia economy, growth in real GDP has found to be inversely related
with unemployment. With a low growth rate of 2.77 percent unemployment remained
significantly high at the level of 5.70 percent. Inflation has a negative influence on real GDP and
hence on the real GDP growth. In reality however, inflation is likely to influence economic
growth positively. In case of real exchange rate and net export, there exists an inverse relation
between the two. A higher net exchange rate by lowering export reduces net export. Cash rate
and fund rate though move in the same direction but fund rate is lower than cash rate. Despite
some recent interruption, policy makers still have a positive outlook for the economy.
11ECONOMICS ASSIGNMENT
Reference list
Abs.gov.au. (2018). 6401.0 - Consumer Price Index, Australia, Mar 2018. [online] Available at:
http://www.abs.gov.au/AUSSTATS/abs@.nsf/DetailsPage/6401.0Mar%202018?OpenDocument
[Accessed 19 May 2018].
Andersen, T.B., Malchow-Møller, N. and Nordvig, J., 2015. Inflation targeting and
macroeconomic performance since the Great Recession. Oxford Economic Papers, 67(3),
pp.598-613.
Aph.gov.au. (2018). Australia’s trade in figures – Parliament of Australia. [online] Available at:
https://www.aph.gov.au/About_Parliament/Parliamentary_Departments/Parliamentary_Library/
pubs/BriefingBook45p/AustraliaTrade [Accessed 19 May 2018].
Armstrong, S., 2015. The economic impact of the Australia–US free trade agreement. Australian
Journal of International Affairs, 69(5), pp.513-537.
Data.worldbank.org. (2018). Official exchange rate (LCU per US$, period average) | Data.
[online] Available at: https://data.worldbank.org/indicator/PA.NUS.FCRF?locations=AU
[Accessed 19 May 2018].
Dauvin, M., 2014. Energy prices and the real exchange rate of commodity-exporting
countries. International Economics, 137, pp.52-72.
Goodfriend, M., 2016, August. The case for unencumbering interest rate policy at the zero
bound. In Federal Reserve Bank of Kansas City’s 40th Economic Policy Symposium. Jackson
Hole, WY. August (Vol. 26).
Halling, M., Yu, J. and Zechner, J., 2016. Leverage dynamics over the business cycle. Journal of
Financial Economics, 122(1), pp.21-41.
Ihrig, J.E., Meade, E.E. and Weinbach, G.C., 2015. Rewriting Monetary Policy 101: What's the
Fed's Preferred Post-Crisis Approach to Raising Interest Rates?. Journal of Economic
Perspectives, 29(4), pp.177-98.
Jiang, B., Athanasopoulos, G., Hyndman, R.J., Panagiotelis, A. and Vahid, F., 2017.
Macroeconomic forecasting for Australia using a large number of predictors. Monash
Econometrics and Business Statistics Working Papers, 2, p.17.
Kent, C. (2018). The Business Cycle in Australia | Speeches | RBA. [online] Reserve Bank of
Australia. Available at: https://www.rba.gov.au/speeches/2014/sp-ag-131114.html [Accessed 19
May 2018].
Kent, C., 2014. The Business Cycle in Australia. Address to the Australian Business Economists,
Sydney, 13.
Keynes, J.M., 2016. General theory of employment, interest and money. Atlantic Publishers &
Dist.
Mankiw, N.G., 2014. Principles of macroeconomics. Cengage Learning.
⊘ This is a preview!⊘
Do you want full access?
Subscribe today to unlock all pages.
Trusted by 1+ million students worldwide
1 out of 13
Related Documents


Your All-in-One AI-Powered Toolkit for Academic Success.
+13062052269
info@desklib.com
Available 24*7 on WhatsApp / Email
![[object Object]](/_next/static/media/star-bottom.7253800d.svg)
Unlock your academic potential
Copyright © 2020–2026 A2Z Services. All Rights Reserved. Developed and managed by ZUCOL.