BUS700 Economics 1: Analyzing Macroeconomic Factors in Australia
VerifiedAdded on 2024/05/29
|13
|2587
|490
Report
AI Summary
This report examines the influence of various macroeconomic factors on the Australian economy between 1990 and 2016. Key indicators such as GDP growth rate, real exchange rates, unemployment rate, net exports, cash rates, and inflation rate are analyzed to determine their relationships and impact. The report compares Australian macroeconomic factors with those of the US, explores the link between GDP growth and inflation, GDP growth and unemployment, and the relationship between net exports and real exchange rates. It also discusses the correlation between Australia's cash rates and Federal Reserve Fund rates. Based on these analyses, the report provides a prediction of the overall macroeconomic outlook for Australia, concluding with recommendations for future economic strategies. The findings suggest a growing economy driven by investments, increased private consumption, and a strong labor market.
Trimester 1, 2018: BUS700
Economics
1
Economics
1
Paraphrase This Document
Need a fresh take? Get an instant paraphrase of this document with our AI Paraphraser
Executive Summary
This report relates to the research with regards to the impact of various macroeconomic
factors on the economy if Australia. For the purpose of research the data collected will relate
to the period from 1990 to 2016. The macroeconomic factors discussed in this report include
GDP growth rate of Australia, real exchange rates, unemployment rate, net exports, cash
rates,, inflation rate, etc. the relationships between various macroeconomic factors his
discussed along with the comparison of the Australian macroeconomic factors with the US
economic factors. From the discussion of the impact of these factors on the economy, the
prediction of the overall outlook of the economy of the country is also included.
2
Contents
Executive Summary...............................................................................................................................2
Evaluation of Macroeconomic performance of Australia and USA........................................................3
Macroeconomic indicators and data.................................................................................................3
Relationship between economic factors...........................................................................................5
GDP growth rate and inflation rate................................................................................................5
GDP growth rate and unemployment rate....................................................................................5
Relationship between net exports and real exchange rates of US and Australia...............................7
Net exports....................................................................................................................................7
Real Exchange rates.......................................................................................................................8
Relationship between Australia’s cash rates and Federal Reserve Fund rates..................................9
Prediction of macroeconomic outlook of Australia.........................................................................10
Conclusion and recommendations......................................................................................................11
3
⊘ This is a preview!⊘
Do you want full access?
Subscribe today to unlock all pages.
Trusted by 1+ million students worldwide
Evaluation of Macroeconomic performance of Australia and USA
Macroeconomic indicators and data
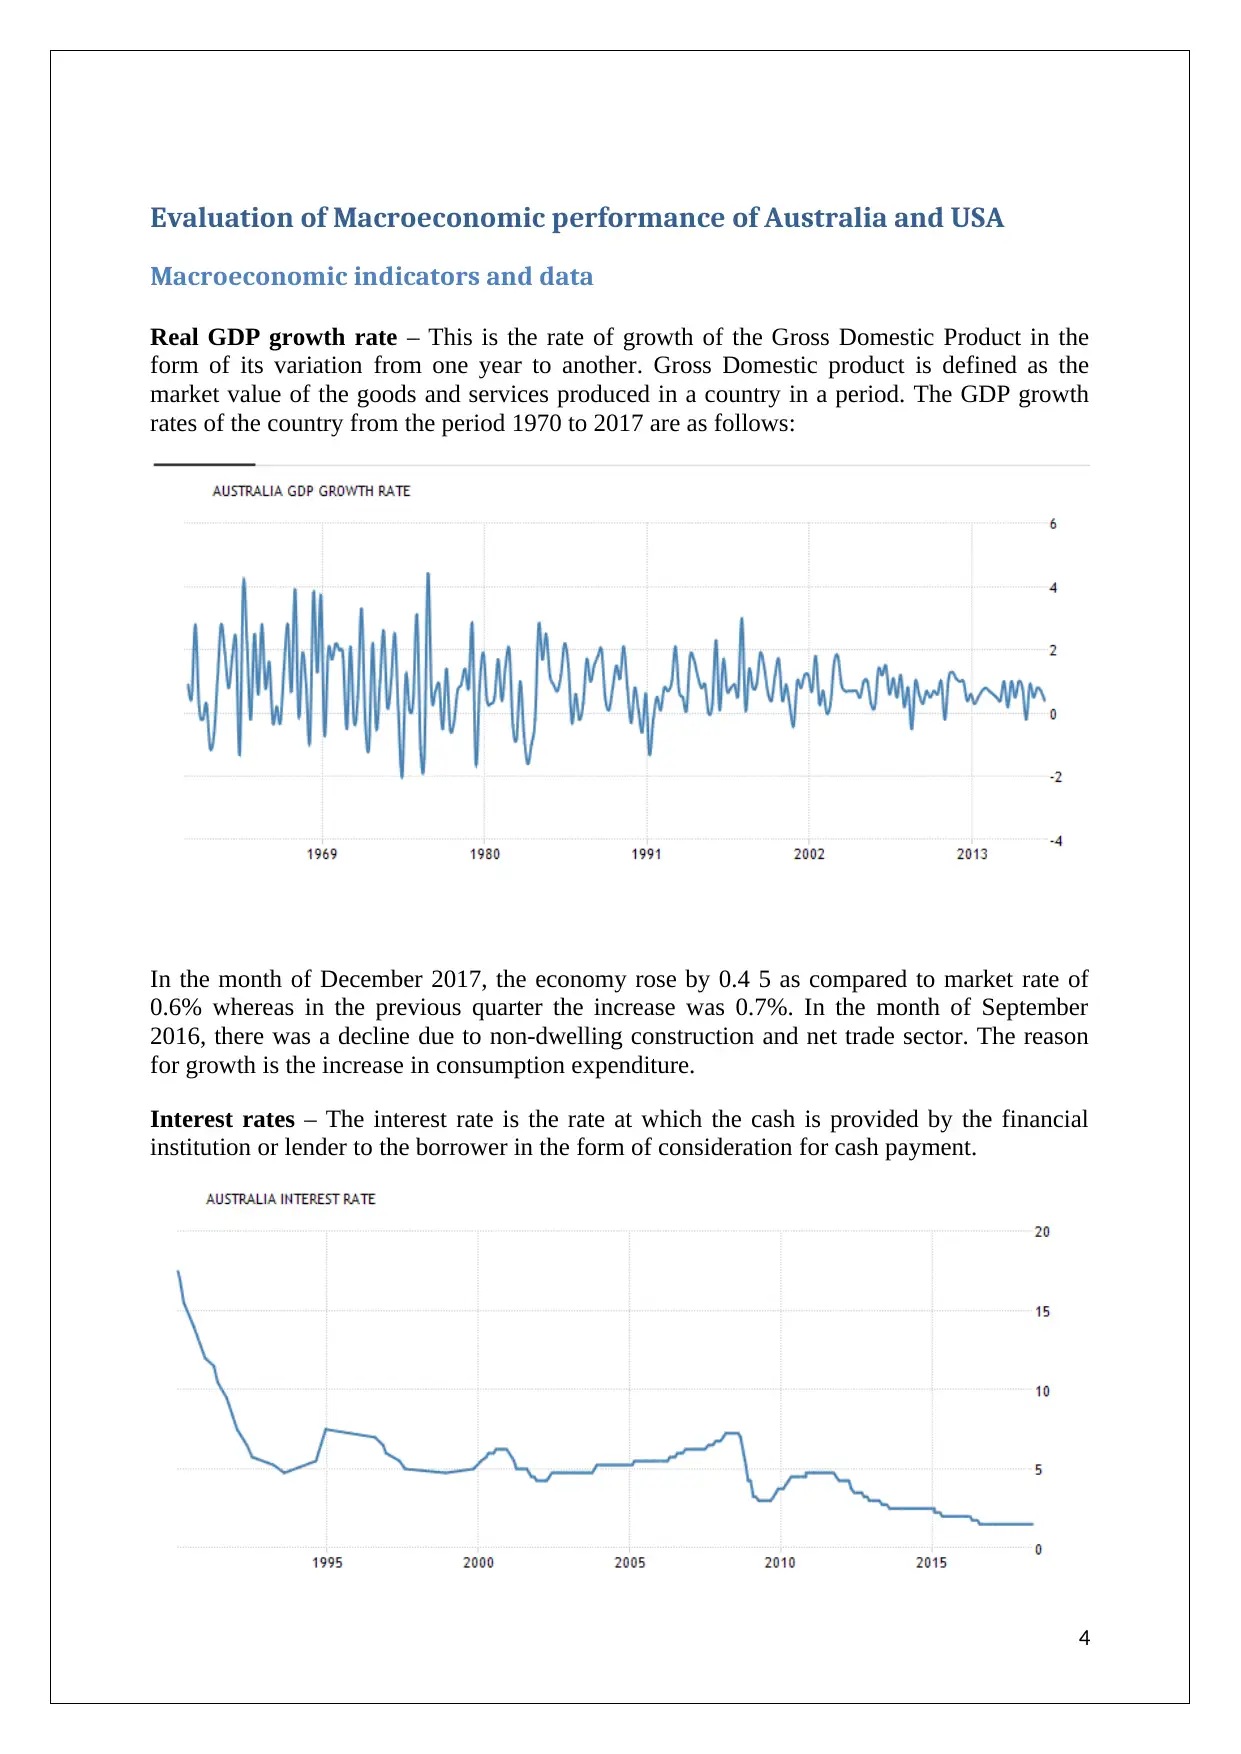
Real GDP growth rate – This is the rate of growth of the Gross Domestic Product in the
form of its variation from one year to another. Gross Domestic product is defined as the
market value of the goods and services produced in a country in a period. The GDP growth
rates of the country from the period 1970 to 2017 are as follows:
In the month of December 2017, the economy rose by 0.4 5 as compared to market rate of
0.6% whereas in the previous quarter the increase was 0.7%. In the month of September
2016, there was a decline due to non-dwelling construction and net trade sector. The reason
for growth is the increase in consumption expenditure.
Interest rates – The interest rate is the rate at which the cash is provided by the financial
institution or lender to the borrower in the form of consideration for cash payment.
4
Macroeconomic indicators and data
Real GDP growth rate – This is the rate of growth of the Gross Domestic Product in the
form of its variation from one year to another. Gross Domestic product is defined as the
market value of the goods and services produced in a country in a period. The GDP growth
rates of the country from the period 1970 to 2017 are as follows:
In the month of December 2017, the economy rose by 0.4 5 as compared to market rate of
0.6% whereas in the previous quarter the increase was 0.7%. In the month of September
2016, there was a decline due to non-dwelling construction and net trade sector. The reason
for growth is the increase in consumption expenditure.
Interest rates – The interest rate is the rate at which the cash is provided by the financial
institution or lender to the borrower in the form of consideration for cash payment.
4
Paraphrase This Document
Need a fresh take? Get an instant paraphrase of this document with our AI Paraphraser
The cash rate has been kept by the Reserve Bank of Australia at 1.5% on constant basis
during the past few years. However, the rates are expected to rises to 3% in the year 2018 and
2019. The highest interest rates observed during the period of consideration is 8%-9%.
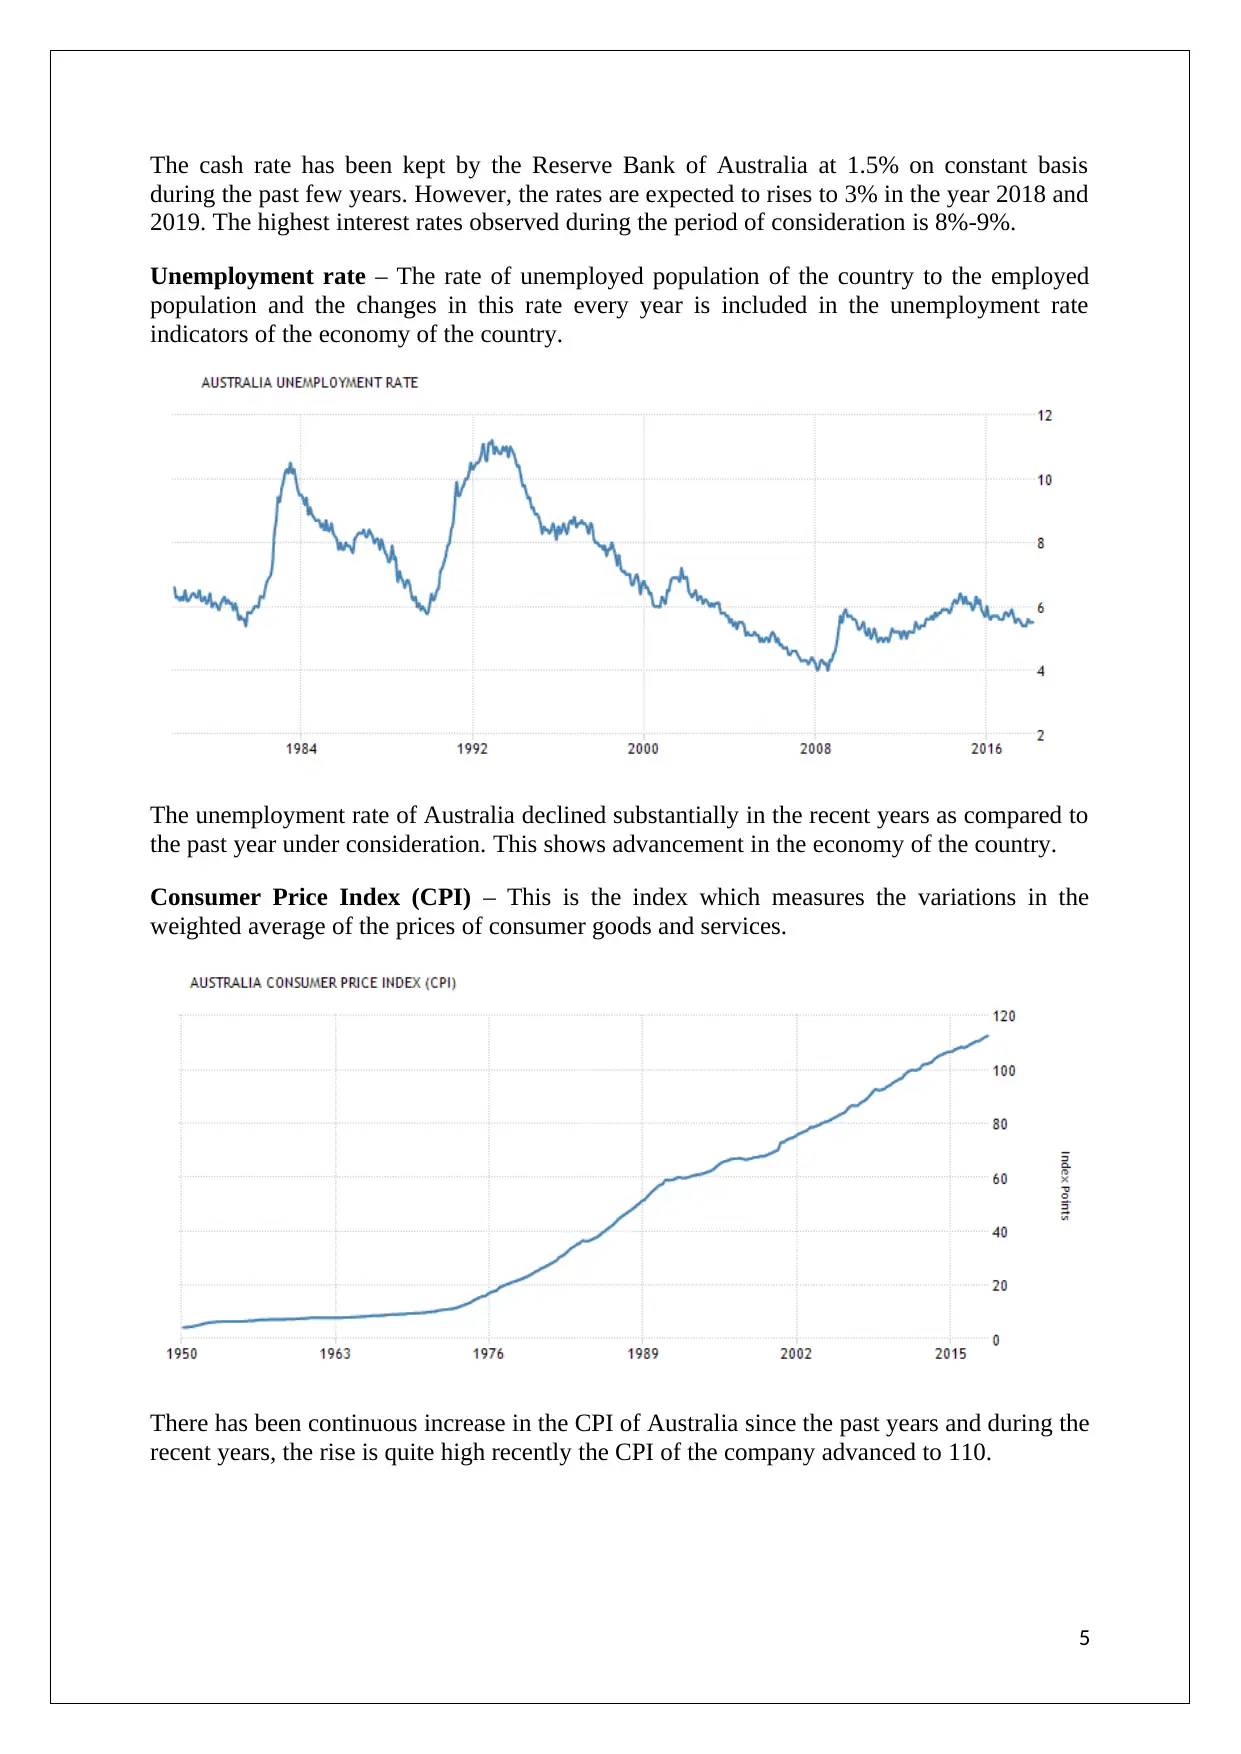
Unemployment rate – The rate of unemployed population of the country to the employed
population and the changes in this rate every year is included in the unemployment rate
indicators of the economy of the country.
The unemployment rate of Australia declined substantially in the recent years as compared to
the past year under consideration. This shows advancement in the economy of the country.
Consumer Price Index (CPI) – This is the index which measures the variations in the
weighted average of the prices of consumer goods and services.
There has been continuous increase in the CPI of Australia since the past years and during the
recent years, the rise is quite high recently the CPI of the company advanced to 110.
5
during the past few years. However, the rates are expected to rises to 3% in the year 2018 and
2019. The highest interest rates observed during the period of consideration is 8%-9%.
Unemployment rate – The rate of unemployed population of the country to the employed
population and the changes in this rate every year is included in the unemployment rate
indicators of the economy of the country.
The unemployment rate of Australia declined substantially in the recent years as compared to
the past year under consideration. This shows advancement in the economy of the country.
Consumer Price Index (CPI) – This is the index which measures the variations in the
weighted average of the prices of consumer goods and services.
There has been continuous increase in the CPI of Australia since the past years and during the
recent years, the rise is quite high recently the CPI of the company advanced to 110.
5
Relationship between economic factors
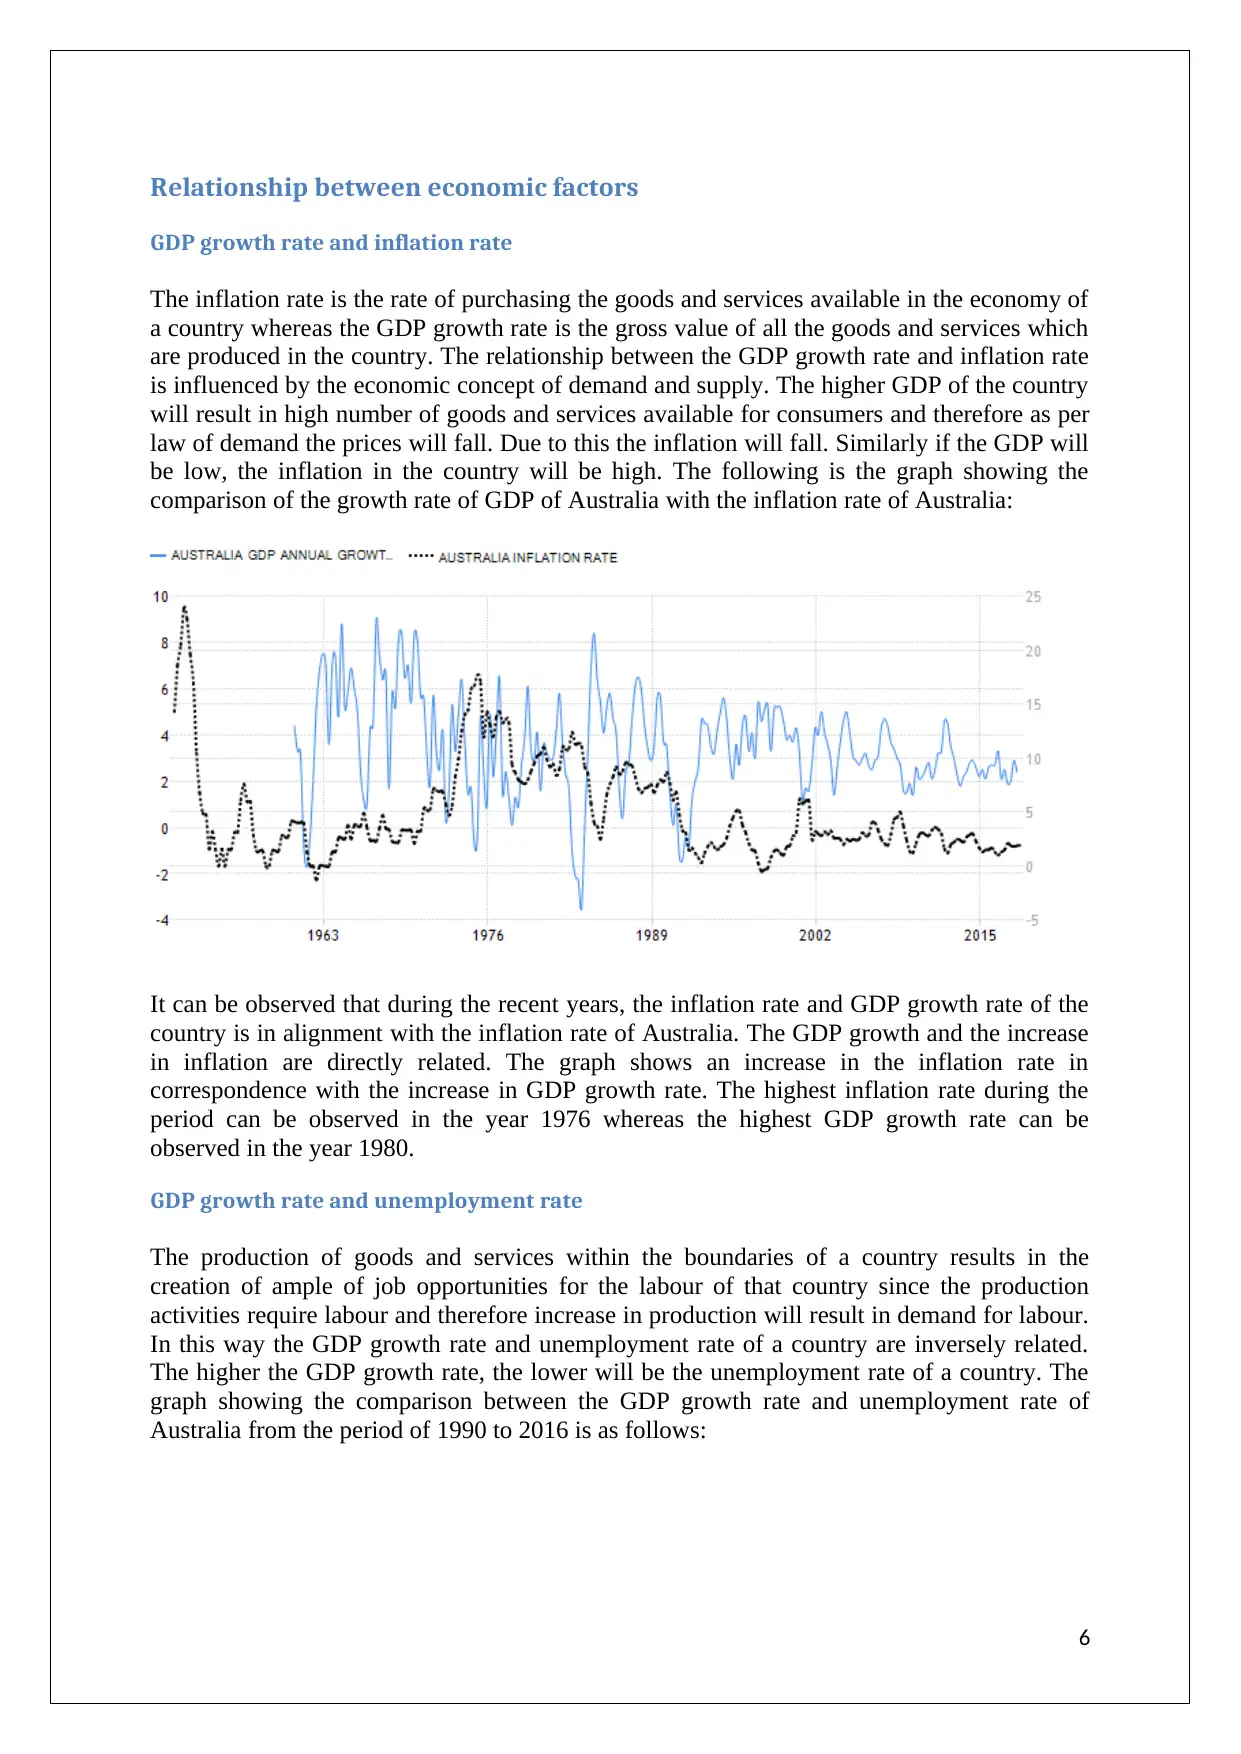
GDP growth rate and inflation rate
The inflation rate is the rate of purchasing the goods and services available in the economy of
a country whereas the GDP growth rate is the gross value of all the goods and services which
are produced in the country. The relationship between the GDP growth rate and inflation rate
is influenced by the economic concept of demand and supply. The higher GDP of the country
will result in high number of goods and services available for consumers and therefore as per
law of demand the prices will fall. Due to this the inflation will fall. Similarly if the GDP will
be low, the inflation in the country will be high. The following is the graph showing the
comparison of the growth rate of GDP of Australia with the inflation rate of Australia:
It can be observed that during the recent years, the inflation rate and GDP growth rate of the
country is in alignment with the inflation rate of Australia. The GDP growth and the increase
in inflation are directly related. The graph shows an increase in the inflation rate in
correspondence with the increase in GDP growth rate. The highest inflation rate during the
period can be observed in the year 1976 whereas the highest GDP growth rate can be
observed in the year 1980.
GDP growth rate and unemployment rate
The production of goods and services within the boundaries of a country results in the
creation of ample of job opportunities for the labour of that country since the production
activities require labour and therefore increase in production will result in demand for labour.
In this way the GDP growth rate and unemployment rate of a country are inversely related.
The higher the GDP growth rate, the lower will be the unemployment rate of a country. The
graph showing the comparison between the GDP growth rate and unemployment rate of
Australia from the period of 1990 to 2016 is as follows:
6
⊘ This is a preview!⊘
Do you want full access?
Subscribe today to unlock all pages.
Trusted by 1+ million students worldwide
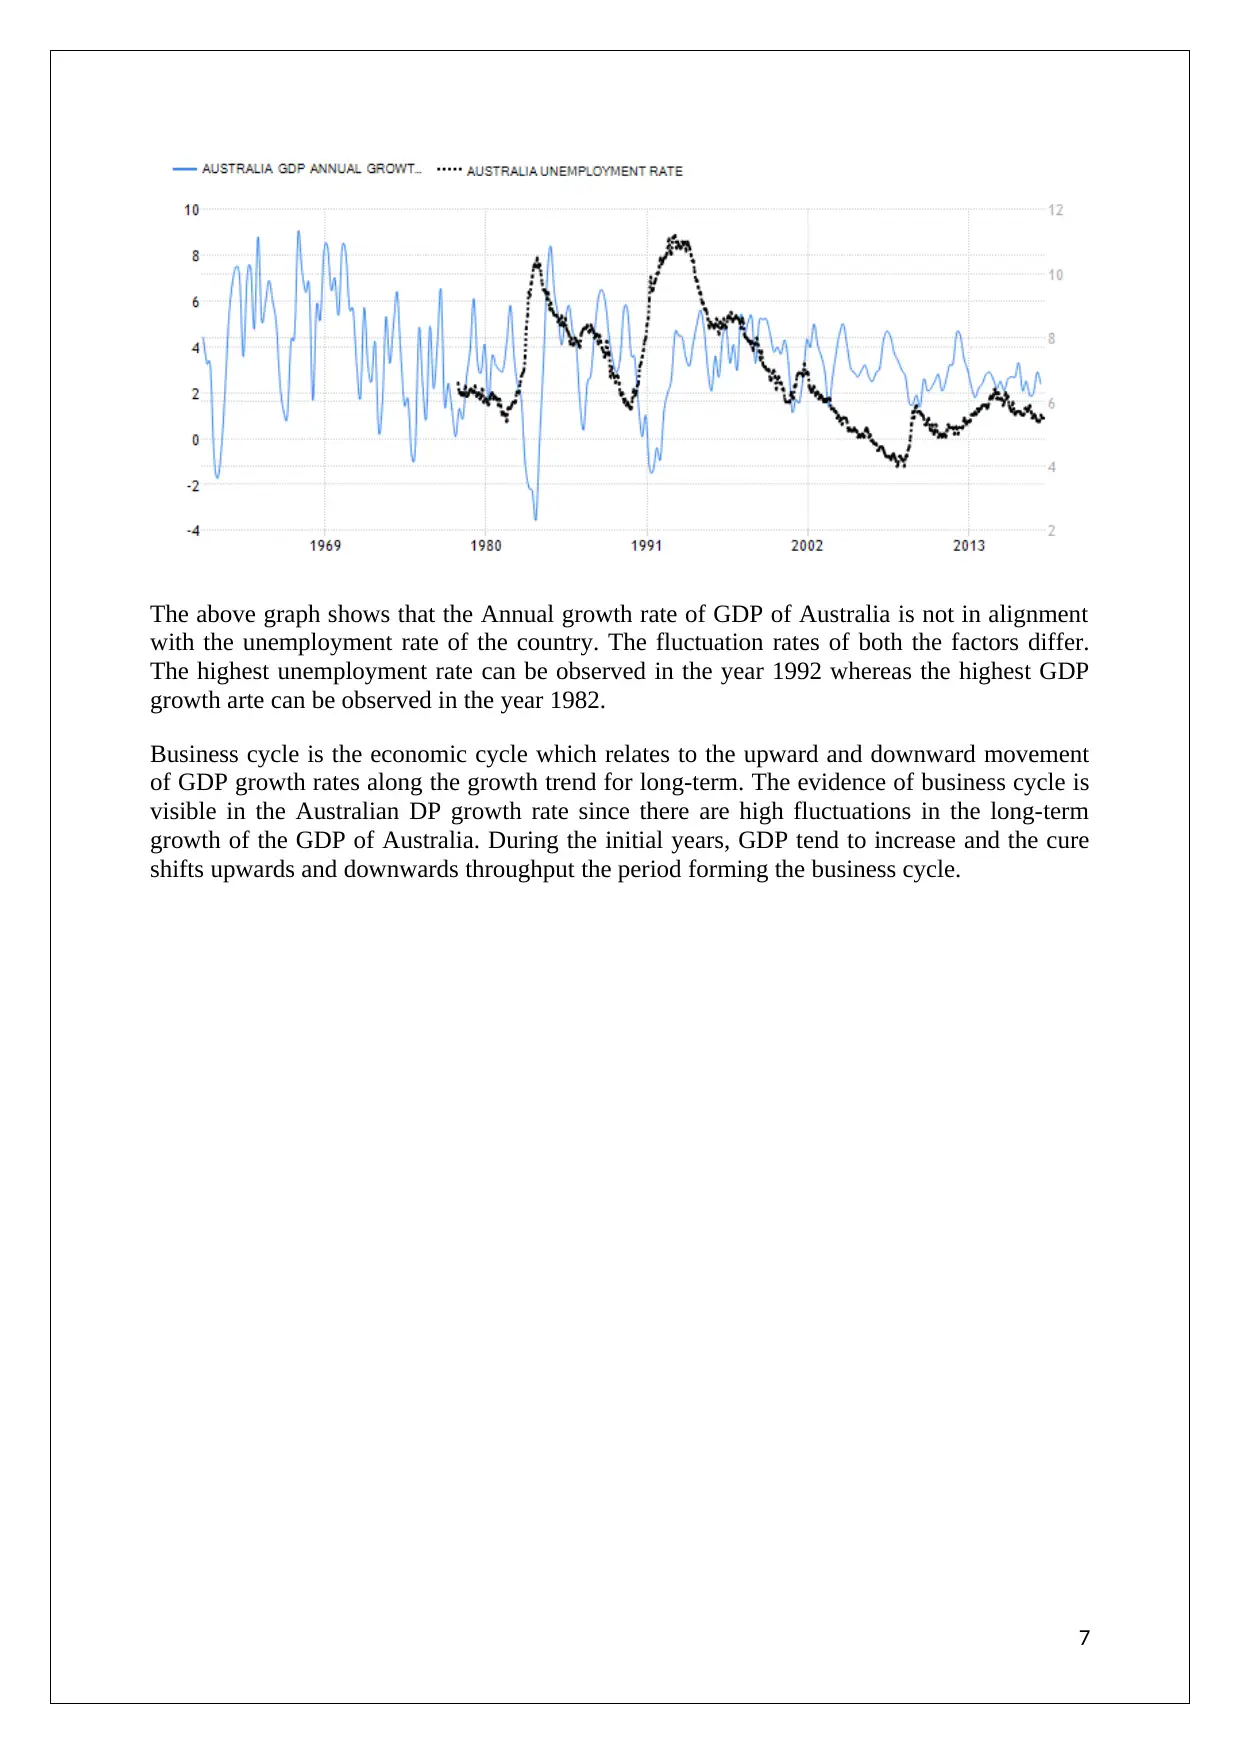
The above graph shows that the Annual growth rate of GDP of Australia is not in alignment
with the unemployment rate of the country. The fluctuation rates of both the factors differ.
The highest unemployment rate can be observed in the year 1992 whereas the highest GDP
growth arte can be observed in the year 1982.
Business cycle is the economic cycle which relates to the upward and downward movement
of GDP growth rates along the growth trend for long-term. The evidence of business cycle is
visible in the Australian DP growth rate since there are high fluctuations in the long-term
growth of the GDP of Australia. During the initial years, GDP tend to increase and the cure
shifts upwards and downwards throughput the period forming the business cycle.
7
Paraphrase This Document
Need a fresh take? Get an instant paraphrase of this document with our AI Paraphraser
Relationship between net exports and real exchange rates of US and
Australia
According to Abbas, et.al, (2012), a country does not have sufficient resources to fulfil all its
needs and due to this, they enter into international business. As per the product life cycle
theory, the business which has higher market information about the domestic market,
introduce their goods and services in domestic market and export the products from there to
the international market. The export into the other country or the import of goods from the
other country cannot be done without the exchange of currencies among the countries and
therefore imports and exports as well as foreign exchange rates are directly related to each
other.
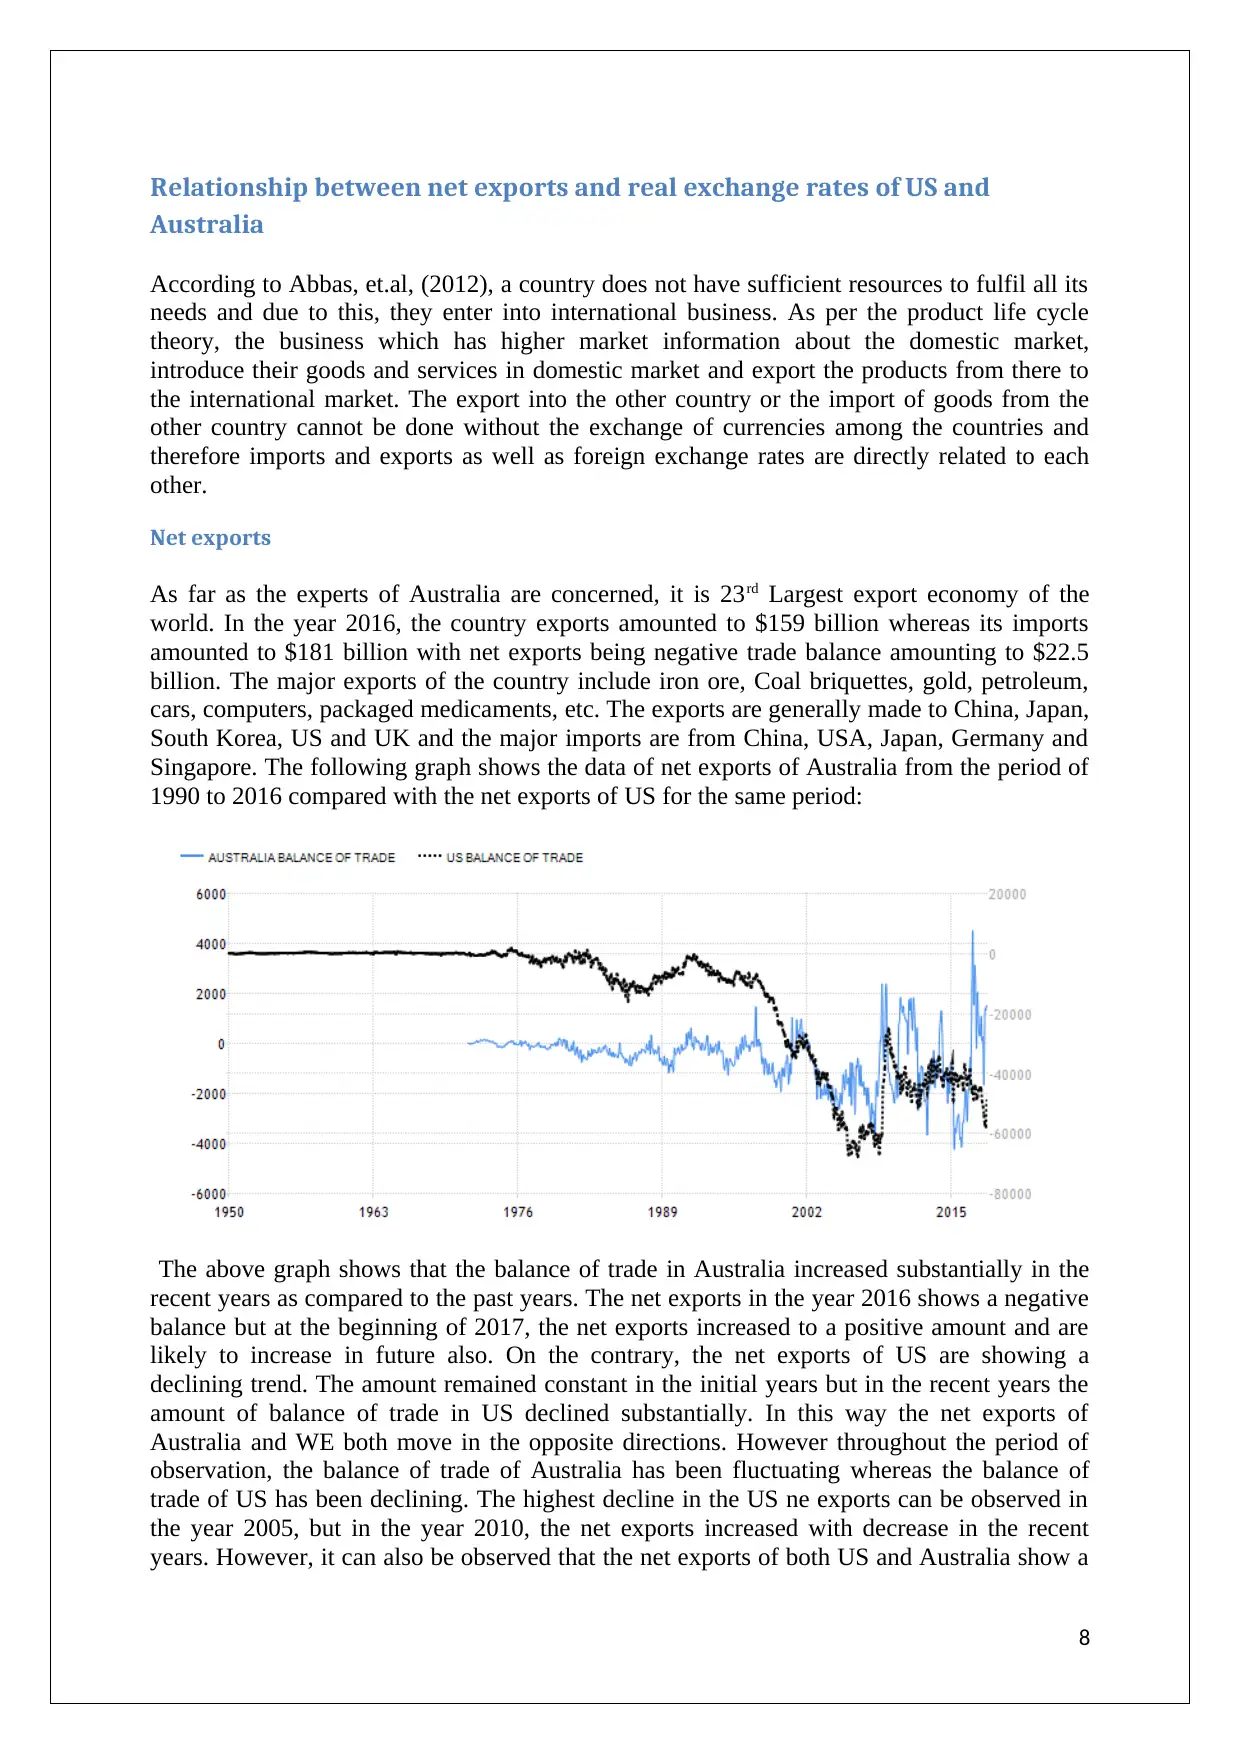
Net exports
As far as the experts of Australia are concerned, it is 23rd Largest export economy of the
world. In the year 2016, the country exports amounted to $159 billion whereas its imports
amounted to $181 billion with net exports being negative trade balance amounting to $22.5
billion. The major exports of the country include iron ore, Coal briquettes, gold, petroleum,
cars, computers, packaged medicaments, etc. The exports are generally made to China, Japan,
South Korea, US and UK and the major imports are from China, USA, Japan, Germany and
Singapore. The following graph shows the data of net exports of Australia from the period of
1990 to 2016 compared with the net exports of US for the same period:
The above graph shows that the balance of trade in Australia increased substantially in the
recent years as compared to the past years. The net exports in the year 2016 shows a negative
balance but at the beginning of 2017, the net exports increased to a positive amount and are
likely to increase in future also. On the contrary, the net exports of US are showing a
declining trend. The amount remained constant in the initial years but in the recent years the
amount of balance of trade in US declined substantially. In this way the net exports of
Australia and WE both move in the opposite directions. However throughout the period of
observation, the balance of trade of Australia has been fluctuating whereas the balance of
trade of US has been declining. The highest decline in the US ne exports can be observed in
the year 2005, but in the year 2010, the net exports increased with decrease in the recent
years. However, it can also be observed that the net exports of both US and Australia show a
8
Australia
According to Abbas, et.al, (2012), a country does not have sufficient resources to fulfil all its
needs and due to this, they enter into international business. As per the product life cycle
theory, the business which has higher market information about the domestic market,
introduce their goods and services in domestic market and export the products from there to
the international market. The export into the other country or the import of goods from the
other country cannot be done without the exchange of currencies among the countries and
therefore imports and exports as well as foreign exchange rates are directly related to each
other.
Net exports
As far as the experts of Australia are concerned, it is 23rd Largest export economy of the
world. In the year 2016, the country exports amounted to $159 billion whereas its imports
amounted to $181 billion with net exports being negative trade balance amounting to $22.5
billion. The major exports of the country include iron ore, Coal briquettes, gold, petroleum,
cars, computers, packaged medicaments, etc. The exports are generally made to China, Japan,
South Korea, US and UK and the major imports are from China, USA, Japan, Germany and
Singapore. The following graph shows the data of net exports of Australia from the period of
1990 to 2016 compared with the net exports of US for the same period:
The above graph shows that the balance of trade in Australia increased substantially in the
recent years as compared to the past years. The net exports in the year 2016 shows a negative
balance but at the beginning of 2017, the net exports increased to a positive amount and are
likely to increase in future also. On the contrary, the net exports of US are showing a
declining trend. The amount remained constant in the initial years but in the recent years the
amount of balance of trade in US declined substantially. In this way the net exports of
Australia and WE both move in the opposite directions. However throughout the period of
observation, the balance of trade of Australia has been fluctuating whereas the balance of
trade of US has been declining. The highest decline in the US ne exports can be observed in
the year 2005, but in the year 2010, the net exports increased with decrease in the recent
years. However, it can also be observed that the net exports of both US and Australia show a
8
negative balance which means that the imports of both the countries are higher than their
exports.
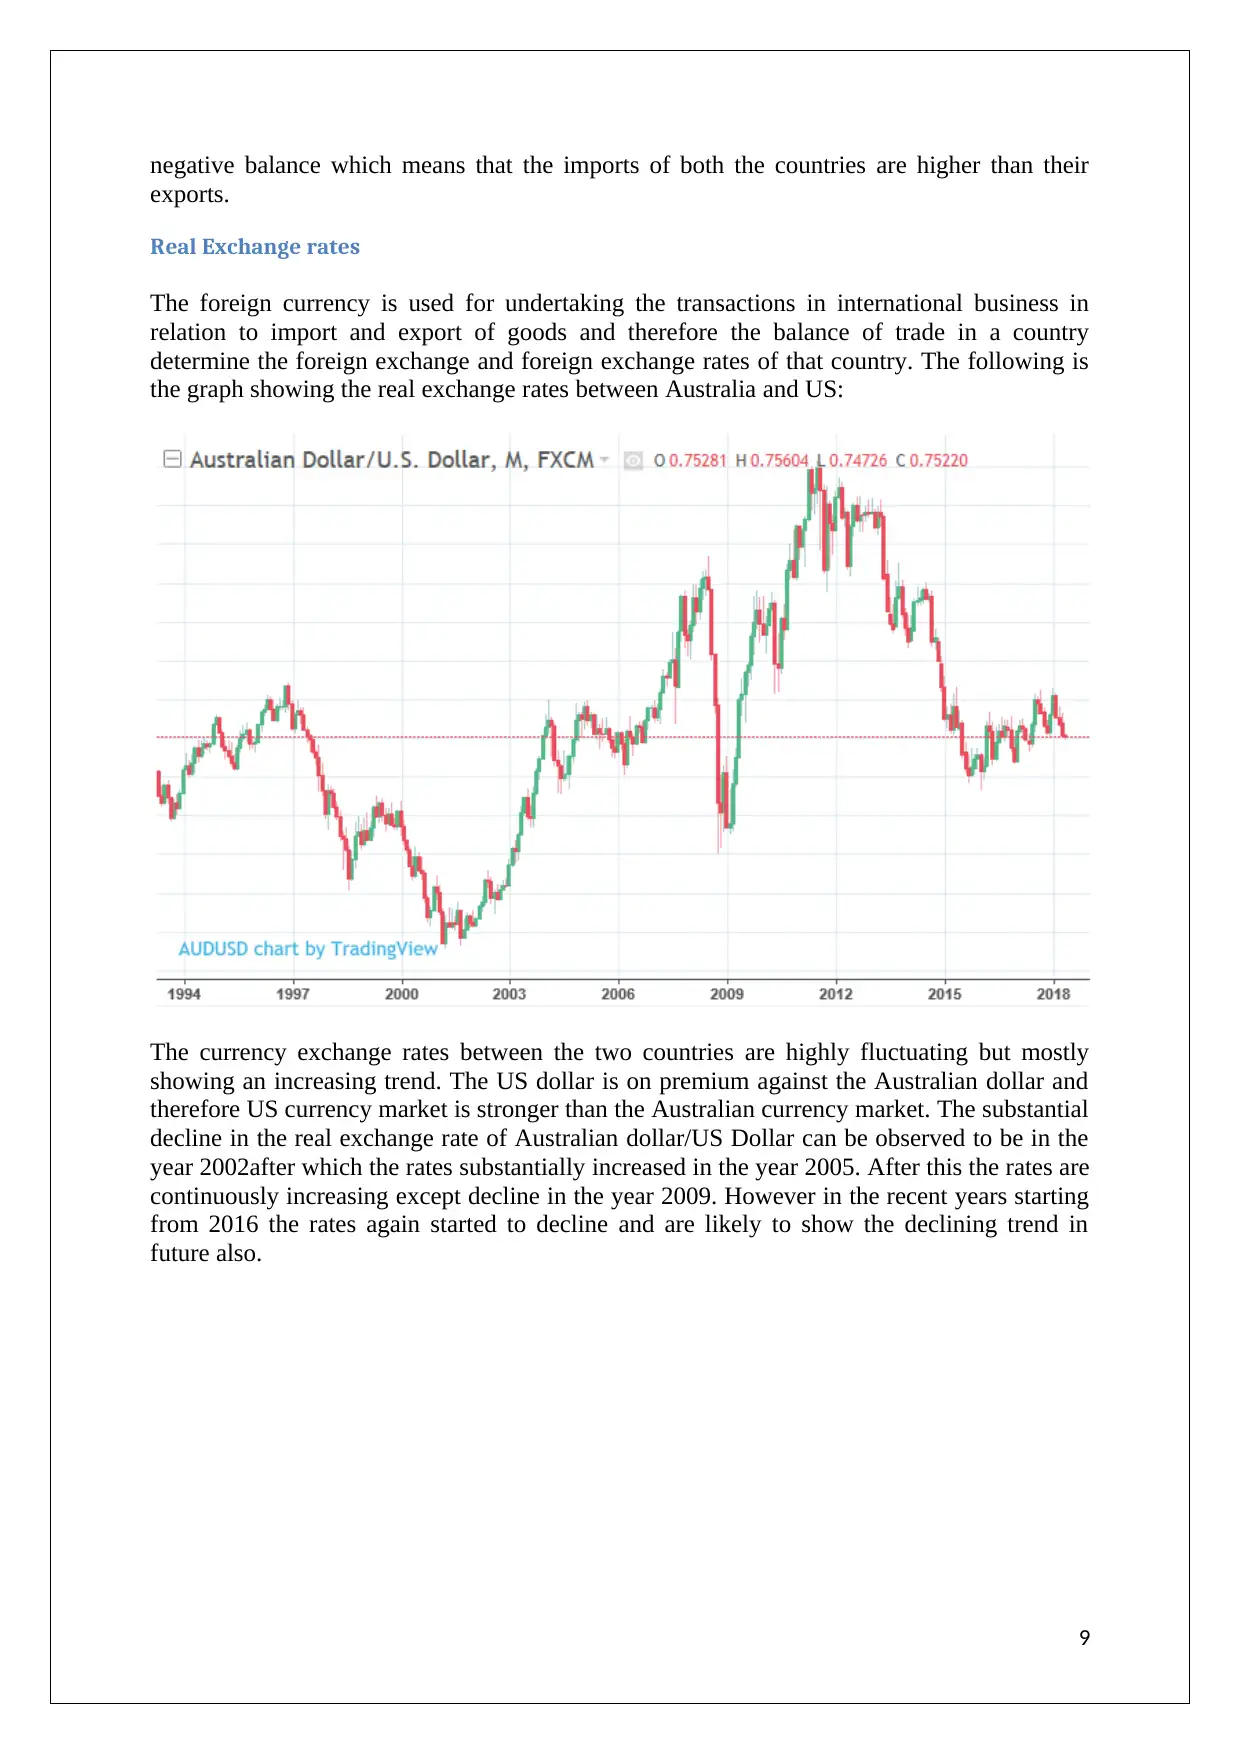
Real Exchange rates
The foreign currency is used for undertaking the transactions in international business in
relation to import and export of goods and therefore the balance of trade in a country
determine the foreign exchange and foreign exchange rates of that country. The following is
the graph showing the real exchange rates between Australia and US:
The currency exchange rates between the two countries are highly fluctuating but mostly
showing an increasing trend. The US dollar is on premium against the Australian dollar and
therefore US currency market is stronger than the Australian currency market. The substantial
decline in the real exchange rate of Australian dollar/US Dollar can be observed to be in the
year 2002after which the rates substantially increased in the year 2005. After this the rates are
continuously increasing except decline in the year 2009. However in the recent years starting
from 2016 the rates again started to decline and are likely to show the declining trend in
future also.
9
exports.
Real Exchange rates
The foreign currency is used for undertaking the transactions in international business in
relation to import and export of goods and therefore the balance of trade in a country
determine the foreign exchange and foreign exchange rates of that country. The following is
the graph showing the real exchange rates between Australia and US:
The currency exchange rates between the two countries are highly fluctuating but mostly
showing an increasing trend. The US dollar is on premium against the Australian dollar and
therefore US currency market is stronger than the Australian currency market. The substantial
decline in the real exchange rate of Australian dollar/US Dollar can be observed to be in the
year 2002after which the rates substantially increased in the year 2005. After this the rates are
continuously increasing except decline in the year 2009. However in the recent years starting
from 2016 the rates again started to decline and are likely to show the declining trend in
future also.
9
⊘ This is a preview!⊘
Do you want full access?
Subscribe today to unlock all pages.
Trusted by 1+ million students worldwide
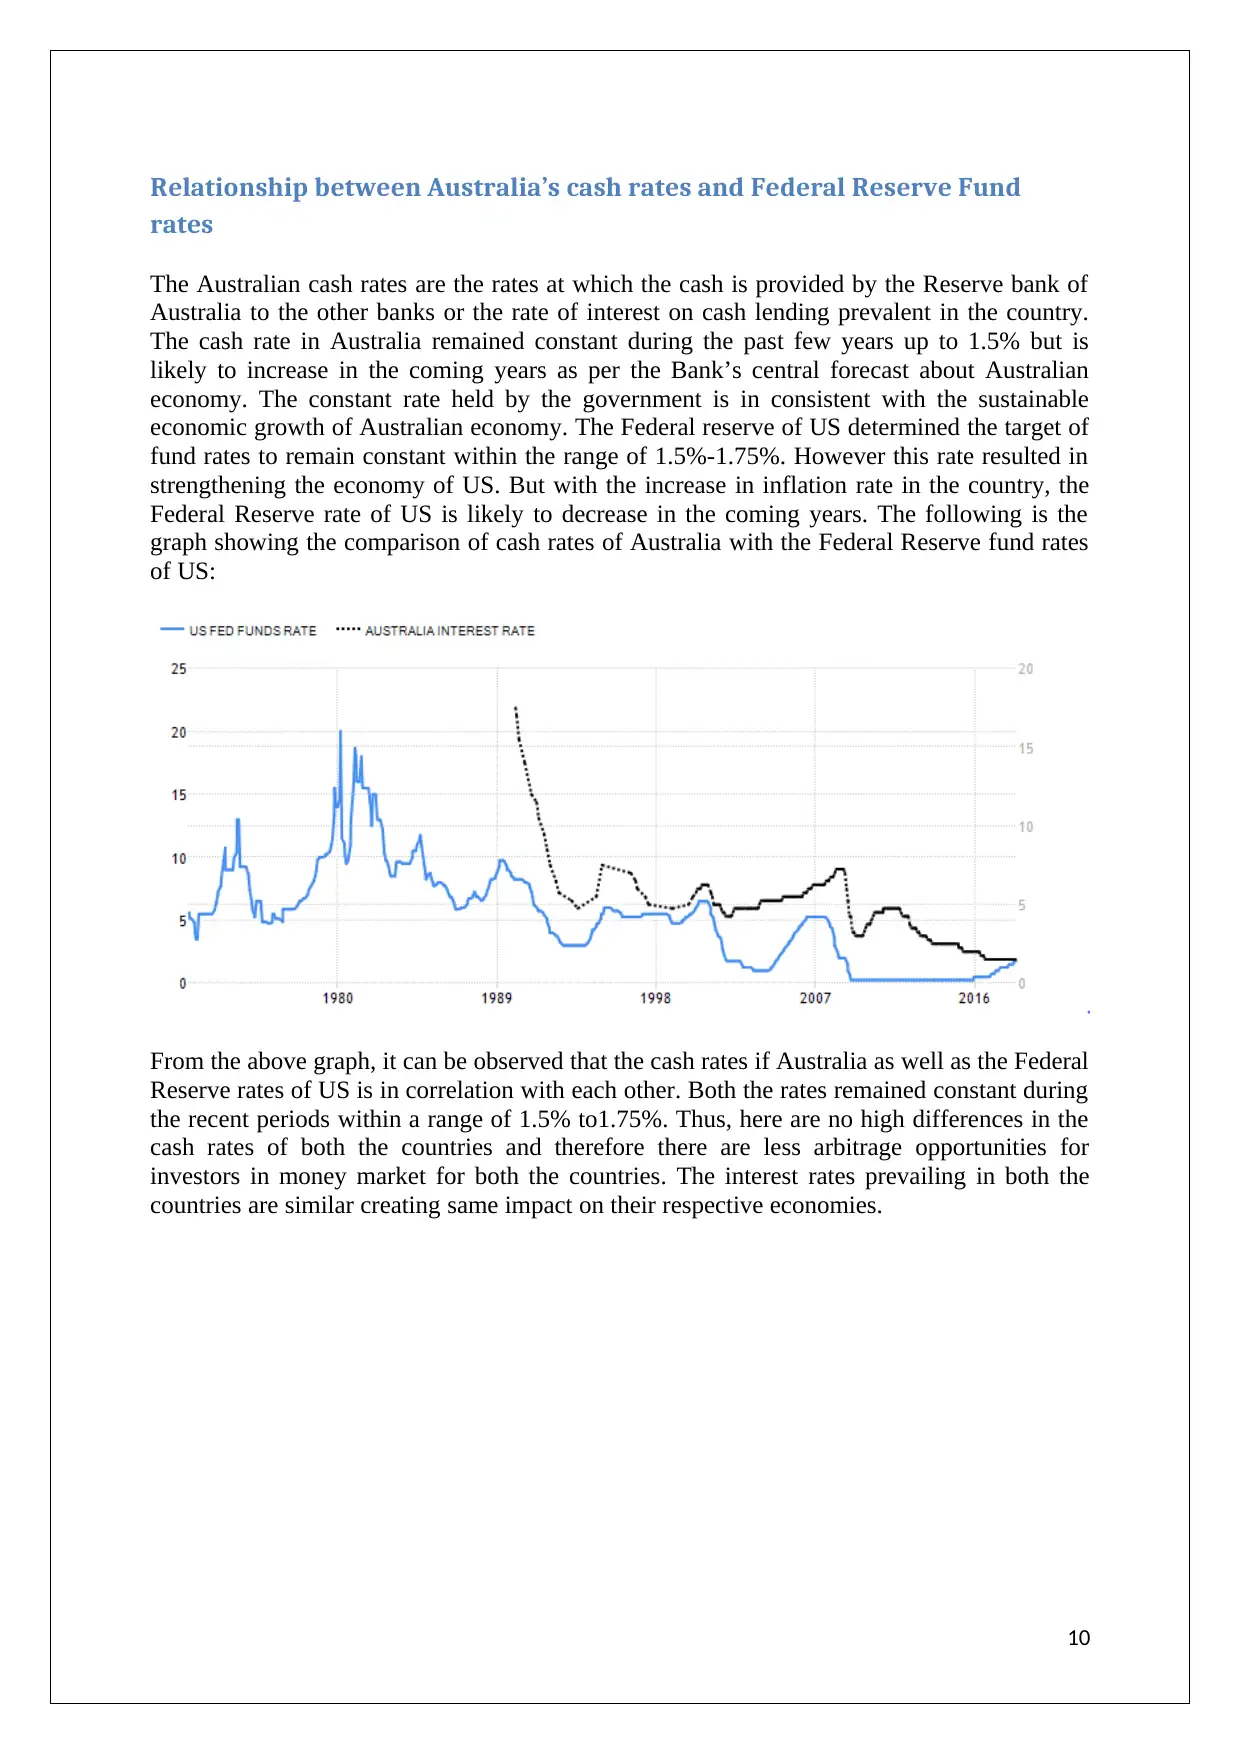
Relationship between Australia’s cash rates and Federal Reserve Fund
rates
The Australian cash rates are the rates at which the cash is provided by the Reserve bank of
Australia to the other banks or the rate of interest on cash lending prevalent in the country.
The cash rate in Australia remained constant during the past few years up to 1.5% but is
likely to increase in the coming years as per the Bank’s central forecast about Australian
economy. The constant rate held by the government is in consistent with the sustainable
economic growth of Australian economy. The Federal reserve of US determined the target of
fund rates to remain constant within the range of 1.5%-1.75%. However this rate resulted in
strengthening the economy of US. But with the increase in inflation rate in the country, the
Federal Reserve rate of US is likely to decrease in the coming years. The following is the
graph showing the comparison of cash rates of Australia with the Federal Reserve fund rates
of US:
From the above graph, it can be observed that the cash rates if Australia as well as the Federal
Reserve rates of US is in correlation with each other. Both the rates remained constant during
the recent periods within a range of 1.5% to1.75%. Thus, here are no high differences in the
cash rates of both the countries and therefore there are less arbitrage opportunities for
investors in money market for both the countries. The interest rates prevailing in both the
countries are similar creating same impact on their respective economies.
10
Paraphrase This Document
Need a fresh take? Get an instant paraphrase of this document with our AI Paraphraser
Prediction of macroeconomic outlook of Australia
The predictions about the Australian economy state that the economy will grow at a high
pace with the increased investments likely to be made in the housing and mining sectors of
the country. Also the private consumption is likely to increase due to the strengthening of
labour market and household income of the population. As a result, the inflation is also
expected to rise. The increasing exports and strong labour market in the country are the major
reasons of economic growth.
The predictions of the increase in cash rates and exports suggest the growth of Australian
economy at a fast pace. The employment in the country has strongly grown in the recent
years and the reduction in the unemployment is also expected in the near future. With this the
rate of wages of workers is also expected to grow. The inflation rate of Australian economy is
low with Both CPI and inflation rate running less than 2%. But with the strengthening f
economy, the inflation is also likely to pick-up. However the Australian dollar has recently
depreciated as compared to the US dollar but the weighted average rate has remained within
the range. The low interest rates of Australia also support the Australian economy. In this
way the various macroeconomic factors are likely to create a positive impact resulting in the
strengthening of the economy of Australia. Thus the prediction of the macroeconomic
outlook of the country is that the economy will grow at a robust pace resulting in increase in
unemployment rates, appreciation in exchange rates, growth in CPI and GDP and increase in
net exports of the country. The predictions relate to the expected rise in the cash rates during
the year 2018 and 2019 up to 3%. Also the net exports are likely to grow to a positive balance
of trade. The inflation rate is to rise by a margin of 2%. Hus, the overall growth of the
economy is expected to pick up by 35 in the ear 2018 and 2019.
11
Conclusion and recommendations
From the discussion based on the research of the economic factors of Australia, it can be
concluded that the Australian economy is expected to strengthen and grow within a period of
next few years. The economy has significantly grown from past as observed from the
historical data from 1990 to 2016. There are some macroeconomic factors which support the
growth of economy such as constant low cash rates, increased unemployment, increase in net
exports, increase in GDP labour and CPI. However, the macroeconomic factors such as high
inflation rate, depreciation of real exchange rates etc. Also resulted in the decline of
economy. The overall perspective suggests that the economic growth has been fluctuating
with the declining trend in the recent years but the pace of growth has started to rise. Thus the
economy of Australia is striving from average growth rate to a high growth rate. It is
recommended that e potential increase in the cash rates and GDP growth will give rise to the
inflation rate in the country which will depreciate the Australian currency.
12
⊘ This is a preview!⊘
Do you want full access?
Subscribe today to unlock all pages.
Trusted by 1+ million students worldwide
1 out of 13
Related Documents


Your All-in-One AI-Powered Toolkit for Academic Success.
+13062052269
info@desklib.com
Available 24*7 on WhatsApp / Email
![[object Object]](/_next/static/media/star-bottom.7253800d.svg)
Unlock your academic potential
Copyright © 2020–2026 A2Z Services. All Rights Reserved. Developed and managed by ZUCOL.