Comprehensive Economic Report: Australia's GDP, Labour & Prices
VerifiedAdded on 2023/06/10
|7
|1730
|101
Report
AI Summary
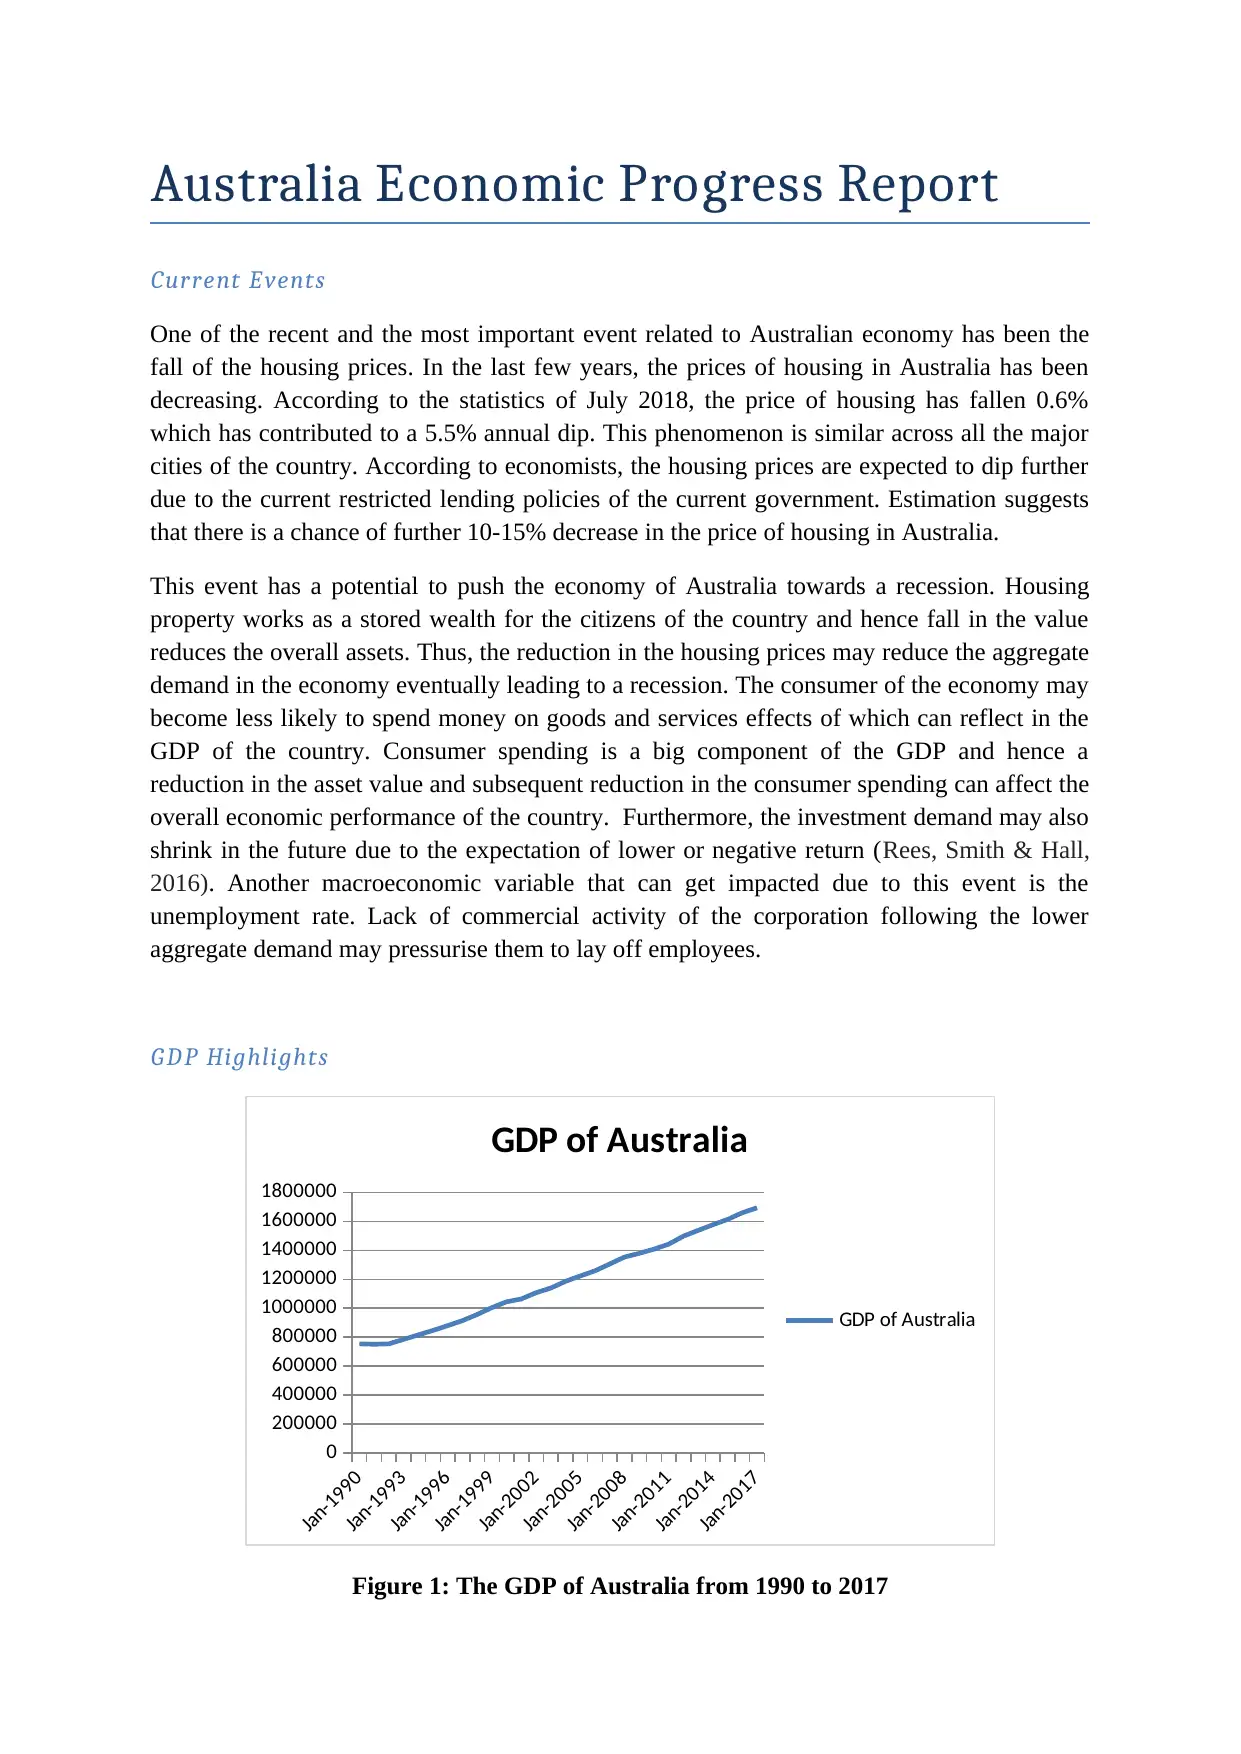
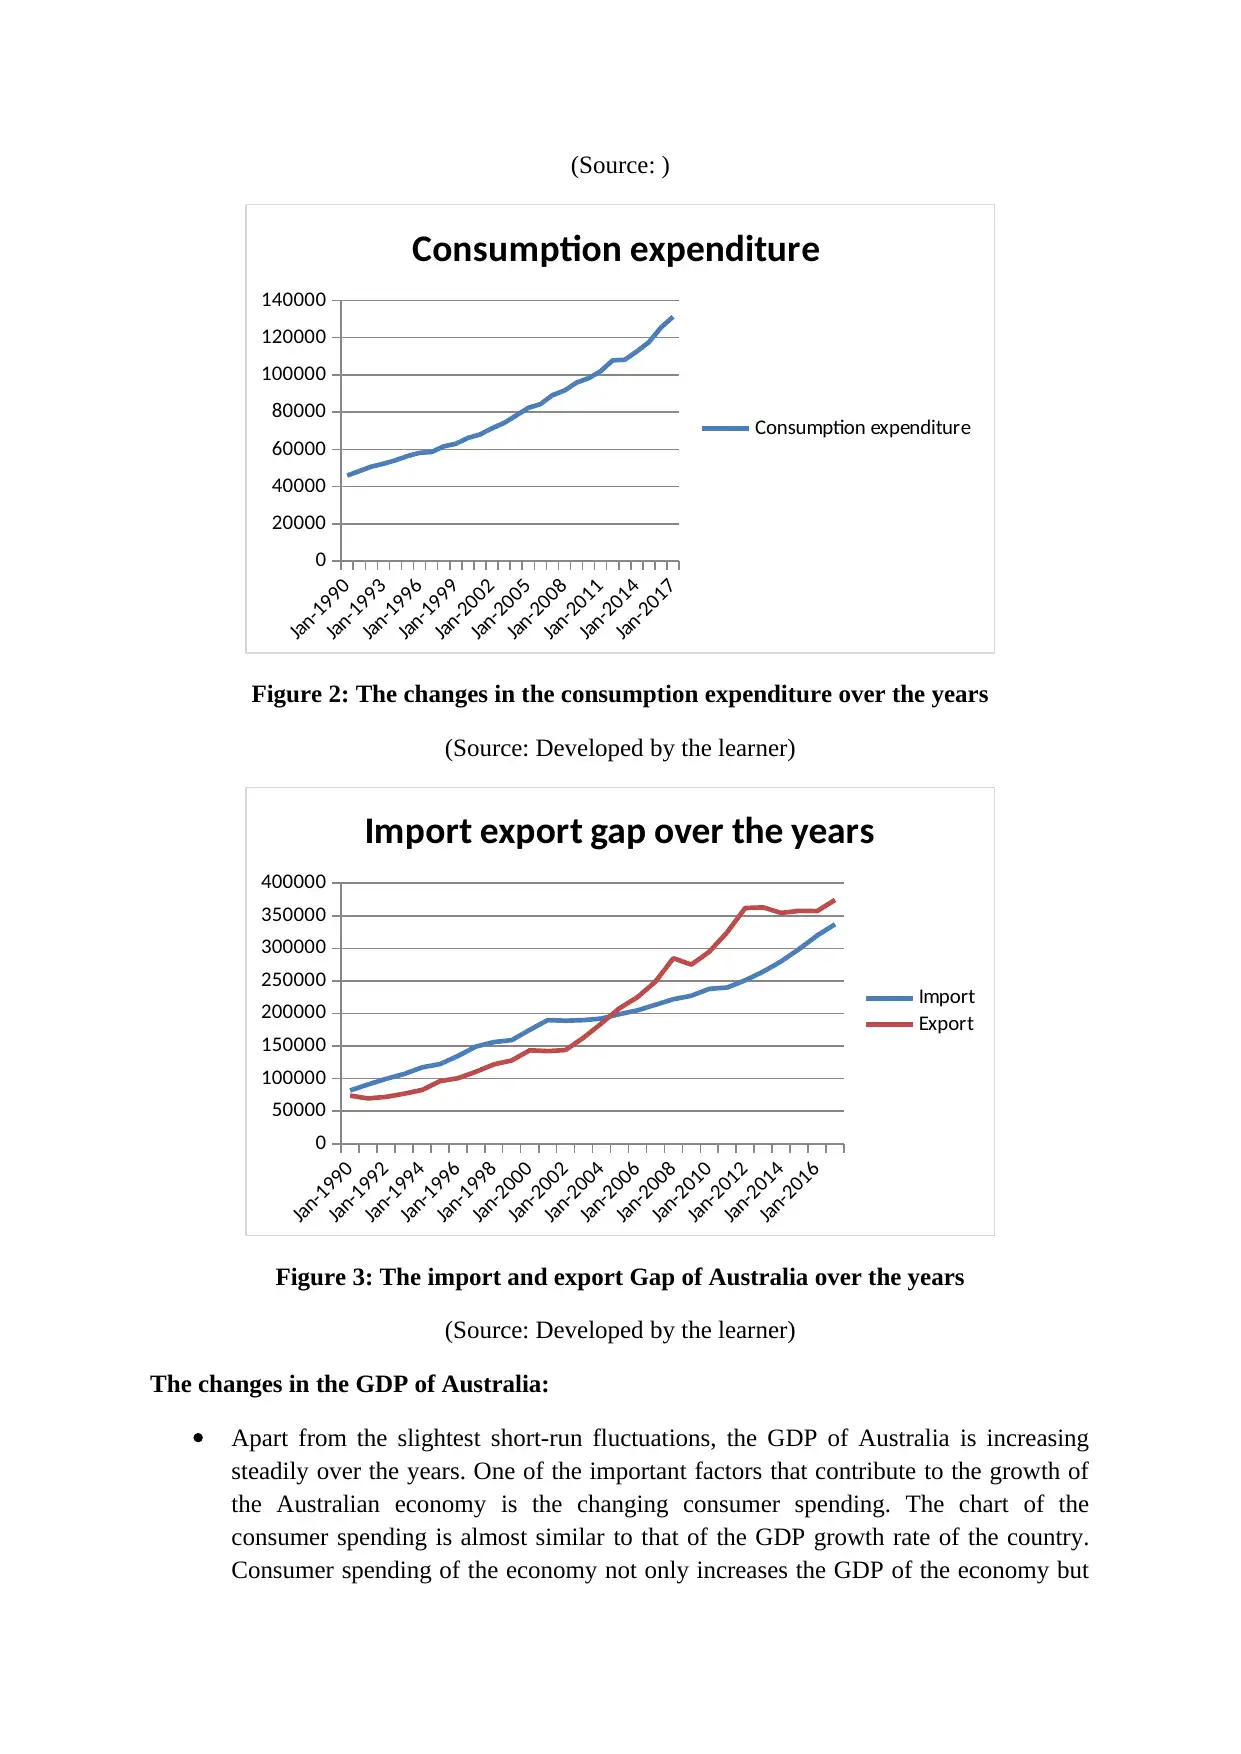
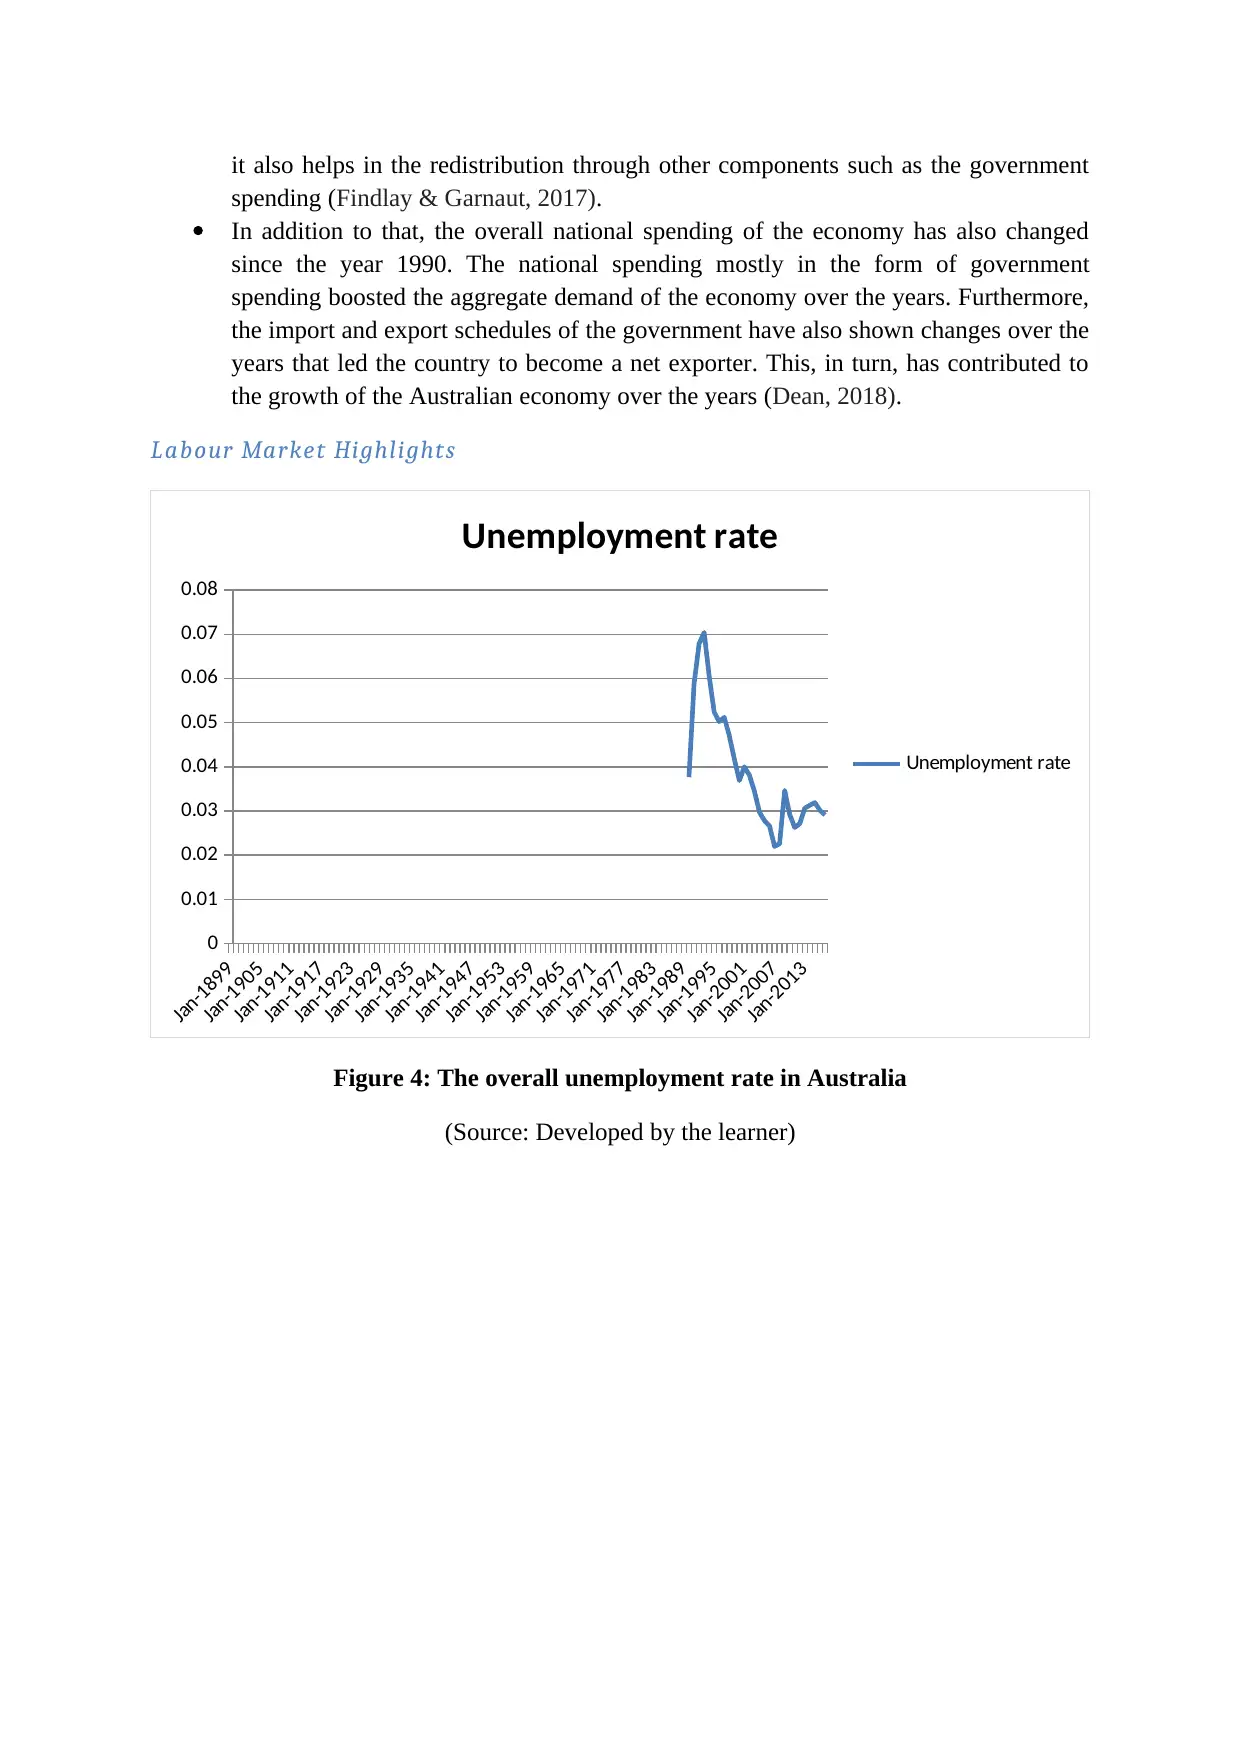
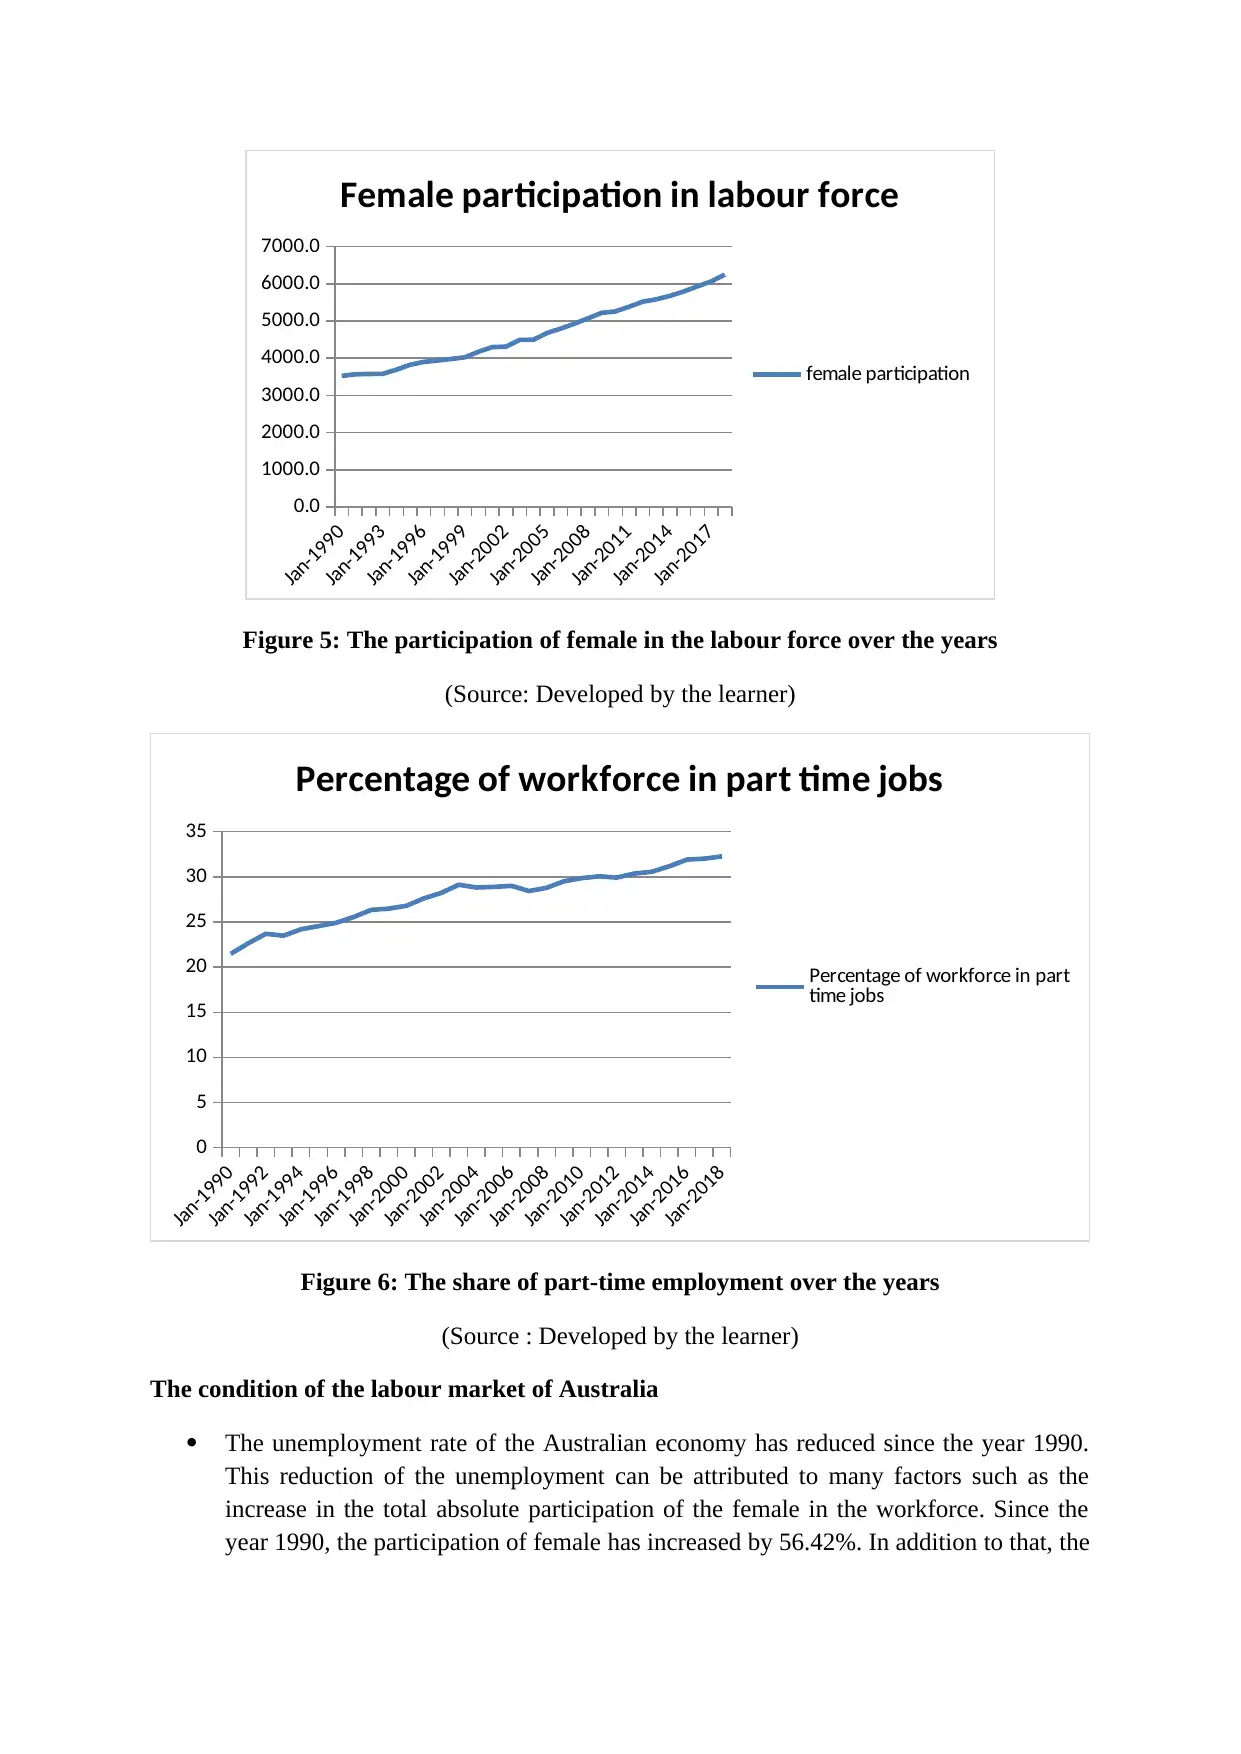
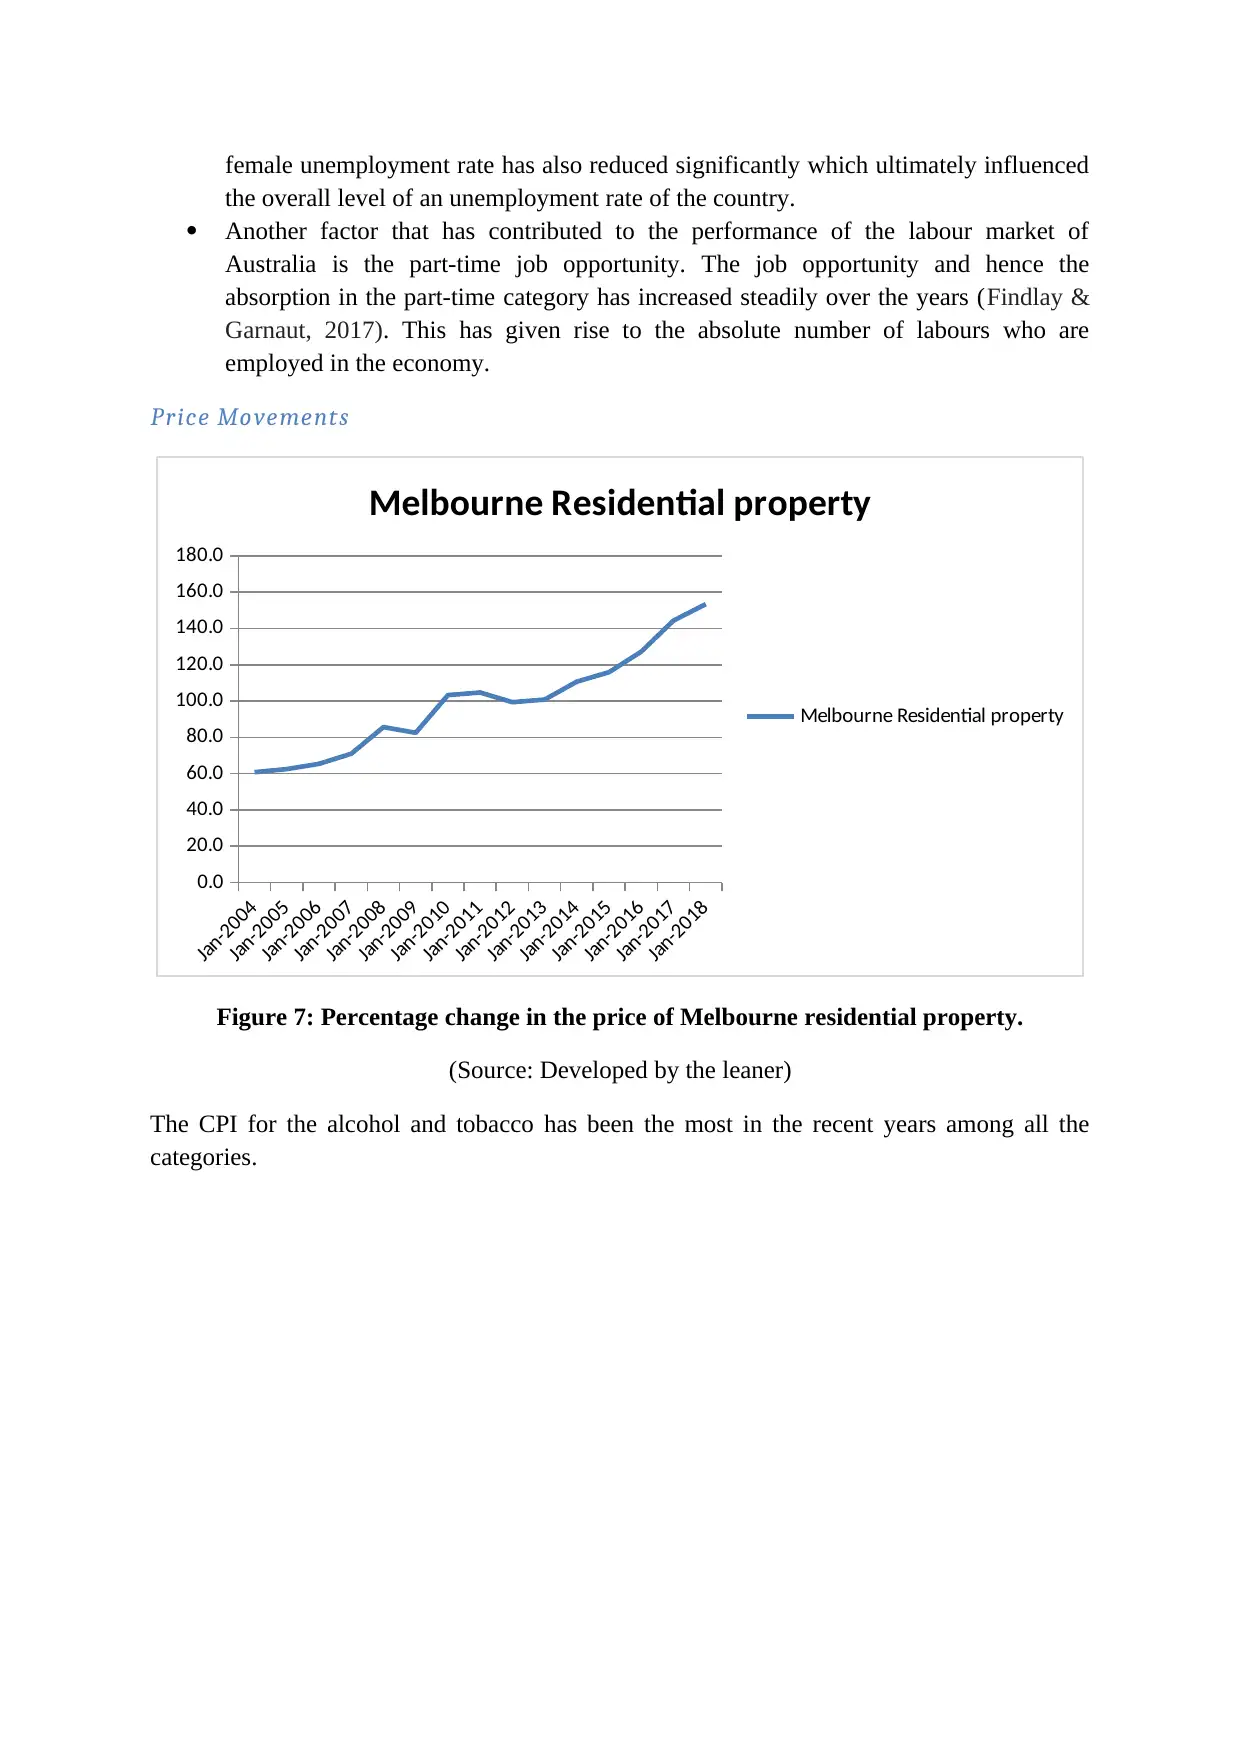
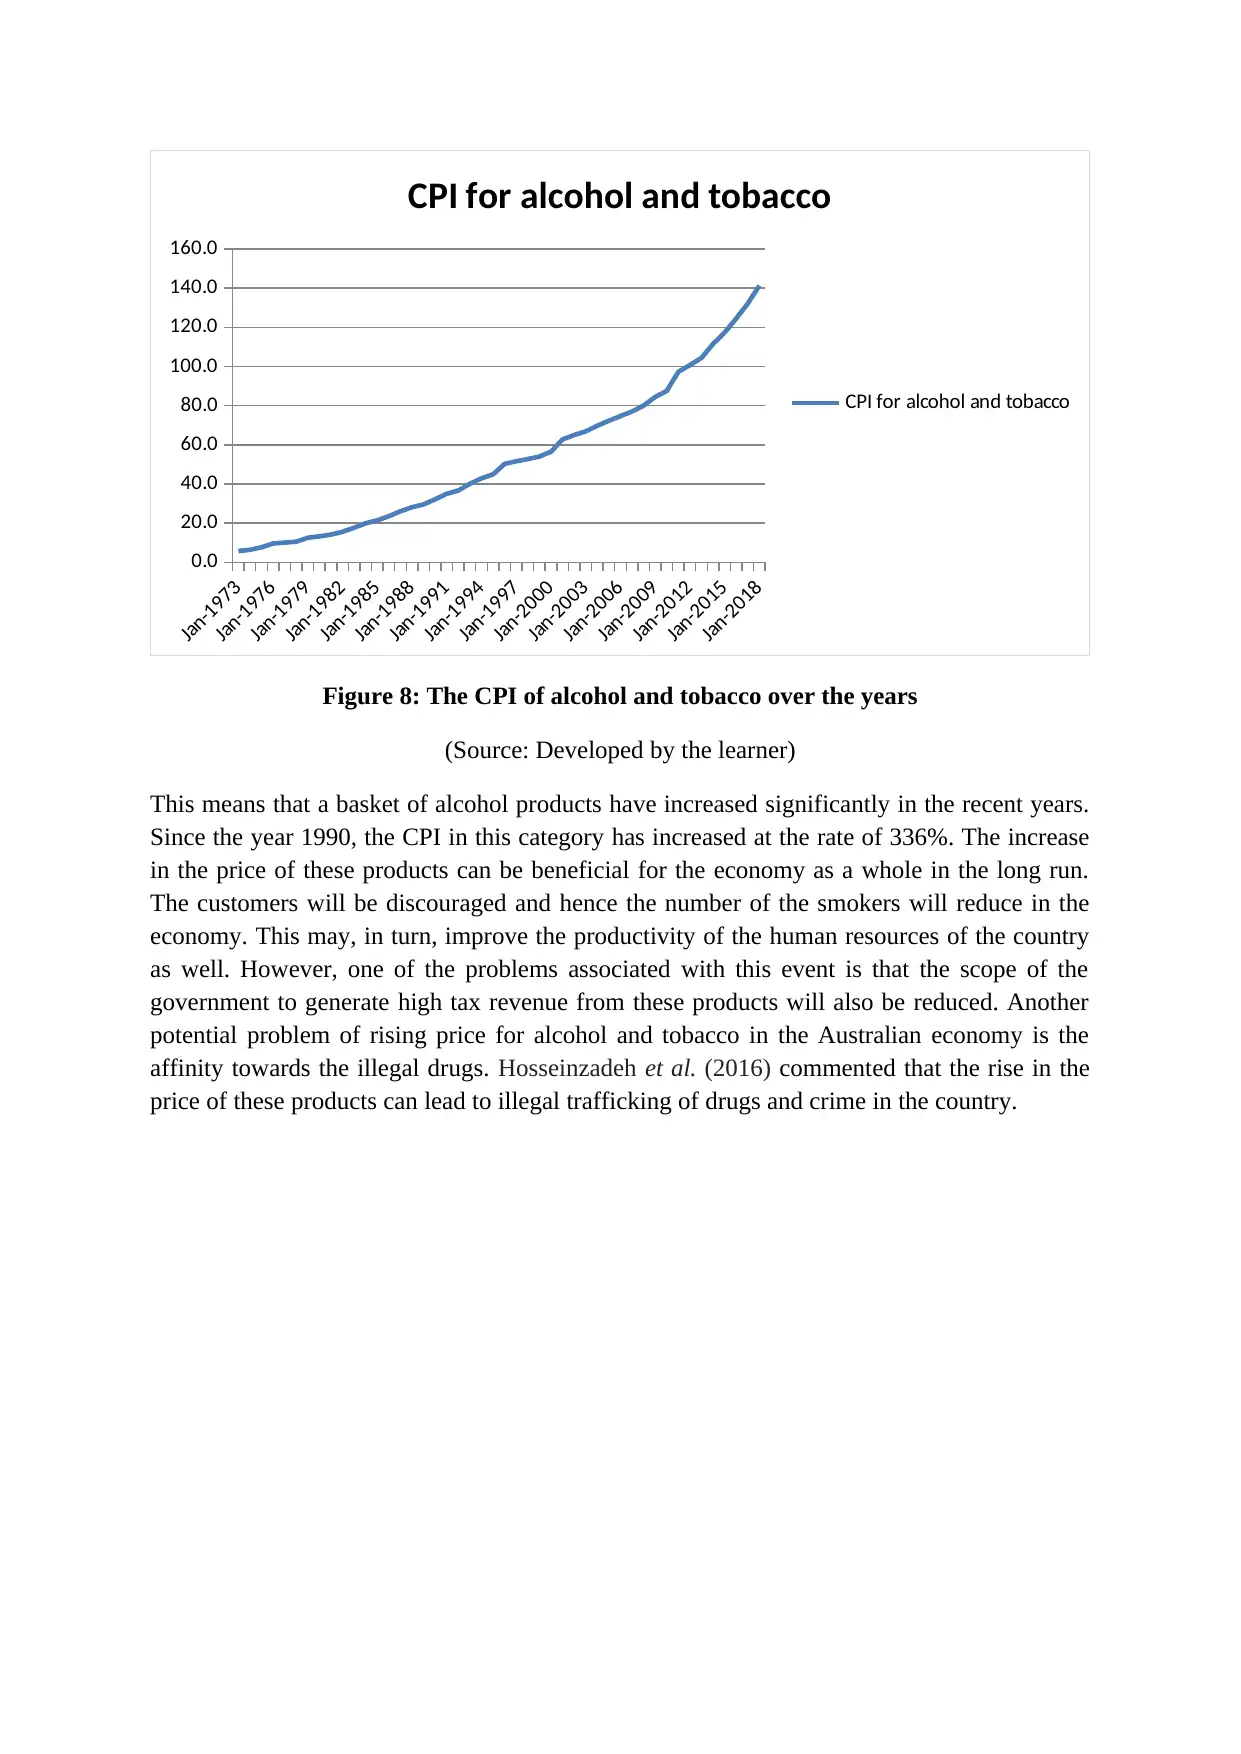
This report provides an analysis of the Australian economy, focusing on current events and their potential macroeconomic effects. It examines the recent fall in housing prices and its possible impact on the GDP and employment rate. The report highlights the trends in Australia's GDP, consumption expenditure, and import-export balance from 1990 to 2017, noting a steady increase in GDP driven by consumer spending and government initiatives. It also assesses the labor market, pointing out the reduction in the unemployment rate due to increased female participation and part-time job opportunities. Furthermore, the report discusses price movements, particularly the significant rise in the CPI for alcohol and tobacco, and its potential long-term benefits and drawbacks. The analysis references various economic studies to support its findings. Desklib provides this assignment solution and many other resources for students.

Australia Economic Progress Report
Current Events
One of the recent and the most important event related to Australian economy has been the
fall of the housing prices. In the last few years, the prices of housing in Australia has been
decreasing. According to the statistics of July 2018, the price of housing has fallen 0.6%
which has contributed to a 5.5% annual dip. This phenomenon is similar across all the major
cities of the country. According to economists, the housing prices are expected to dip further
due to the current restricted lending policies of the current government. Estimation suggests
that there is a chance of further 10-15% decrease in the price of housing in Australia.
This event has a potential to push the economy of Australia towards a recession. Housing
property works as a stored wealth for the citizens of the country and hence fall in the value
reduces the overall assets. Thus, the reduction in the housing prices may reduce the aggregate
demand in the economy eventually leading to a recession. The consumer of the economy may
become less likely to spend money on goods and services effects of which can reflect in the
GDP of the country. Consumer spending is a big component of the GDP and hence a
reduction in the asset value and subsequent reduction in the consumer spending can affect the
overall economic performance of the country. Furthermore, the investment demand may also
shrink in the future due to the expectation of lower or negative return (Rees, Smith & Hall,
2016). Another macroeconomic variable that can get impacted due to this event is the
unemployment rate. Lack of commercial activity of the corporation following the lower
aggregate demand may pressurise them to lay off employees.
GDP Highlights
Jan-1990
Jan-1993
Jan-1996
Jan-1999
Jan-2002
Jan-2005
Jan-2008
Jan-2011
Jan-2014
Jan-2017
0
200000
400000
600000
800000
1000000
1200000
1400000
1600000
1800000
GDP of Australia
GDP of Australia
Figure 1: The GDP of Australia from 1990 to 2017
Paraphrase This Document
Need a fresh take? Get an instant paraphrase of this document with our AI Paraphraser

(Source: )
Jan-1990
Jan-1993
Jan-1996
Jan-1999
Jan-2002
Jan-2005
Jan-2008
Jan-2011
Jan-2014
Jan-2017
0
20000
40000
60000
80000
100000
120000
140000
Consumption expenditure
Figure 2: The changes in the consumption expenditure over the years
(Source: Developed by the learner)
Jan-1990
Jan-1992
Jan-1994
Jan-1996
Jan-1998
Jan-2000
Jan-2002
Jan-2004
Jan-2006
Jan-2008
Jan-2010
Jan-2012
Jan-2014
Jan-2016
0
50000
100000
150000
200000
250000
300000
350000
400000
Import export gap over the years
Import
Export
Figure 3: The import and export Gap of Australia over the years
(Source: Developed by the learner)
The changes in the GDP of Australia:
Apart from the slightest short-run fluctuations, the GDP of Australia is increasing
steadily over the years. One of the important factors that contribute to the growth of
the Australian economy is the changing consumer spending. The chart of the
consumer spending is almost similar to that of the GDP growth rate of the country.
Consumer spending of the economy not only increases the GDP of the economy but
Jan-1990
Jan-1993
Jan-1996
Jan-1999
Jan-2002
Jan-2005
Jan-2008
Jan-2011
Jan-2014
Jan-2017
0
20000
40000
60000
80000
100000
120000
140000
Consumption expenditure
Figure 2: The changes in the consumption expenditure over the years
(Source: Developed by the learner)
Jan-1990
Jan-1992
Jan-1994
Jan-1996
Jan-1998
Jan-2000
Jan-2002
Jan-2004
Jan-2006
Jan-2008
Jan-2010
Jan-2012
Jan-2014
Jan-2016
0
50000
100000
150000
200000
250000
300000
350000
400000
Import export gap over the years
Import
Export
Figure 3: The import and export Gap of Australia over the years
(Source: Developed by the learner)
The changes in the GDP of Australia:
Apart from the slightest short-run fluctuations, the GDP of Australia is increasing
steadily over the years. One of the important factors that contribute to the growth of
the Australian economy is the changing consumer spending. The chart of the
consumer spending is almost similar to that of the GDP growth rate of the country.
Consumer spending of the economy not only increases the GDP of the economy but

it also helps in the redistribution through other components such as the government
spending (Findlay & Garnaut, 2017).
In addition to that, the overall national spending of the economy has also changed
since the year 1990. The national spending mostly in the form of government
spending boosted the aggregate demand of the economy over the years. Furthermore,
the import and export schedules of the government have also shown changes over the
years that led the country to become a net exporter. This, in turn, has contributed to
the growth of the Australian economy over the years (Dean, 2018).
Labour Market Highlights
Jan-1899
Jan-1905
Jan-1911
Jan-1917
Jan-1923
Jan-1929
Jan-1935
Jan-1941
Jan-1947
Jan-1953
Jan-1959
Jan-1965
Jan-1971
Jan-1977
Jan-1983
Jan-1989
Jan-1995
Jan-2001
Jan-2007
Jan-2013
0
0.01
0.02
0.03
0.04
0.05
0.06
0.07
0.08
Unemployment rate
Unemployment rate
Figure 4: The overall unemployment rate in Australia
(Source: Developed by the learner)
⊘ This is a preview!⊘
Do you want full access?
Subscribe today to unlock all pages.

Trusted by 1+ million students worldwide

Jan-1990
Jan-1993
Jan-1996
Jan-1999
Jan-2002
Jan-2005
Jan-2008
Jan-2011
Jan-2014
Jan-2017
0.0
1000.0
2000.0
3000.0
4000.0
5000.0
6000.0
7000.0
Female participation in labour force
female participation
Figure 5: The participation of female in the labour force over the years
(Source: Developed by the learner)
Jan-1990
Jan-1992
Jan-1994
Jan-1996
Jan-1998
Jan-2000
Jan-2002
Jan-2004
Jan-2006
Jan-2008
Jan-2010
Jan-2012
Jan-2014
Jan-2016
Jan-2018
0
5
10
15
20
25
30
35
Percentage of workforce in part time jobs
Percentage of workforce in part
time jobs
Figure 6: The share of part-time employment over the years
(Source : Developed by the learner)
The condition of the labour market of Australia
The unemployment rate of the Australian economy has reduced since the year 1990.
This reduction of the unemployment can be attributed to many factors such as the
increase in the total absolute participation of the female in the workforce. Since the
year 1990, the participation of female has increased by 56.42%. In addition to that, the
Paraphrase This Document
Need a fresh take? Get an instant paraphrase of this document with our AI Paraphraser

female unemployment rate has also reduced significantly which ultimately influenced
the overall level of an unemployment rate of the country.
Another factor that has contributed to the performance of the labour market of
Australia is the part-time job opportunity. The job opportunity and hence the
absorption in the part-time category has increased steadily over the years (Findlay &
Garnaut, 2017). This has given rise to the absolute number of labours who are
employed in the economy.
Price Movements
Jan-2004
Jan-2005
Jan-2006
Jan-2007
Jan-2008
Jan-2009
Jan-2010
Jan-2011
Jan-2012
Jan-2013
Jan-2014
Jan-2015
Jan-2016
Jan-2017
Jan-2018
0.0
20.0
40.0
60.0
80.0
100.0
120.0
140.0
160.0
180.0
Melbourne Residential property
Figure 7: Percentage change in the price of Melbourne residential property.
(Source: Developed by the leaner)
The CPI for the alcohol and tobacco has been the most in the recent years among all the
categories.

Jan-1973
Jan-1976
Jan-1979
Jan-1982
Jan-1985
Jan-1988
Jan-1991
Jan-1994
Jan-1997
Jan-2000
Jan-2003
Jan-2006
Jan-2009
Jan-2012
Jan-2015
Jan-2018
0.0
20.0
40.0
60.0
80.0
100.0
120.0
140.0
160.0
CPI for alcohol and tobacco
Figure 8: The CPI of alcohol and tobacco over the years
(Source: Developed by the learner)
This means that a basket of alcohol products have increased significantly in the recent years.
Since the year 1990, the CPI in this category has increased at the rate of 336%. The increase
in the price of these products can be beneficial for the economy as a whole in the long run.
The customers will be discouraged and hence the number of the smokers will reduce in the
economy. This may, in turn, improve the productivity of the human resources of the country
as well. However, one of the problems associated with this event is that the scope of the
government to generate high tax revenue from these products will also be reduced. Another
potential problem of rising price for alcohol and tobacco in the Australian economy is the
affinity towards the illegal drugs. Hosseinzadeh et al. (2016) commented that the rise in the
price of these products can lead to illegal trafficking of drugs and crime in the country.
⊘ This is a preview!⊘
Do you want full access?
Subscribe today to unlock all pages.

Trusted by 1+ million students worldwide

Reference
Dean, M. B. (2018). Manufacturing the future?: a critical analysis of policy responses to
deindustrialisation in South Australia (Doctoral dissertation).
Hosseinzadeh, A., Smyth, R., Valadkhani, A., & Le, V. (2016). Analyzing the efficiency
performance of major Australian mining companies using bootstrap data envelopment
analysis. Economic Modelling, 57, 26-35.
Rees, D. M., Smith, P., & Hall, J. (2016). A Multi‐sector Model of the Australian
Economy. Economic Record, 92(298), 374-408.
Findlay, C., & Garnaut, R. (2017). The political economy of manufacturing protection:
Experiences of ASEAN and Australia. Routledge.
1 out of 7
Related Documents

Your All-in-One AI-Powered Toolkit for Academic Success.
+13062052269
info@desklib.com
Available 24*7 on WhatsApp / Email
Unlock your academic potential
Copyright © 2020–2025 A2Z Services. All Rights Reserved. Developed and managed by ZUCOL.