Australia's Economic Response to the 2007-08 Crisis
VerifiedAdded on 2020/05/08
|22
|2529
|57
AI Summary
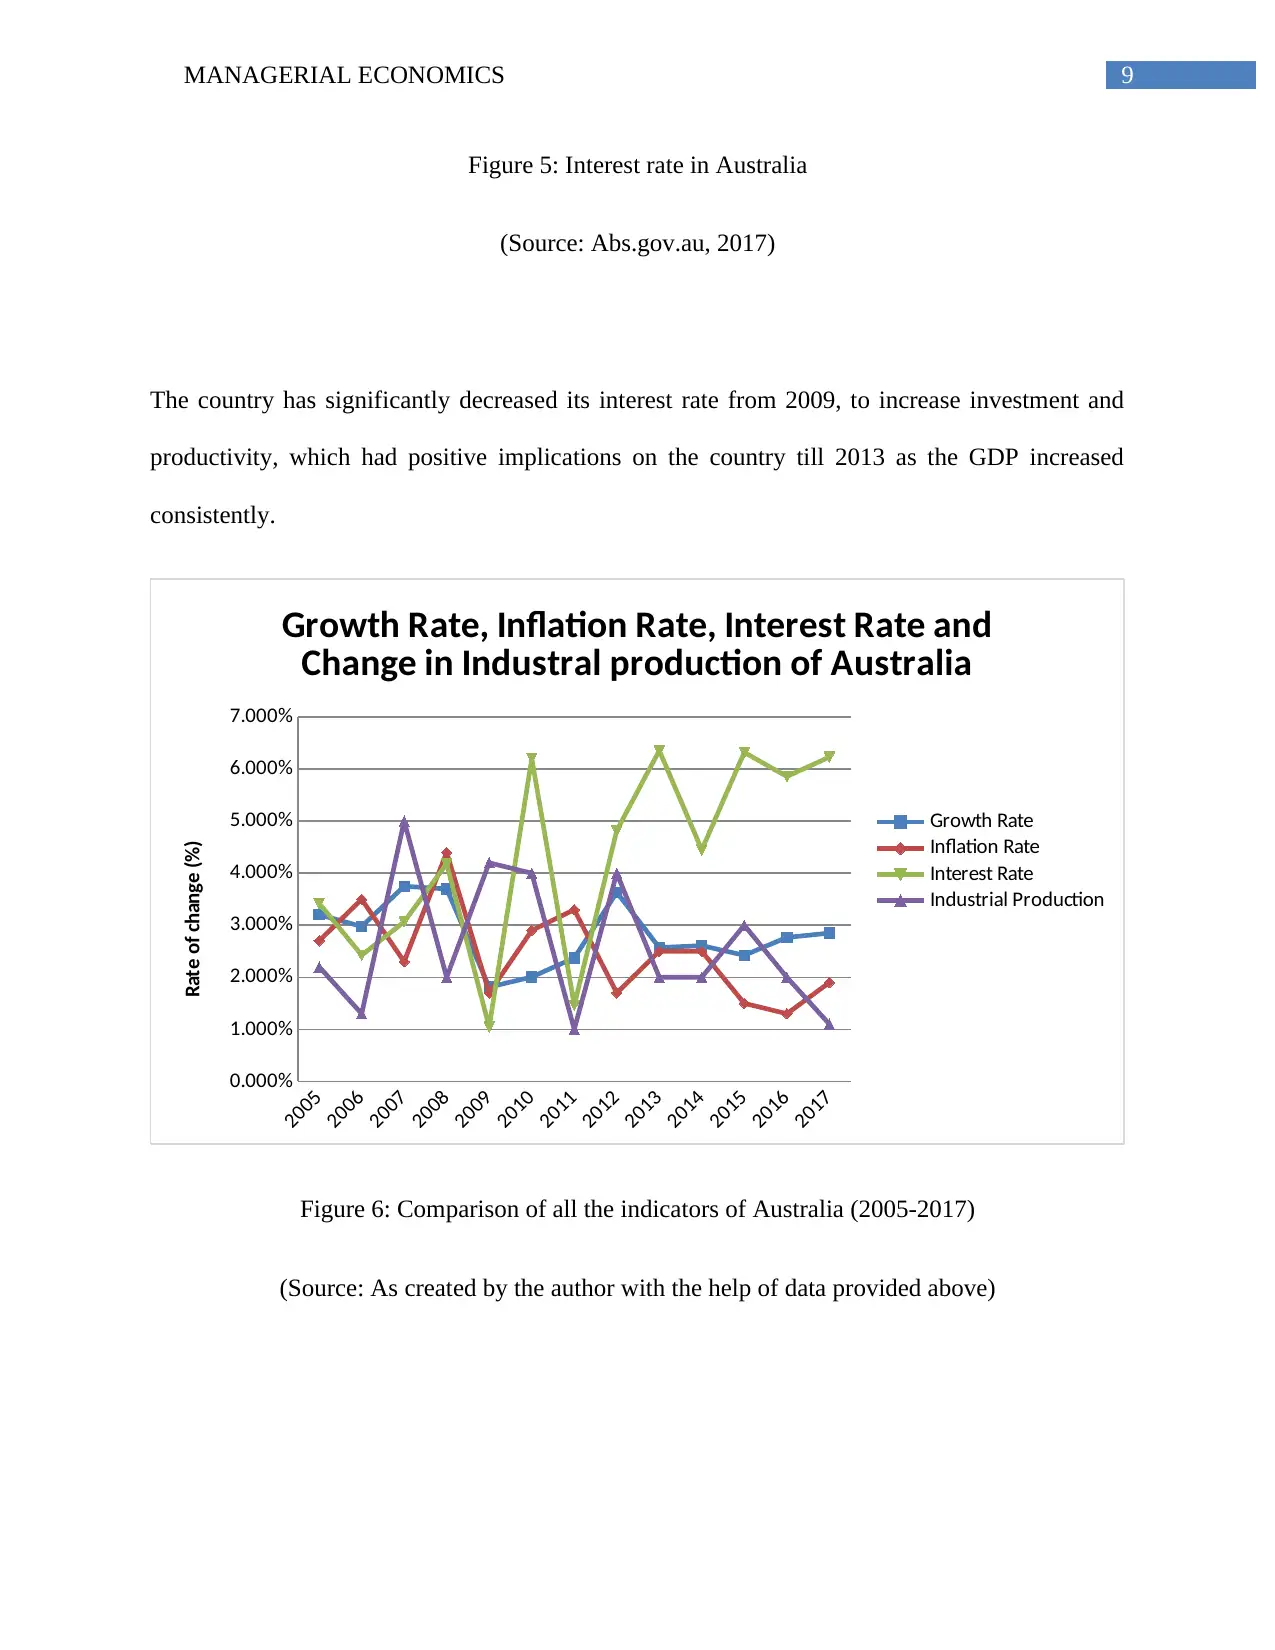
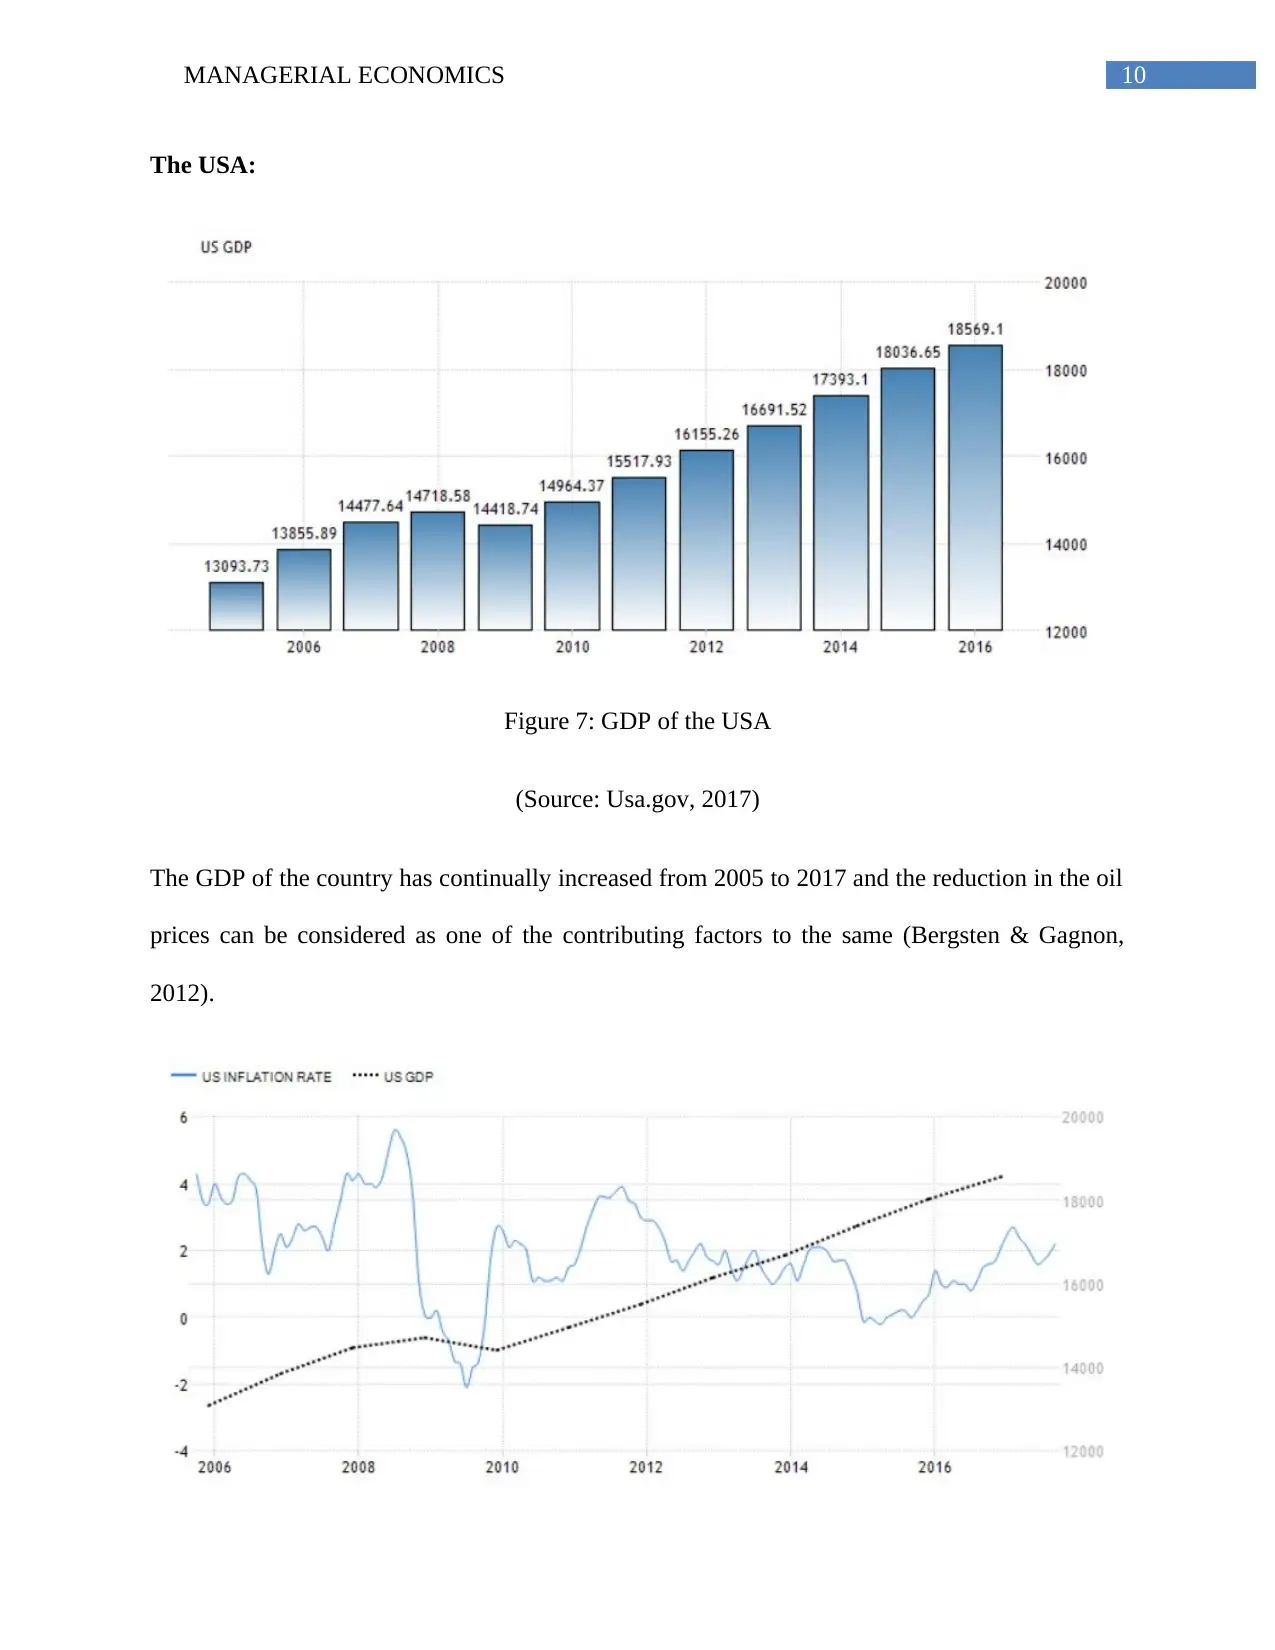
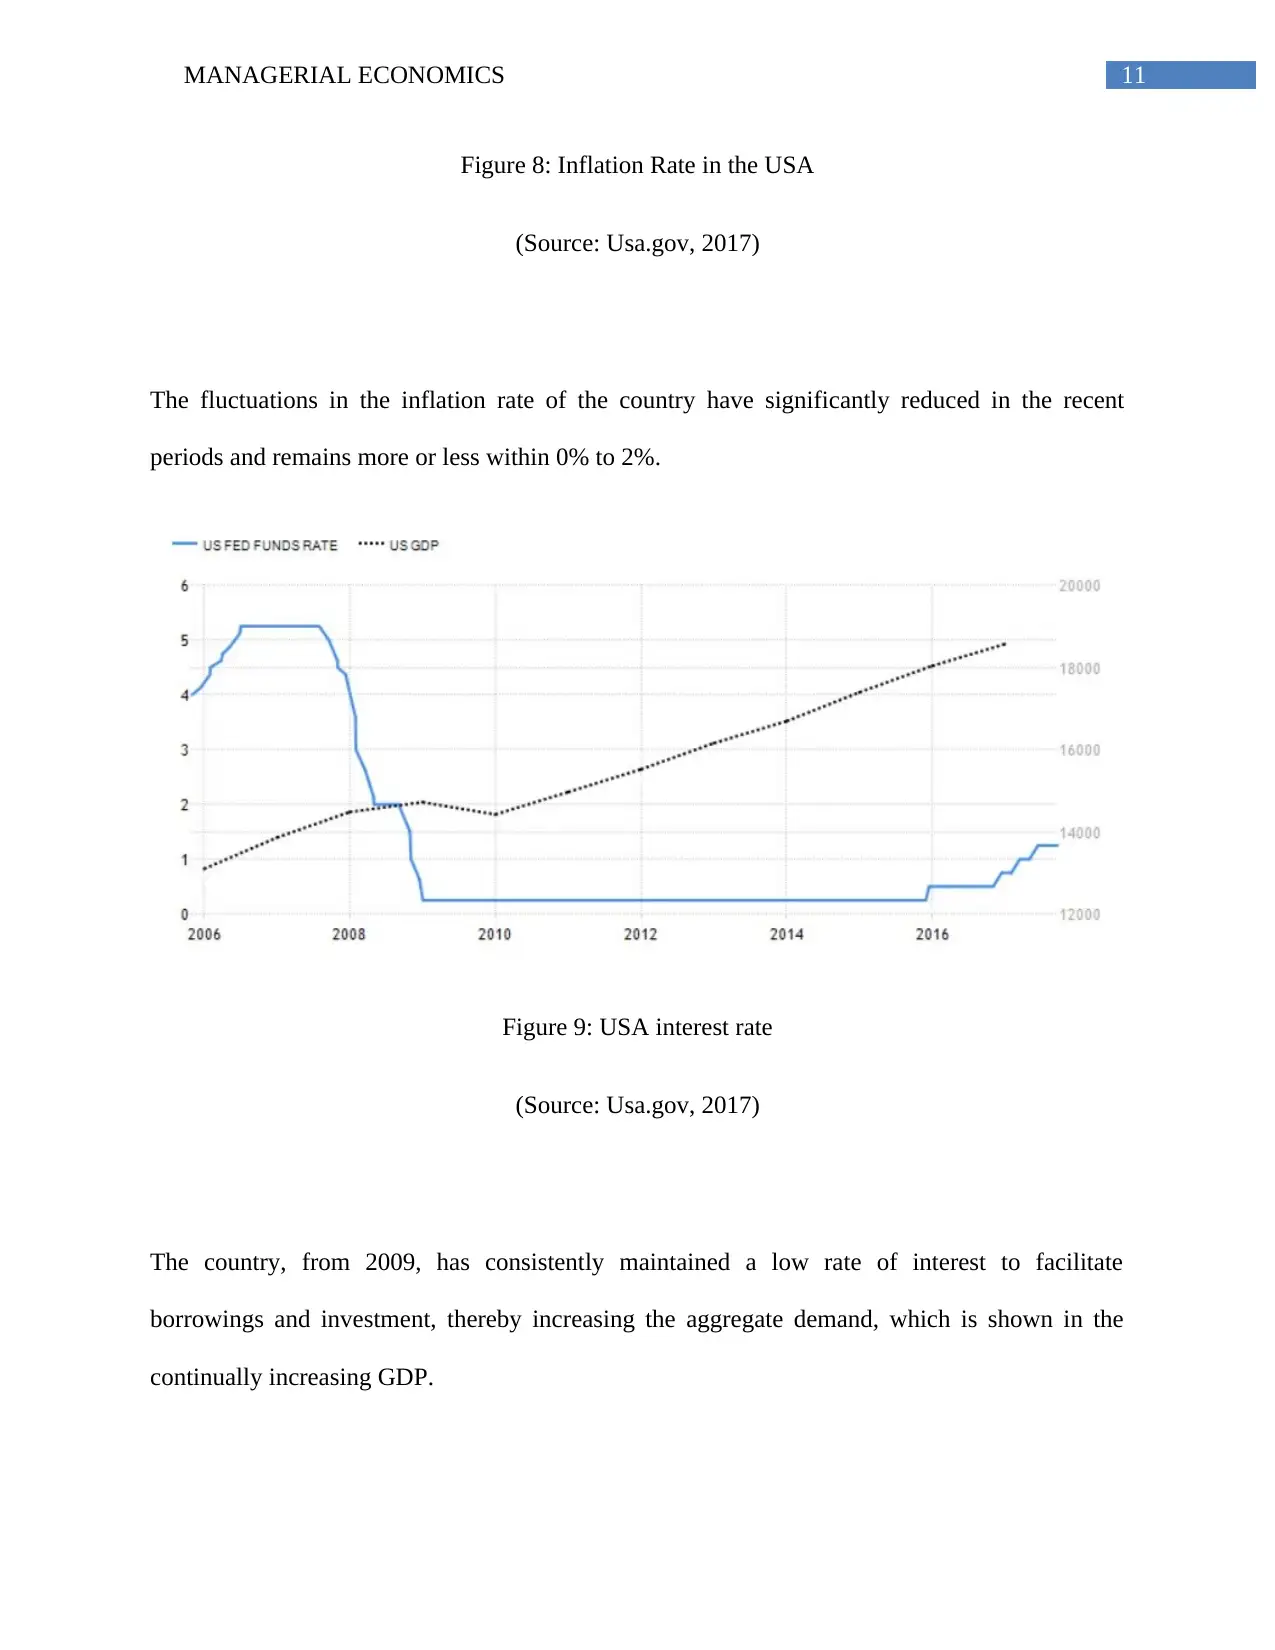
The 2007-08 Global Financial Crisis posed significant challenges globally, but Australia showcased resilience through effective economic policies. The crisis highlighted vulnerabilities within international trade, financial systems, and national economies. Australia's strategic response included fiscal stimuli to boost domestic demand, monetary easing for increased liquidity, and maintaining a robust regulatory framework to ensure financial stability. These measures were pivotal in sustaining economic growth amidst global downturns. The analysis delves into the impact of these policies on various sectors such as trade, finance, labor markets, and infrastructure, underscoring Australia's proactive approach. Furthermore, it compares Australia's strategies with those of other nations, illustrating its unique positioning during the crisis. Through strategic policy decisions and a focus on long-term economic stability, Australia not only weathered the immediate impacts but also laid the groundwork for future growth.

Running head: MANAGERIAL ECONOMICS
Managerial Economics
Name of the Student
Name of the University
Author Note
Managerial Economics
Name of the Student
Name of the University
Author Note
Paraphrase This Document
Need a fresh take? Get an instant paraphrase of this document with our AI Paraphraser

1MANAGERIAL ECONOMICS
Table of Contents
Answer 1:.........................................................................................................................................2
Part a:...........................................................................................................................................2
Part b:...........................................................................................................................................3
Part c:.........................................................................................................................................11
Part d:.........................................................................................................................................11
Answer 2:.......................................................................................................................................12
Part a:.........................................................................................................................................12
Part b:.........................................................................................................................................12
Part c:.........................................................................................................................................13
Answer 3:.......................................................................................................................................14
Part a:.........................................................................................................................................14
Part b:.........................................................................................................................................14
Answer 4:.......................................................................................................................................15
Part a:.........................................................................................................................................15
Part c:.........................................................................................................................................16
Part d:.........................................................................................................................................16
References......................................................................................................................................17

2MANAGERIAL ECONOMICS
⊘ This is a preview!⊘
Do you want full access?
Subscribe today to unlock all pages.

Trusted by 1+ million students worldwide

3MANAGERIAL ECONOMICS
The two countries chosen for the assignment are Australia and the United States of
America, both being two predominant economies of the world.
Answer 1:
Part a:
Both the USA and Australia being net importer of oils, the reduction in the global oil
prices are expected to have positive implications for the country. However, the decrease in the
same does effect the domestic producers adversely as they face a reduction in profits.
The devaluation of the domestic currencies helps both the concerned countries to increase
their exports while their imports become more costly. Increase in the currency value, however,
has the opposite effects.
High inflation in the country becomes hurting for the households. However, a controlled
increase in the inflation helps in increasing employment. Very low inflation on the other hand
implies that the productivities and aggregate demand are low.
Low interest rates facilitate investments and production in a country whereas high interest
rates encourages savings and therefore, this monetary tool is used according to the need of
economic growth of the country.
High industrial production in a country increases productivity as well as employment,
thereby leading to economic growth in a country.
Paraphrase This Document
Need a fresh take? Get an instant paraphrase of this document with our AI Paraphraser

4MANAGERIAL ECONOMICS
Part b:
1.
Figure 1: Oil prices (2005-2017)
(Source: Opec.org, 2017)
As can be seen from the above figure, the oil prices, which started increasing significantly in
2011 till 2014, reduced significantly in 2015 and continues to remain low.
Part b:
1.
Figure 1: Oil prices (2005-2017)
(Source: Opec.org, 2017)
As can be seen from the above figure, the oil prices, which started increasing significantly in
2011 till 2014, reduced significantly in 2015 and continues to remain low.

5MANAGERIAL ECONOMICS
Australia:
Figure 2: GDP of Australia
(Source: Abs.gov.au, 2017)
The GDP of the country kept on increasing consistently till 2013 before declining a little in the
current period.
Australia:
Figure 2: GDP of Australia
(Source: Abs.gov.au, 2017)
The GDP of the country kept on increasing consistently till 2013 before declining a little in the
current period.
⊘ This is a preview!⊘
Do you want full access?
Subscribe today to unlock all pages.

Trusted by 1+ million students worldwide

6MANAGERIAL ECONOMICS
Figure 3: Australia Industrial Production
(Source: Abs.gov.au, 2017)
Much of the dynamic in the growth of the economy can be attributed to the industrial production
over the years.
Figure 3: Australia Industrial Production
(Source: Abs.gov.au, 2017)
Much of the dynamic in the growth of the economy can be attributed to the industrial production
over the years.
Paraphrase This Document
Need a fresh take? Get an instant paraphrase of this document with our AI Paraphraser

7MANAGERIAL ECONOMICS
Figure 4: Inflation rate in Australia
(Source: Abs.gov.au, 2017)
The inflation rate of the country has decreased in the last few years, which is expected to reduce
the aggregate demand in the economy, as is reflected in the recent fall in the economy’s GDP
(Dyster & Meredith, 2012).
Figure 4: Inflation rate in Australia
(Source: Abs.gov.au, 2017)
The inflation rate of the country has decreased in the last few years, which is expected to reduce
the aggregate demand in the economy, as is reflected in the recent fall in the economy’s GDP
(Dyster & Meredith, 2012).

8MANAGERIAL ECONOMICS
Figure 5: Exchange rate in Australia
(Source: Abs.gov.au, 2017)
The country has significantly reduced its domestic currency value, to facilitate the growth in the
economy as can be seen by the increase in GDP in 2015.
Figure 5: Exchange rate in Australia
(Source: Abs.gov.au, 2017)
The country has significantly reduced its domestic currency value, to facilitate the growth in the
economy as can be seen by the increase in GDP in 2015.
⊘ This is a preview!⊘
Do you want full access?
Subscribe today to unlock all pages.

Trusted by 1+ million students worldwide

9MANAGERIAL ECONOMICS
Figure 5: Interest rate in Australia
(Source: Abs.gov.au, 2017)
The country has significantly decreased its interest rate from 2009, to increase investment and
productivity, which had positive implications on the country till 2013 as the GDP increased
consistently.
2005
2006
2007
2008
2009
2010
2011
2012
2013
2014
2015
2016
2017
0.000%
1.000%
2.000%
3.000%
4.000%
5.000%
6.000%
7.000%
Growth Rate, Inflation Rate, Interest Rate and
Change in Industral production of Australia
Growth Rate
Inflation Rate
Interest Rate
Industrial Production
Rate of change (%)
Figure 6: Comparison of all the indicators of Australia (2005-2017)
(Source: As created by the author with the help of data provided above)
Paraphrase This Document
Need a fresh take? Get an instant paraphrase of this document with our AI Paraphraser

10MANAGERIAL ECONOMICS
The USA:
Figure 7: GDP of the USA
(Source: Usa.gov, 2017)
The GDP of the country has continually increased from 2005 to 2017 and the reduction in the oil
prices can be considered as one of the contributing factors to the same (Bergsten & Gagnon,
2012).
The USA:
Figure 7: GDP of the USA
(Source: Usa.gov, 2017)
The GDP of the country has continually increased from 2005 to 2017 and the reduction in the oil
prices can be considered as one of the contributing factors to the same (Bergsten & Gagnon,
2012).

11MANAGERIAL ECONOMICS
Figure 8: Inflation Rate in the USA
(Source: Usa.gov, 2017)
The fluctuations in the inflation rate of the country have significantly reduced in the recent
periods and remains more or less within 0% to 2%.
Figure 9: USA interest rate
(Source: Usa.gov, 2017)
The country, from 2009, has consistently maintained a low rate of interest to facilitate
borrowings and investment, thereby increasing the aggregate demand, which is shown in the
continually increasing GDP.
⊘ This is a preview!⊘
Do you want full access?
Subscribe today to unlock all pages.

Trusted by 1+ million students worldwide
1 out of 22
Related Documents
Your All-in-One AI-Powered Toolkit for Academic Success.
+13062052269
info@desklib.com
Available 24*7 on WhatsApp / Email
Unlock your academic potential
Copyright © 2020–2025 A2Z Services. All Rights Reserved. Developed and managed by ZUCOL.


