Macroeconomics Report: Fiscal Performance of Australia Analysis
VerifiedAdded on 2021/06/14
|14
|2943
|38
Report
AI Summary
This report provides a comprehensive analysis of Australia's macroeconomic and fiscal performance. It begins by examining the fiscal performance of the Australian government, including trends in government spending and revenue, and the resulting budget balances. The report then delves into the factors influencing these trends, with a particular focus on the impact of the global financial crisis on the Australian economy. It explores the policy responses undertaken by the Australian government to mitigate the effects of the crisis. Furthermore, the report analyzes the implications of China's economic rise for Australia, including the effects of the mining boom and its subsequent end. Finally, it identifies the fiscal challenges faced by Australia, including ongoing budget deficits and the need for sustainable fiscal policies. The report uses figures and data to illustrate the points and provides a detailed overview of the fiscal landscape and economic challenges faced by Australia.
Running Head: MACROECONOMICS
Macroeconomics
Name of the Student
Name of the University
Course ID
Macroeconomics
Name of the Student
Name of the University
Course ID
Paraphrase This Document
Need a fresh take? Get an instant paraphrase of this document with our AI Paraphraser
1MACROECONOMICS
Table of Contents
Fiscal performance of Australia.......................................................................................................2
Factors explaining trend in fiscal performance...............................................................................3
Global financial crisis and impact on Australian economy.........................................................3
The Australian policy responses to global financial crisis..........................................................5
Rise of China and implication for Australia................................................................................6
End of mining boom and post mining transition.........................................................................7
Fiscal challenges faced by Australia................................................................................................8
Reference list.................................................................................................................................11
2MACROECONOMICS
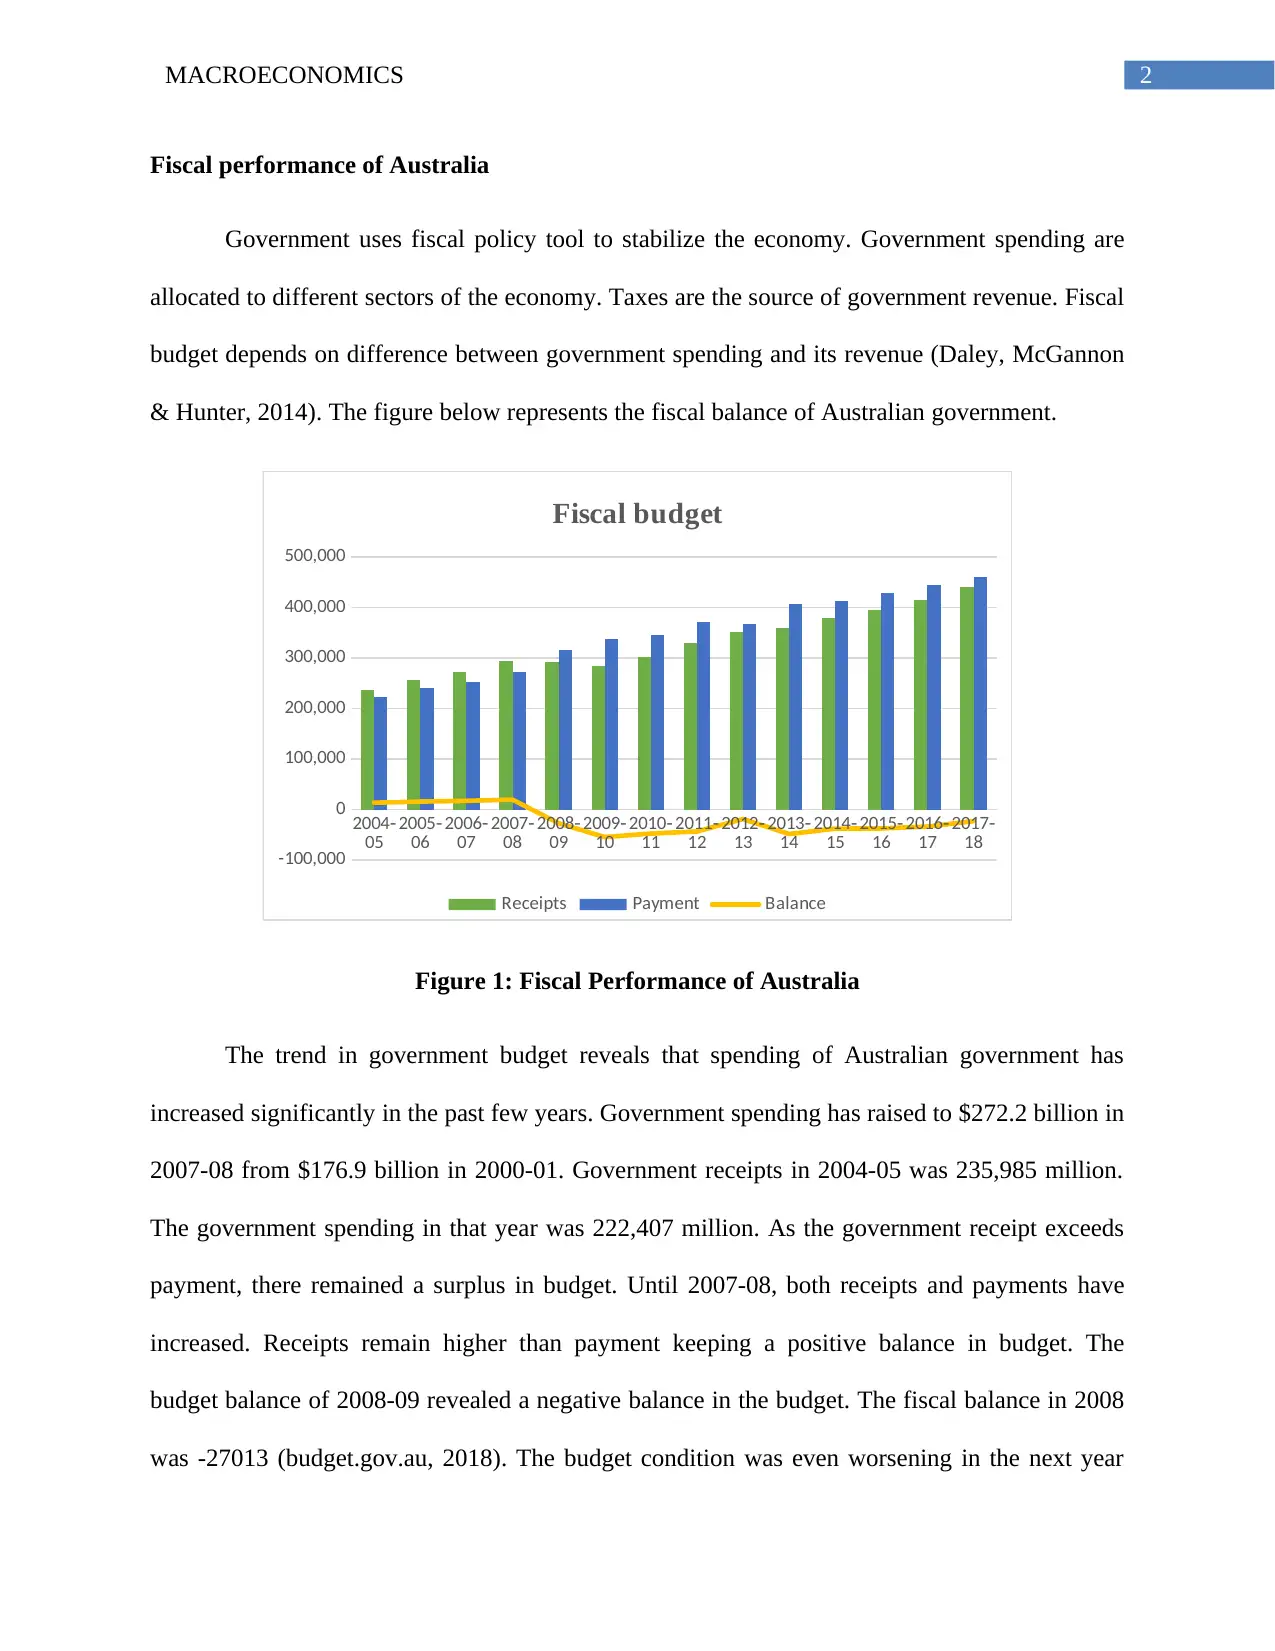
Fiscal performance of Australia
Government uses fiscal policy tool to stabilize the economy. Government spending are
allocated to different sectors of the economy. Taxes are the source of government revenue. Fiscal
budget depends on difference between government spending and its revenue (Daley, McGannon
& Hunter, 2014). The figure below represents the fiscal balance of Australian government.
2004‑
05 2005‑
06 2006‑
07 2007‑
08 2008‑
09 2009‑
10 2010‑
11 2011‑
12 2012‑
13 2013‑
14 2014‑
15 2015‑
16 2016‑
17 2017‑
18
-100,000
0
100,000
200,000
300,000
400,000
500,000
Fiscal budget
Receipts Payment Balance
Figure 1: Fiscal Performance of Australia
The trend in government budget reveals that spending of Australian government has
increased significantly in the past few years. Government spending has raised to $272.2 billion in
2007-08 from $176.9 billion in 2000-01. Government receipts in 2004-05 was 235,985 million.
The government spending in that year was 222,407 million. As the government receipt exceeds
payment, there remained a surplus in budget. Until 2007-08, both receipts and payments have
increased. Receipts remain higher than payment keeping a positive balance in budget. The
budget balance of 2008-09 revealed a negative balance in the budget. The fiscal balance in 2008
was -27013 (budget.gov.au, 2018). The budget condition was even worsening in the next year
⊘ This is a preview!⊘
Do you want full access?
Subscribe today to unlock all pages.
Trusted by 1+ million students worldwide
3MACROECONOMICS
(Chohan, 2017). Government spending rose to 336,900 million dollars while receipts were
284,662 million dollars. The fiscal budget turned to -54,494 during that year. The principle factor
contributing to an increase in government spending during this time was the hit of global
financial crisis. In the next three years’ fiscal balance though remain negative but marks some
improvement with a decline in budget deficit from 54,494 in 2009-10 to -18,834 in 2012-13. A
drastic fall in budget deficit was observed in the fiscal year of 2012-13 when deficit declined
from 43,360 million to 18,834 million (budget.gov.au, 2018).
The deficit aggravates in the next year where deficit jumped to 48,456 in 2013-14.
Despite increases in receipts, Australian government is still running with s deficit budget.
Estimated deficit in 2016-17 was 33,667.
Factors explaining trend in fiscal performance
Global financial crisis and impact on Australian economy
The trend in fiscal performance reveals that the economy is facing a deficit budget in the
last few years. After experiencing a budget surplus until the financial year of 2007-08,
government’s fiscal balance has turned negative (Cordes et al., 2015) This is the time when
global economy experienced recessionary pressure of global financial crisis.
The sub-prime mortgage crisis developed in United States from the middle of 2007 led
the financial institutions to lose their confidence of lending to each other. The resulted loss of
confidence created a credit crunch throughout 2008. The interrupted supply of credit and
liquidity to the financial institution weakened the financial market (Vlaicu et al., 2016). In
response to the crisis, household and businesses were gradually drying up with a wide gap in
interbank lending. During this time, the estimated spread, explaining differential between US
Paraphrase This Document
Need a fresh take? Get an instant paraphrase of this document with our AI Paraphraser
4MACROECONOMICS
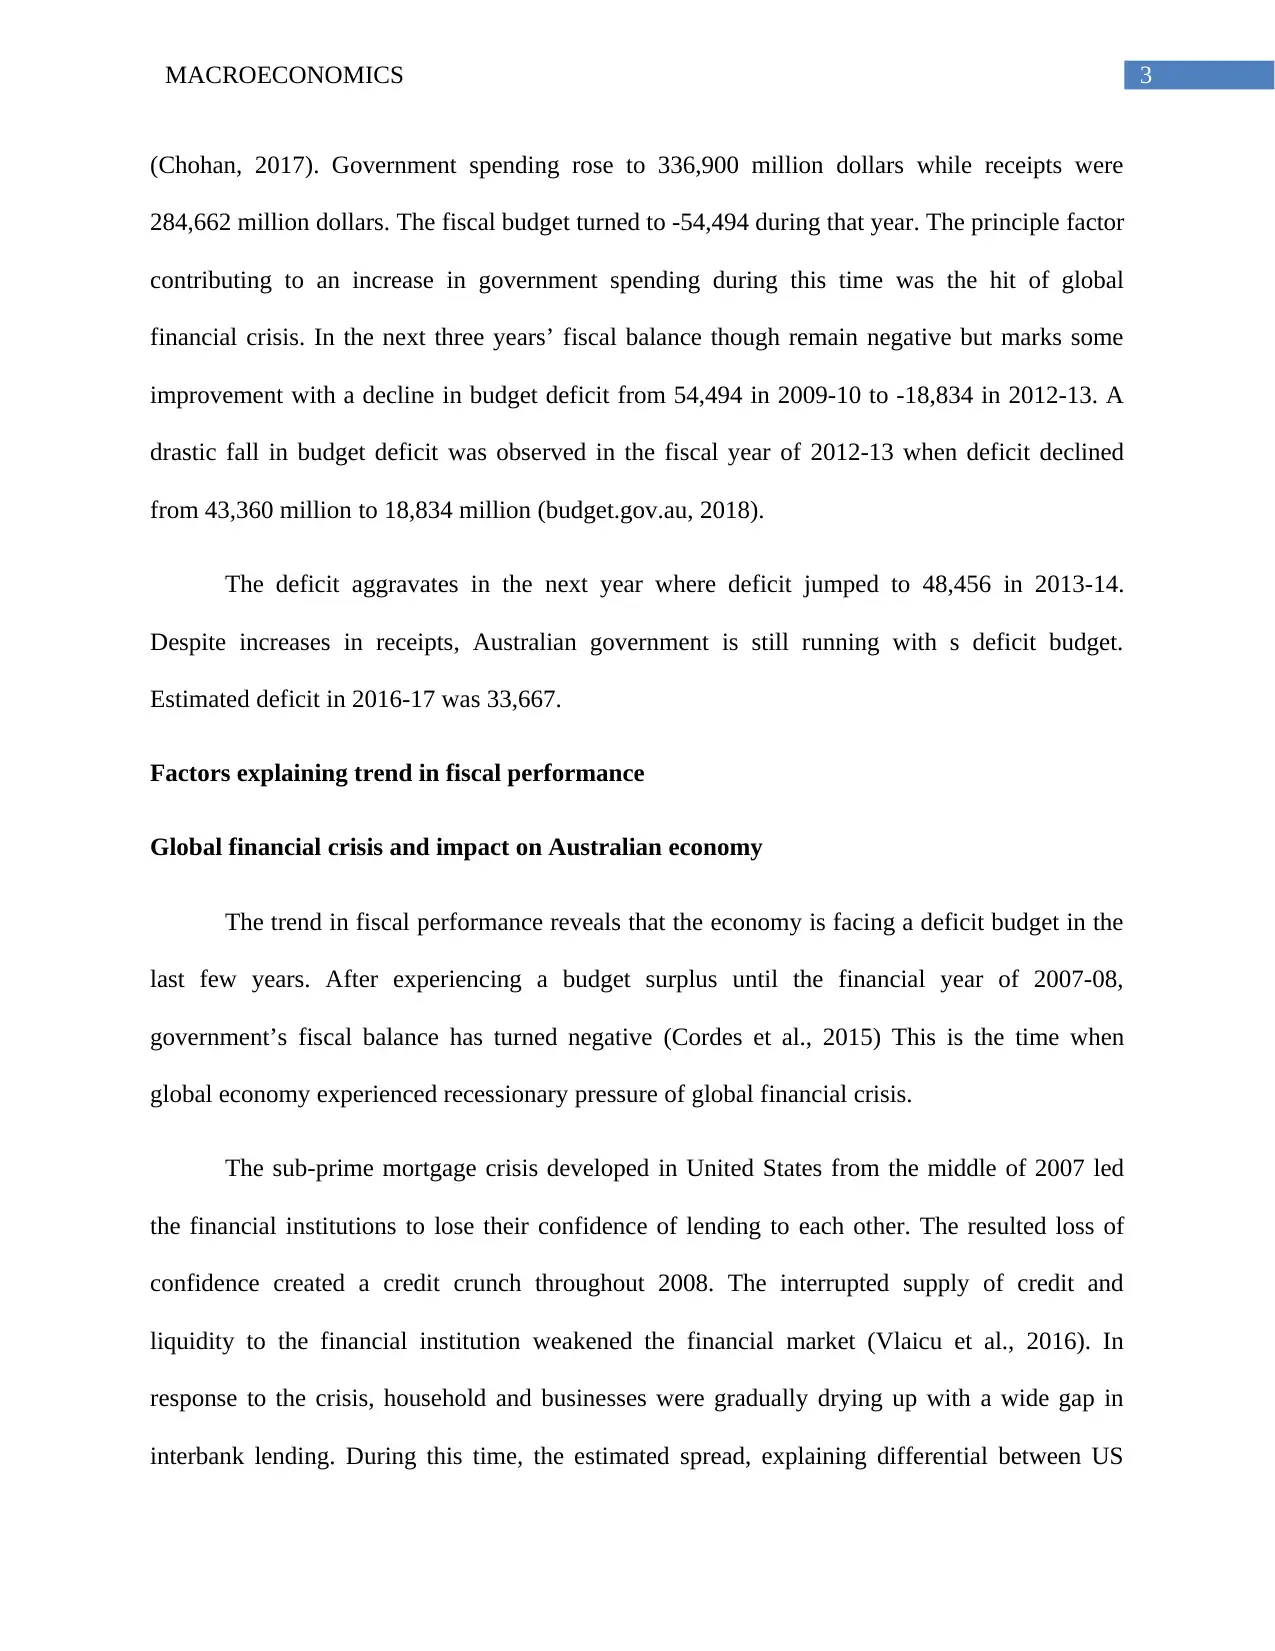
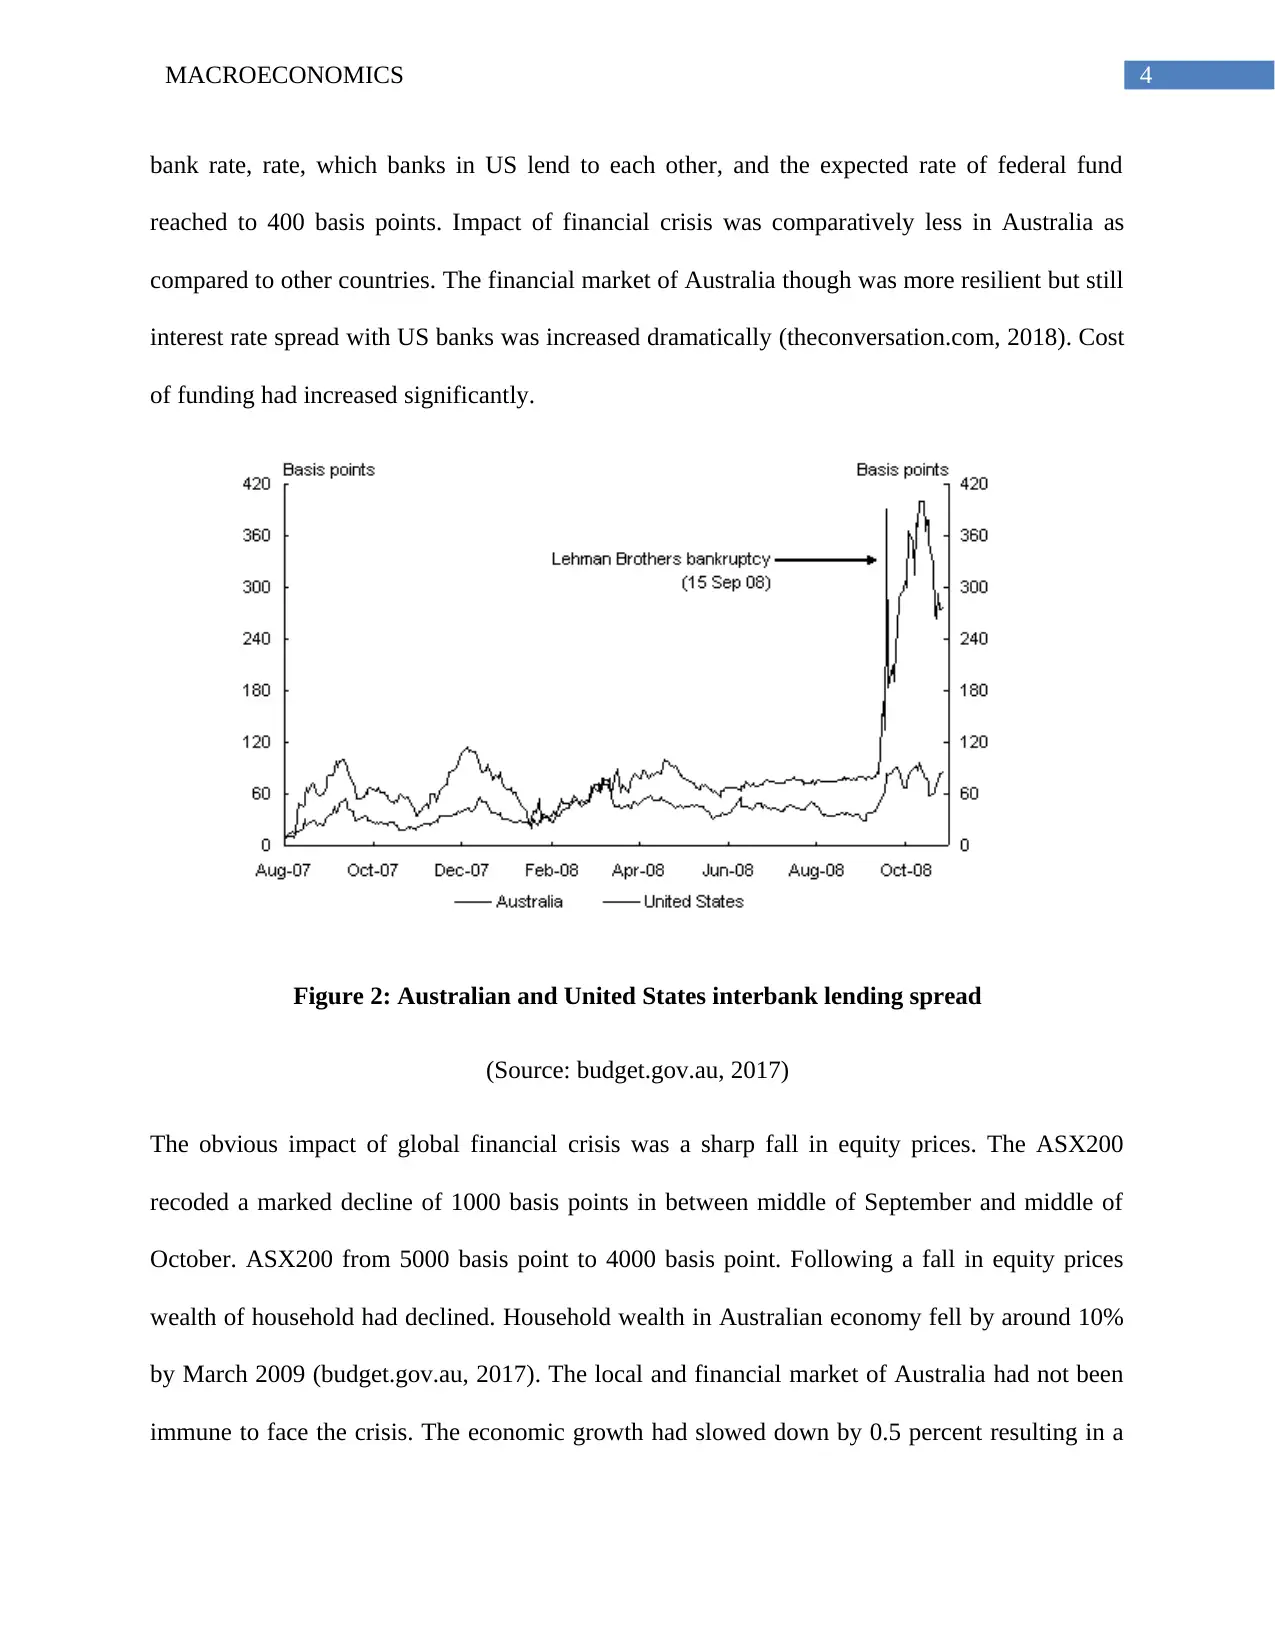
bank rate, rate, which banks in US lend to each other, and the expected rate of federal fund
reached to 400 basis points. Impact of financial crisis was comparatively less in Australia as
compared to other countries. The financial market of Australia though was more resilient but still
interest rate spread with US banks was increased dramatically (theconversation.com, 2018). Cost
of funding had increased significantly.
Figure 2: Australian and United States interbank lending spread
(Source: budget.gov.au, 2017)
The obvious impact of global financial crisis was a sharp fall in equity prices. The ASX200
recoded a marked decline of 1000 basis points in between middle of September and middle of
October. ASX200 from 5000 basis point to 4000 basis point. Following a fall in equity prices
wealth of household had declined. Household wealth in Australian economy fell by around 10%
by March 2009 (budget.gov.au, 2017). The local and financial market of Australia had not been
immune to face the crisis. The economic growth had slowed down by 0.5 percent resulting in a
5MACROECONOMICS
rise in unemployment rate by two percentages point. The recorded unemployment rate by
November 2009 was 5.75 percent. As the crisis intensified, the value of Australian deprecated
considerably. The global financial crisis had a considerable impact on government budget
(Debrun & Kinda, 2017). Because of global financial crisis and worsening condition in the
global market, government revenue had been revised downward. Expenses rose particularly from
2009-2010. Expenses increased following a global slow-down.
The Australian policy responses to global financial crisis
Fiscal budget in the year 2008-09 was struck in a complex situation between controlling
inflation and adjust the risk posed from global turmoil. Government in order to tackle
perpetuating global risk initially strengthened its financial position using automatic stabilizers a
building a buffer government surplus. The policy aimed to provide government a greater
flexibility to undertake future policy action. Government extended its support to household by
cutting tax or making payment to pensioners. The Reserve Bank of Australia had taken measures
to stabilize economic growth along with achieving financial stability (Vanstone & Hahn, 2017).
The drastic change in macroeconomic outlook required the government to undertake proactive
policy measures to rescue the shield Australian economy from financial crisis. On 20th May,
government announced the decision to raise government securities by an upper limit of $25
billion. The cash surplus of Australian government in 2008-09 was stood at $5.4 billion, a
surplus lower by $16.3 billion of 2008-09 estimates. The fiscal outlook was severely impacted
from global financial crisis and associated and weak state of global economy. In the phase of
recession, the cash and fiscal balance reduced significantly. There was a downward revision in
taxation during by $5 billion in 2008-09 and that of $12 billion in 2009-2010. The fiscal stimulus
given to the economy resulted in a significant reduction in cash balance. Government receipts in
⊘ This is a preview!⊘
Do you want full access?
Subscribe today to unlock all pages.
Trusted by 1+ million students worldwide
6MACROECONOMICS
2009-10 was 284.662 million. As against this, spending was 336, 900 (budget.gov.au, 2018). The
size of government deficit was 54,494, the highest deficit ever since the last twelve years.
Rise of China and implication for Australia
Rise of developing countries like China provides Australia an opportunity to exploit its
comparative advantage over natural resources and other high-end goods and services. A
complementary relation exists between net export of Australia and that of China. China exports
manufacturing goods while import raw materials. The position of Australian trade is opposite for
these two categories. The rising demand of resources from China improved terms of trade of
Australia. The Australian economy has experienced a sharp in the relative price of its export. The
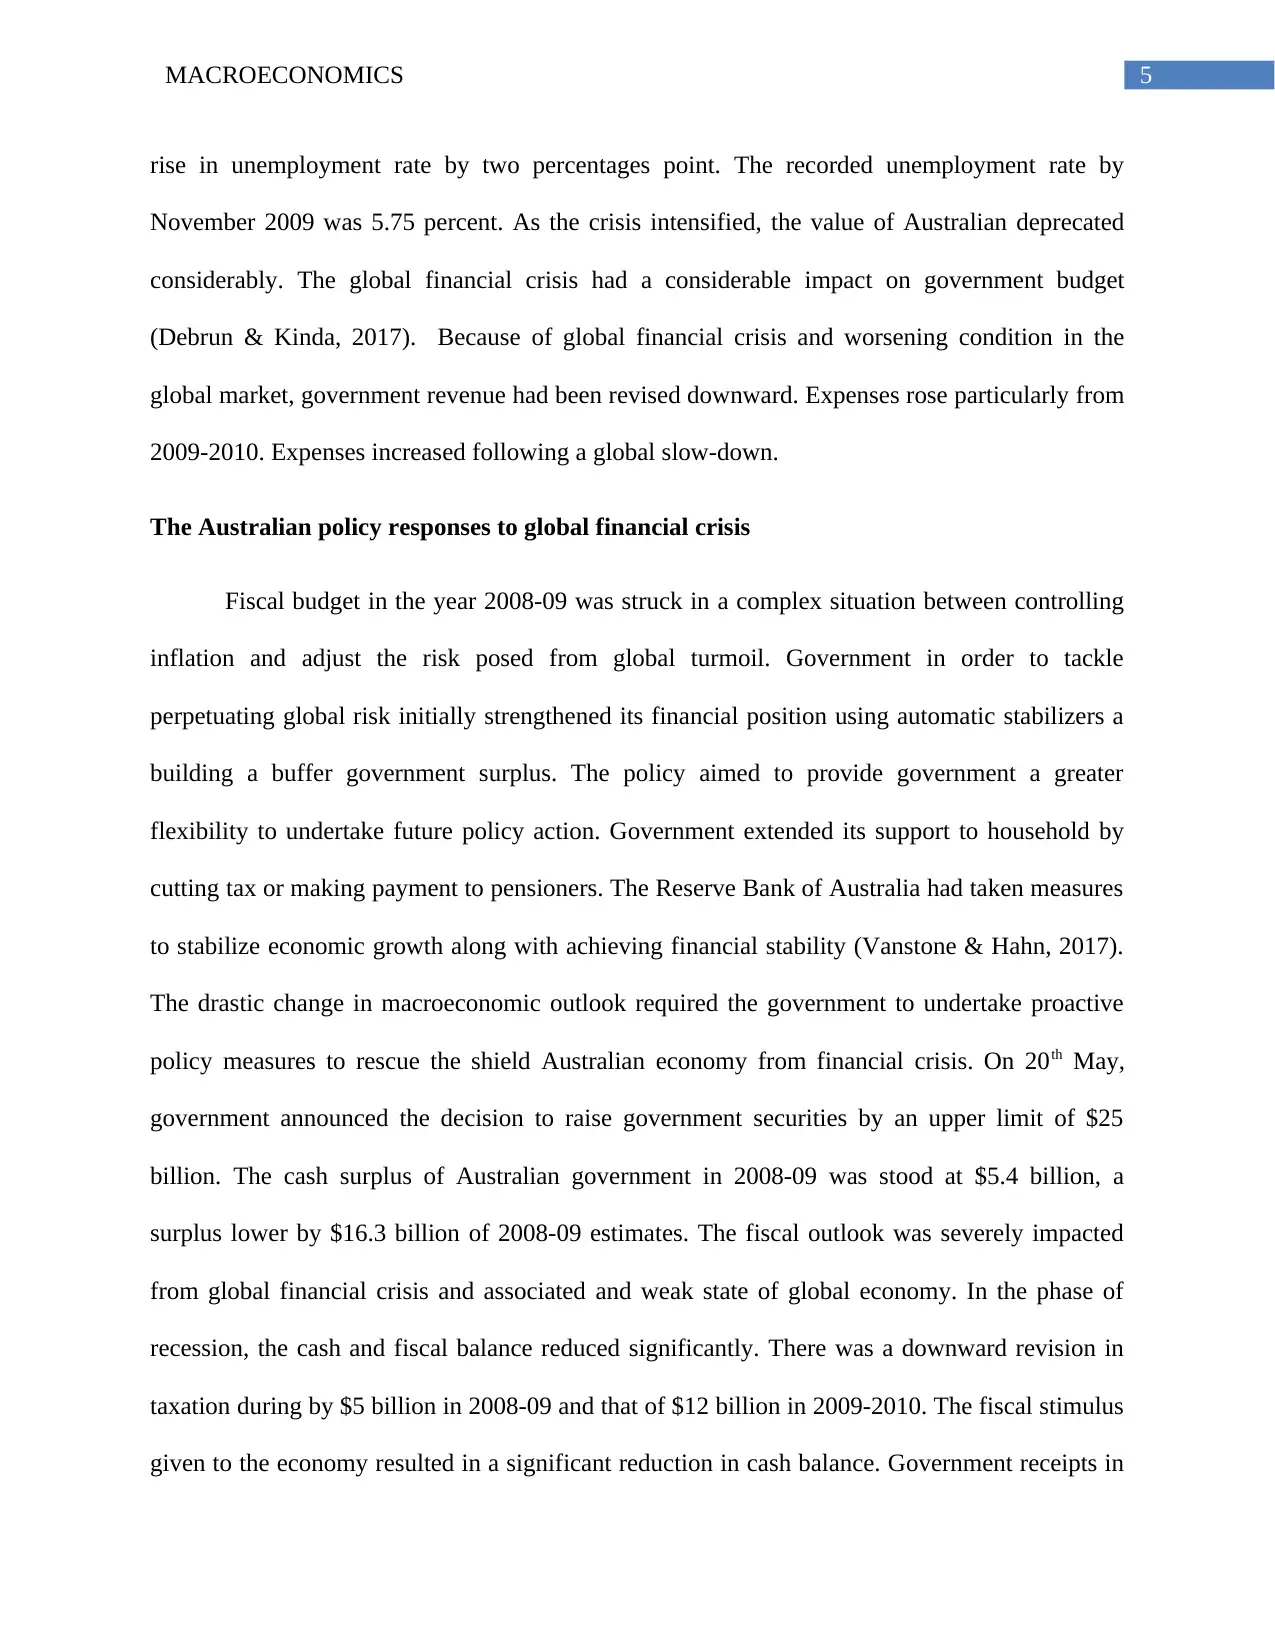
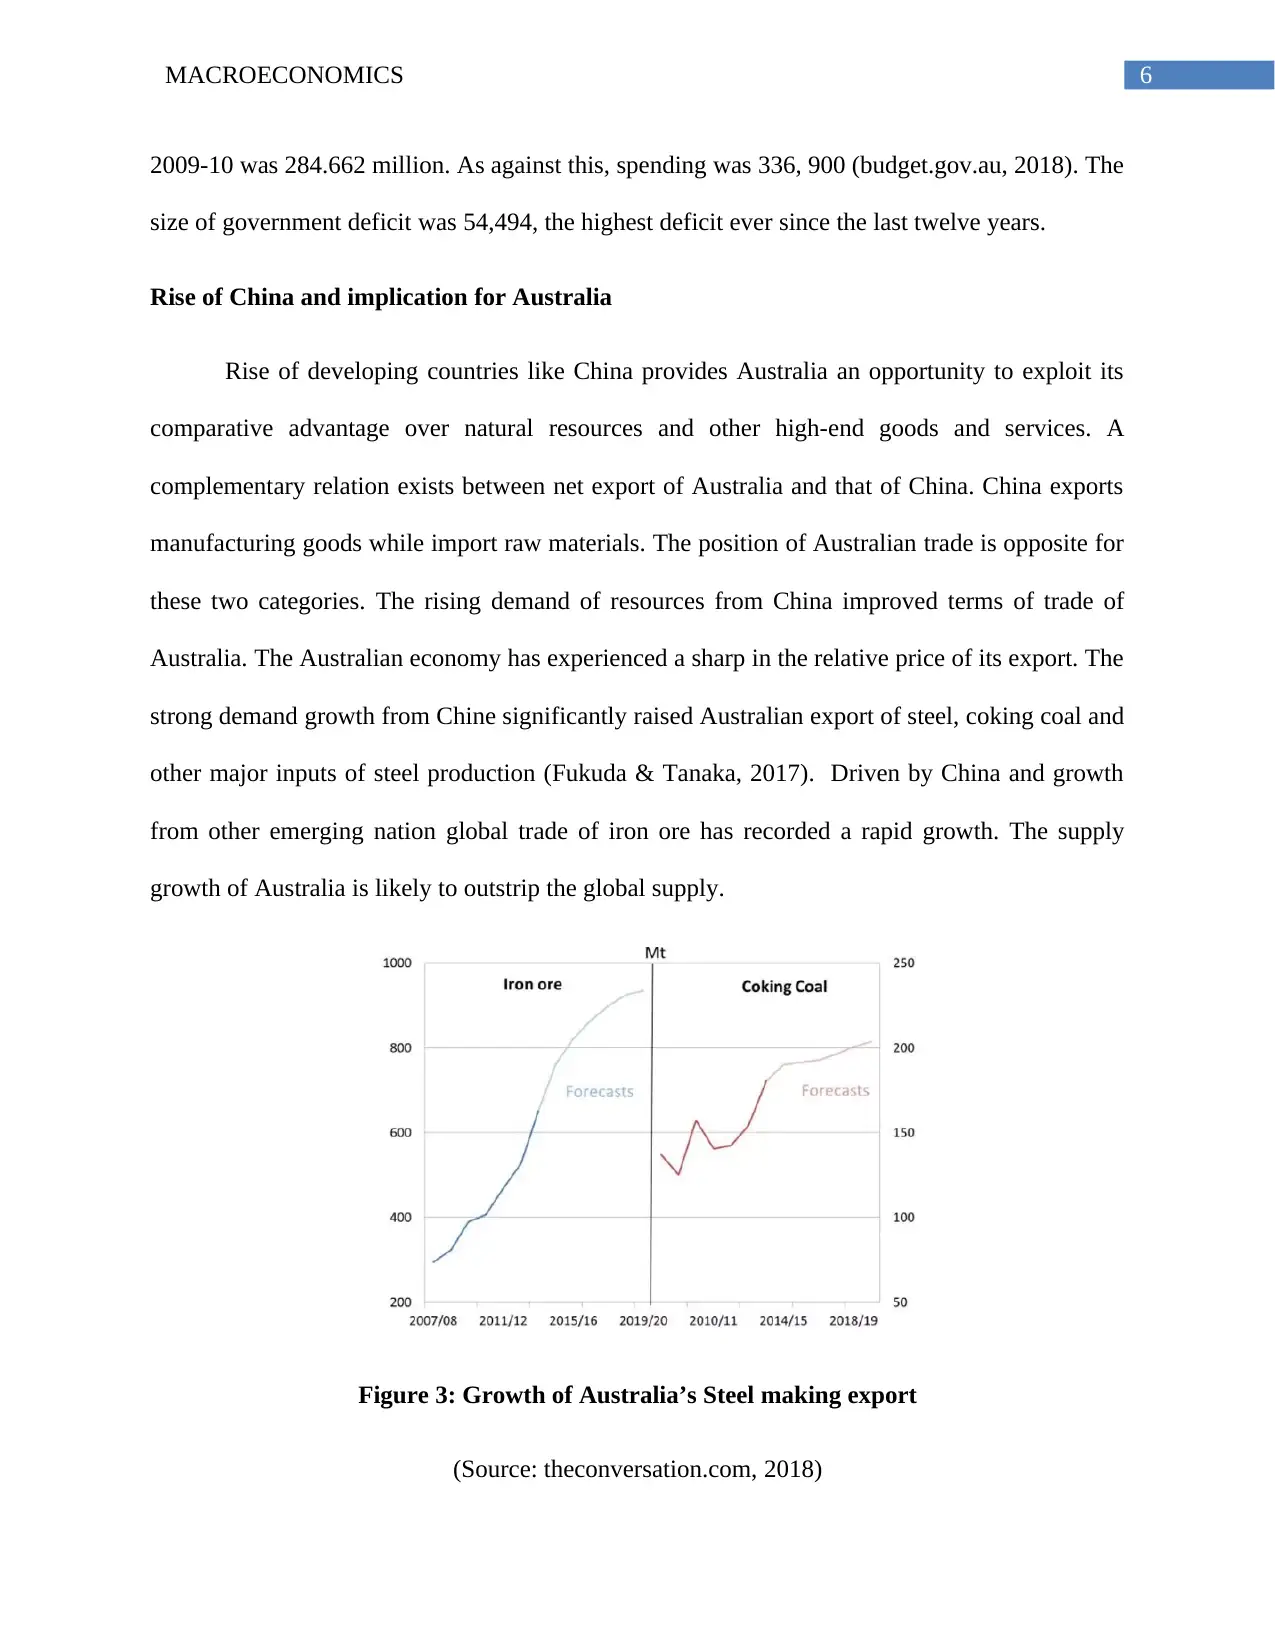
strong demand growth from Chine significantly raised Australian export of steel, coking coal and
other major inputs of steel production (Fukuda & Tanaka, 2017). Driven by China and growth
from other emerging nation global trade of iron ore has recorded a rapid growth. The supply
growth of Australia is likely to outstrip the global supply.
Figure 3: Growth of Australia’s Steel making export
(Source: theconversation.com, 2018)
2009-10 was 284.662 million. As against this, spending was 336, 900 (budget.gov.au, 2018). The
size of government deficit was 54,494, the highest deficit ever since the last twelve years.
Rise of China and implication for Australia
Rise of developing countries like China provides Australia an opportunity to exploit its
comparative advantage over natural resources and other high-end goods and services. A
complementary relation exists between net export of Australia and that of China. China exports
manufacturing goods while import raw materials. The position of Australian trade is opposite for
these two categories. The rising demand of resources from China improved terms of trade of
Australia. The Australian economy has experienced a sharp in the relative price of its export. The
strong demand growth from Chine significantly raised Australian export of steel, coking coal and
other major inputs of steel production (Fukuda & Tanaka, 2017). Driven by China and growth
from other emerging nation global trade of iron ore has recorded a rapid growth. The supply
growth of Australia is likely to outstrip the global supply.
Figure 3: Growth of Australia’s Steel making export
(Source: theconversation.com, 2018)
Paraphrase This Document
Need a fresh take? Get an instant paraphrase of this document with our AI Paraphraser
7MACROECONOMICS
The slow-down of China’s growth affects Australian economy. Production of crude steel in
China has lowered this year as compared to that in the previous year. With this the terms of trade
have been affected significantly. This has obvious implication for government revenue. The most
direct channel is the company tax receipts. With China’s slow down, profitability of exporting
companies has reduced. The reduces tax revenue collected through corporate profit tax and other
forms of taxation. However, China has now entered to a new phase of economic growth known
as new normal growth (Albinski, 2015). This is expected to recover the lost goods and service
demand from Australia making a positive contribution to government budget.
End of mining boom and post mining transition
China has gradually shifted its growth rate towards a consume driven economic growth
from earlier investment driven growth. The economic transition of China is likely to bring
opportunities for Australia. The process of transition however is not smooth. The slower than
expected growth rate imposes a potential risk for Australian economy. The direct channel is
through the merchandise trade (Jain & McCarthy, 2016). The mining sector in Australia had hurt
hard. In the phase of global headwind, the Australian economy has made its own transition.
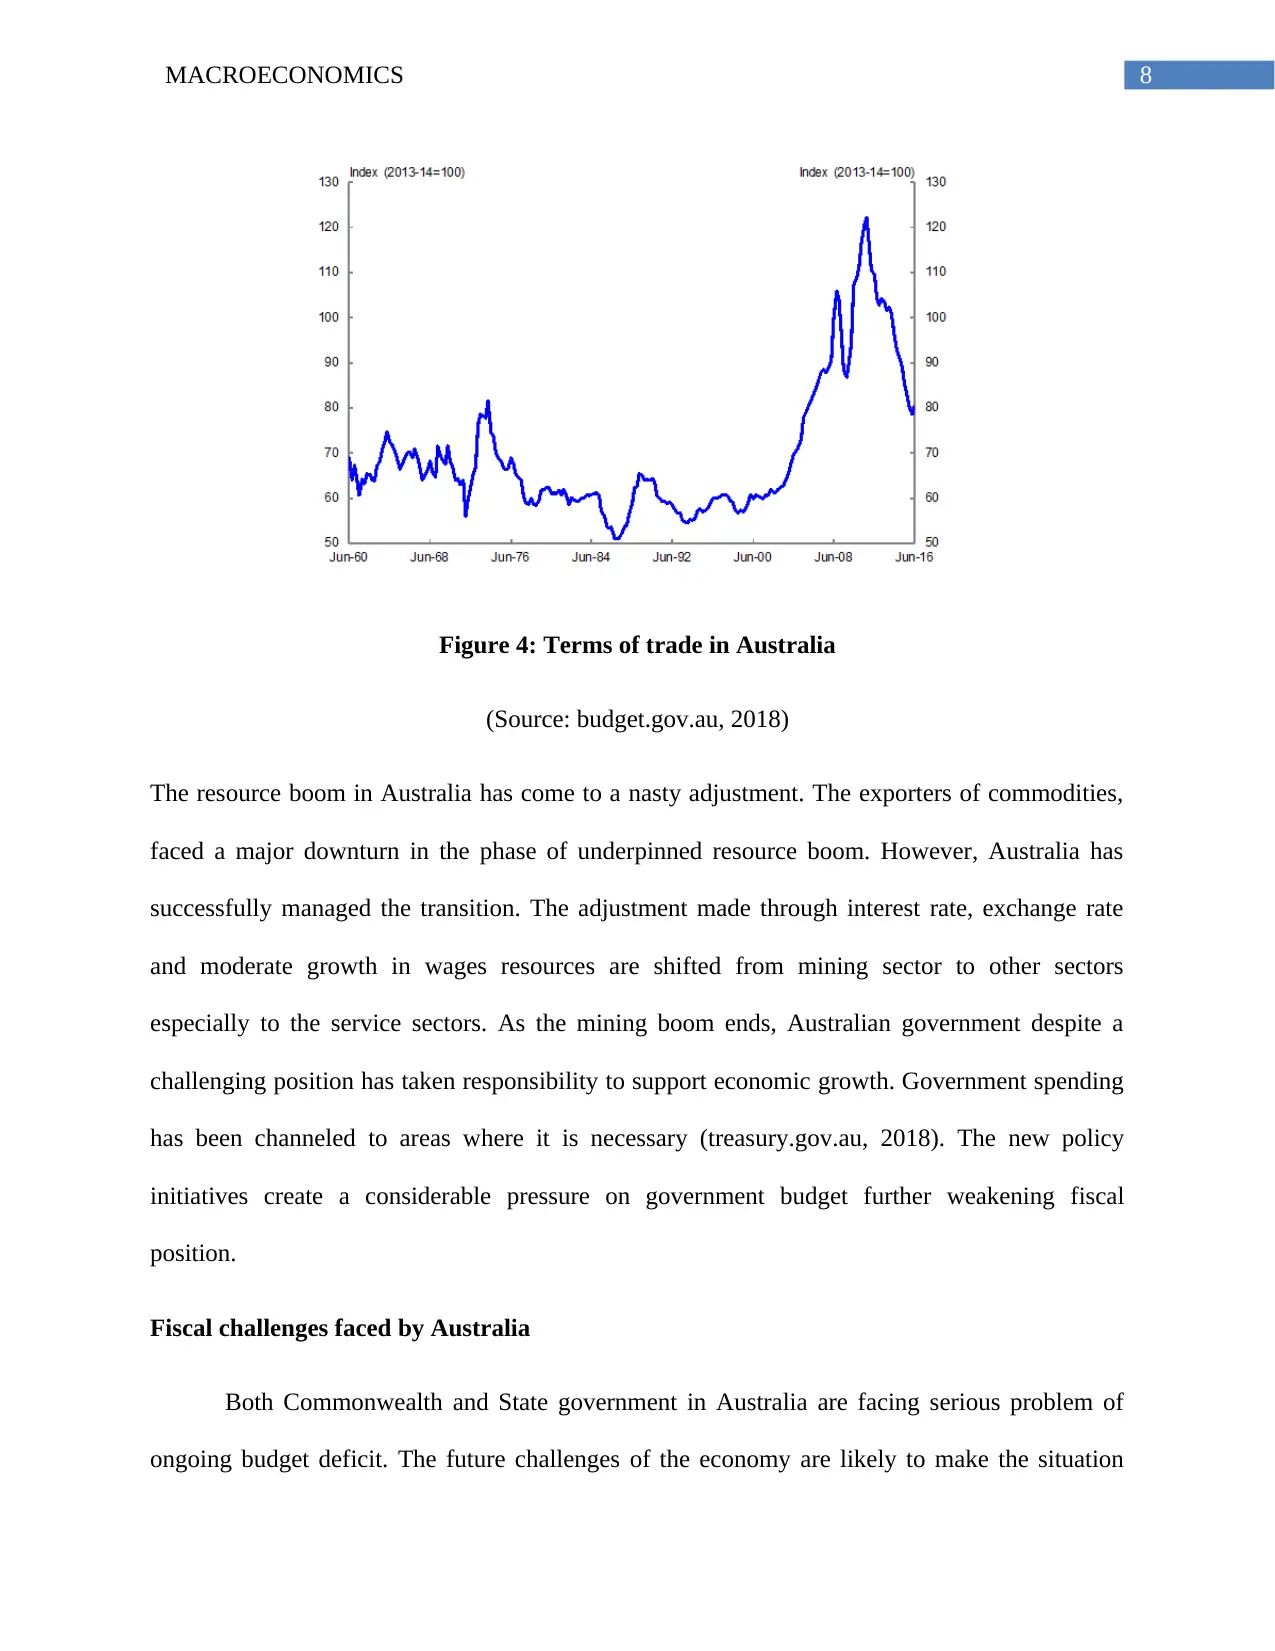
Terms of trade that reached to its peak in 2011, has fallen sharply by a third. This undermined
the development of mining commodity prices.
The slow-down of China’s growth affects Australian economy. Production of crude steel in
China has lowered this year as compared to that in the previous year. With this the terms of trade
have been affected significantly. This has obvious implication for government revenue. The most
direct channel is the company tax receipts. With China’s slow down, profitability of exporting
companies has reduced. The reduces tax revenue collected through corporate profit tax and other
forms of taxation. However, China has now entered to a new phase of economic growth known
as new normal growth (Albinski, 2015). This is expected to recover the lost goods and service
demand from Australia making a positive contribution to government budget.
End of mining boom and post mining transition
China has gradually shifted its growth rate towards a consume driven economic growth
from earlier investment driven growth. The economic transition of China is likely to bring
opportunities for Australia. The process of transition however is not smooth. The slower than
expected growth rate imposes a potential risk for Australian economy. The direct channel is
through the merchandise trade (Jain & McCarthy, 2016). The mining sector in Australia had hurt
hard. In the phase of global headwind, the Australian economy has made its own transition.
Terms of trade that reached to its peak in 2011, has fallen sharply by a third. This undermined
the development of mining commodity prices.
8MACROECONOMICS
Figure 4: Terms of trade in Australia
(Source: budget.gov.au, 2018)
The resource boom in Australia has come to a nasty adjustment. The exporters of commodities,
faced a major downturn in the phase of underpinned resource boom. However, Australia has
successfully managed the transition. The adjustment made through interest rate, exchange rate
and moderate growth in wages resources are shifted from mining sector to other sectors
especially to the service sectors. As the mining boom ends, Australian government despite a
challenging position has taken responsibility to support economic growth. Government spending
has been channeled to areas where it is necessary (treasury.gov.au, 2018). The new policy
initiatives create a considerable pressure on government budget further weakening fiscal
position.
Fiscal challenges faced by Australia
Both Commonwealth and State government in Australia are facing serious problem of
ongoing budget deficit. The future challenges of the economy are likely to make the situation
⊘ This is a preview!⊘
Do you want full access?
Subscribe today to unlock all pages.
Trusted by 1+ million students worldwide
9MACROECONOMICS
worsens than ever. The deteriorating terms of trade and a lower nominal growth is expected frags
government revenue. Government expenditure on improving status of health and infrastructure is
growing at a rate faster than GDP. Revenues of state government are affected from the decision
of Commonwealth government regarding grants and other assistance. Short term and medium
terms projection depends on the optimistic assumption towards organic growth of revenue and
constraint on spending (rba.gov.au, 2014). At the current stage, a budget surplus seems unlikely
to occur. In order to restore sustainability in budget Australian government needs to take some
politically difficult decision. The focus towards restraining spending is though required but the
strategy of budget repair and size of gap in budget implies that it is not possible to attain balance
budget without stimulating revenues.
It is nine years since global financial crisis that Commonwealth government is running
with a deficit in budget. The following years have been projected to be more difficult for the
government in the phase of falling terms of trade and decline is commodity price following end
of the resource boom. The resulted reduction of tax and other source of government revenue has
made a significant reduction in government revenue. The demand for fund on the other hand has
substantially increase in order to fund new policy initiatives taken to revitalize the economy. The
government however has not acknowledged yet the size and scale of fiscal challenges. The major
political parties are in hope that successful economic transition of Australia will improve
economic resulting in a budget surplus (theguardian.com, 2018). Over the past few years,
revenue growth is smaller than that has been projected. Severe pressures have also been realized
in State budget. The major areas of spending for State budget are health and education. The
revenues of state governments have been threatened as Commonwealth government in order to
Paraphrase This Document
Need a fresh take? Get an instant paraphrase of this document with our AI Paraphraser
10MACROECONOMICS
reduce some of its burden has reduced transfer of funds to the state government given for
supporting spending on schools and hospitals.
Based upon the previous projection Australia is now moving on a track of systematic
budget deficit till 2019. The persistent budget deficits have contributed towards economic
activity with a minimization of unemployment rate. The structural deficit in Commonwealth
budget is less defensible. The structural budget deficit has remained 2 percent of GDP in the past
five years (treasury.gov.au, 2018). The headline and structural deficits resulted from prevalence
of both lower revenue and higher spending.
Government revenue raises sharply after 2010-11. The rising trend in revenue however
has not brought by fiscal policy changes. During this time a budget repair policy was designed
by Abbott government though re-indexation of fuel exercise duty in line with inflation. The
government at the same time lost some of the revenue stream because of elimination of mining
and carbon taxes. The biggest contributor of a fiscal drag is the growth in collection of income
tax. This has accounted for most part of the budget repair (Daley, McGannon & Hunter, 2014).
The tough situation of Commonwealth Government is expected to continue if the sluggish
economic growth persists in future. The government budget need to find new room for funding
the new spending.
11MACROECONOMICS
Reference list
Albinski, H. S. (2015). Australian policies and attitudes toward China. Princeton University
Press. (Accessed from: https://books.google.co.in/books?
id=zwTWCgAAQBAJ&printsec=frontcover&source=gbs_ViewAPI&redir_esc=y#v=one
page&q&f=false)
Appendix D: Historical Australian Government Data. (2018). Retrieved from
https://www.budget.gov.au/2015-16/content/myefo/html/16_appendix_d.htm (Accessed
from: https://www.budget.gov.au/2015-16/content/myefo/html/16_appendix_d.htm)
Australian governments face a decade of budget deficits. (2018). Retrieved from
https://theconversation.com/australian-governments-face-a-decade-of-budget-deficits-
13616 (Accessed from: https://theconversation.com/australian-governments-face-a-
decade-of-budget-deficits-13616)
Budget 2016-17 - Budget overview. (2018). Retrieved from https://www.budget.gov.au/2016-
17/content/glossies/overview/html/overview-01.htm (Accessed from:
https://www.budget.gov.au/2016-17/content/glossies/overview/html/overview-01.htm)
Budget explainer: the forces influencing Australia's economy. (2018). Retrieved from
https://theconversation.com/budget-explainer-the-forces-influencing-australias-economy-
41161 (Accesed from: https://theconversation.com/budget-explainer-the-forces-
influencing-australias-economy-41161)
Chohan, U. W. (2017). What is a Charter of Budget Honesty? The Case of Australia. Revue
Parlementaire Canadienne, 40(1). (Accesed from:
http://revparl.ca/40/1/40n1e_17_Chohan.pdf)
⊘ This is a preview!⊘
Do you want full access?
Subscribe today to unlock all pages.
Trusted by 1+ million students worldwide
1 out of 14
Related Documents


Your All-in-One AI-Powered Toolkit for Academic Success.
+13062052269
info@desklib.com
Available 24*7 on WhatsApp / Email
![[object Object]](/_next/static/media/star-bottom.7253800d.svg)
Unlock your academic potential
Copyright © 2020–2026 A2Z Services. All Rights Reserved. Developed and managed by ZUCOL.