Comprehensive Economic Analysis: Australia's GDP and Trade Dynamics

Verified

Added on  2020/12/18

|21
|4053
|448
Report
AI Summary
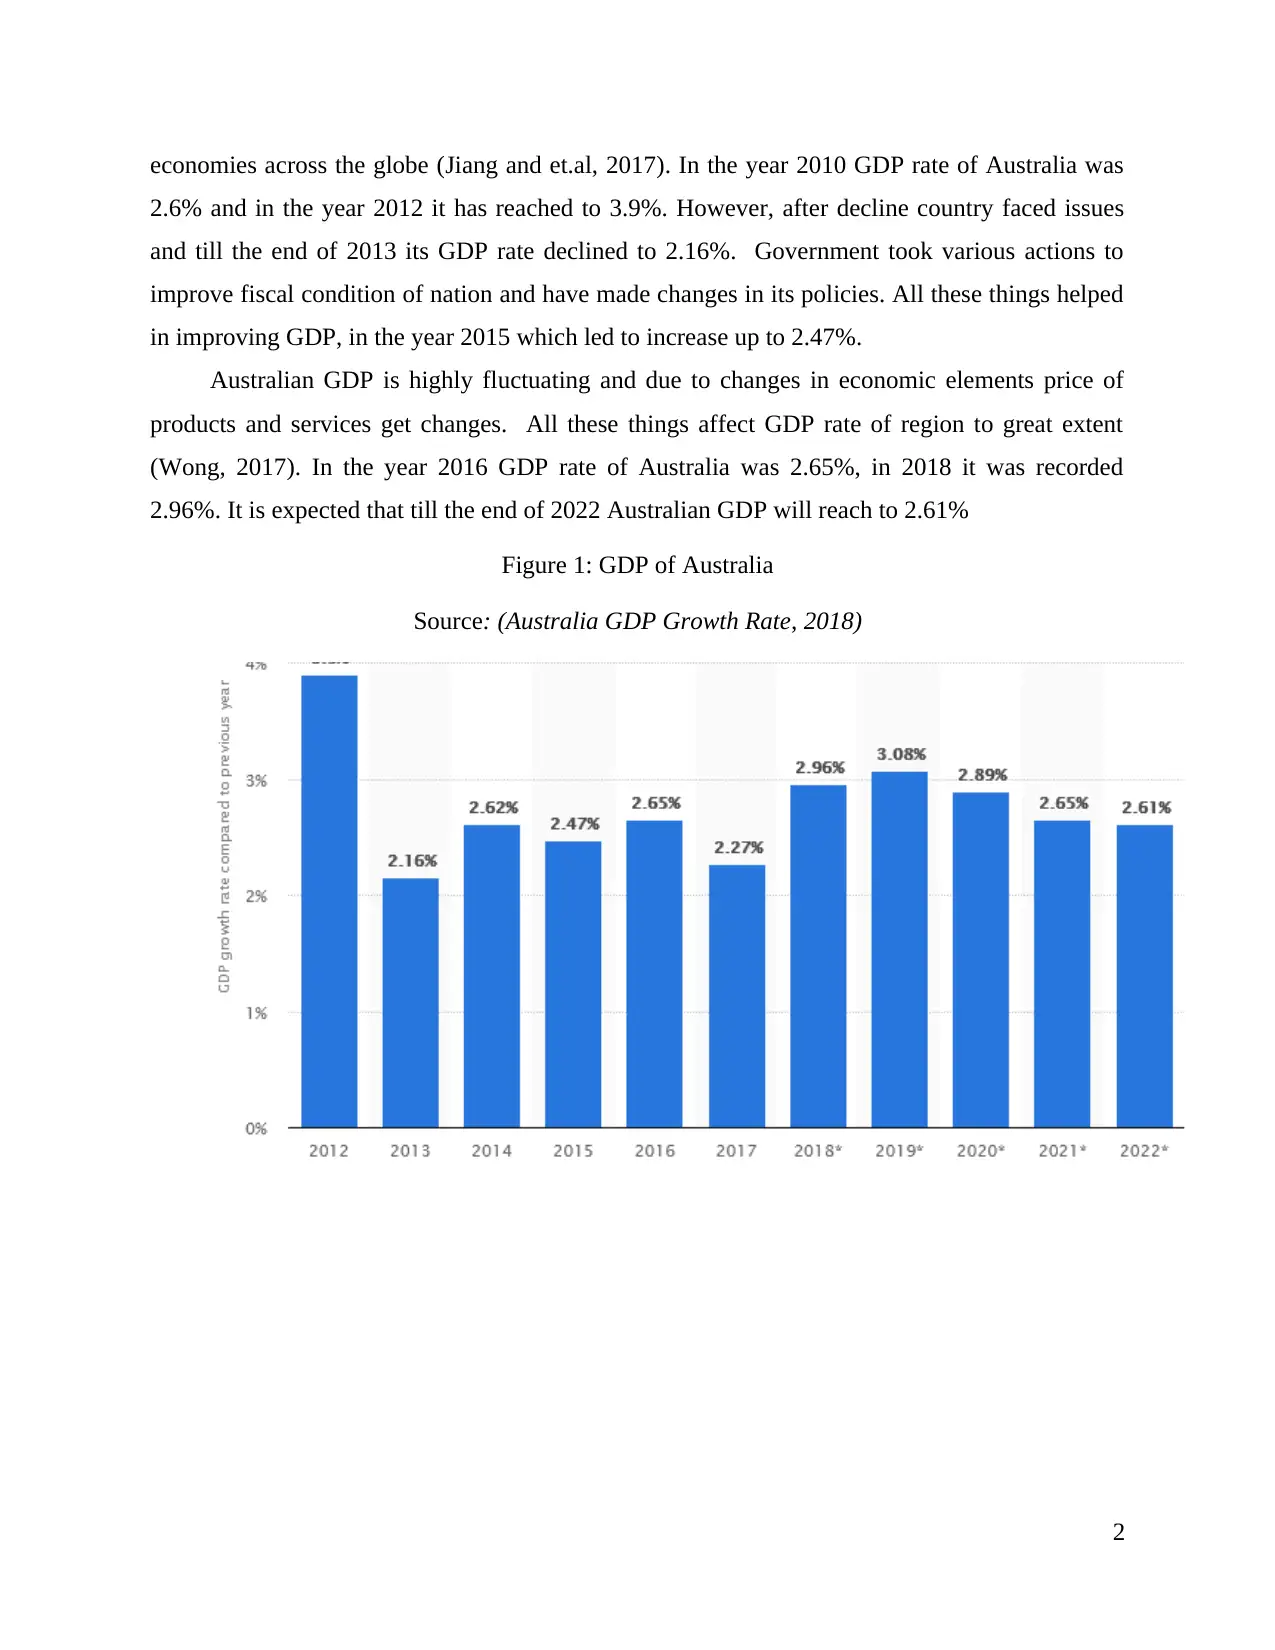
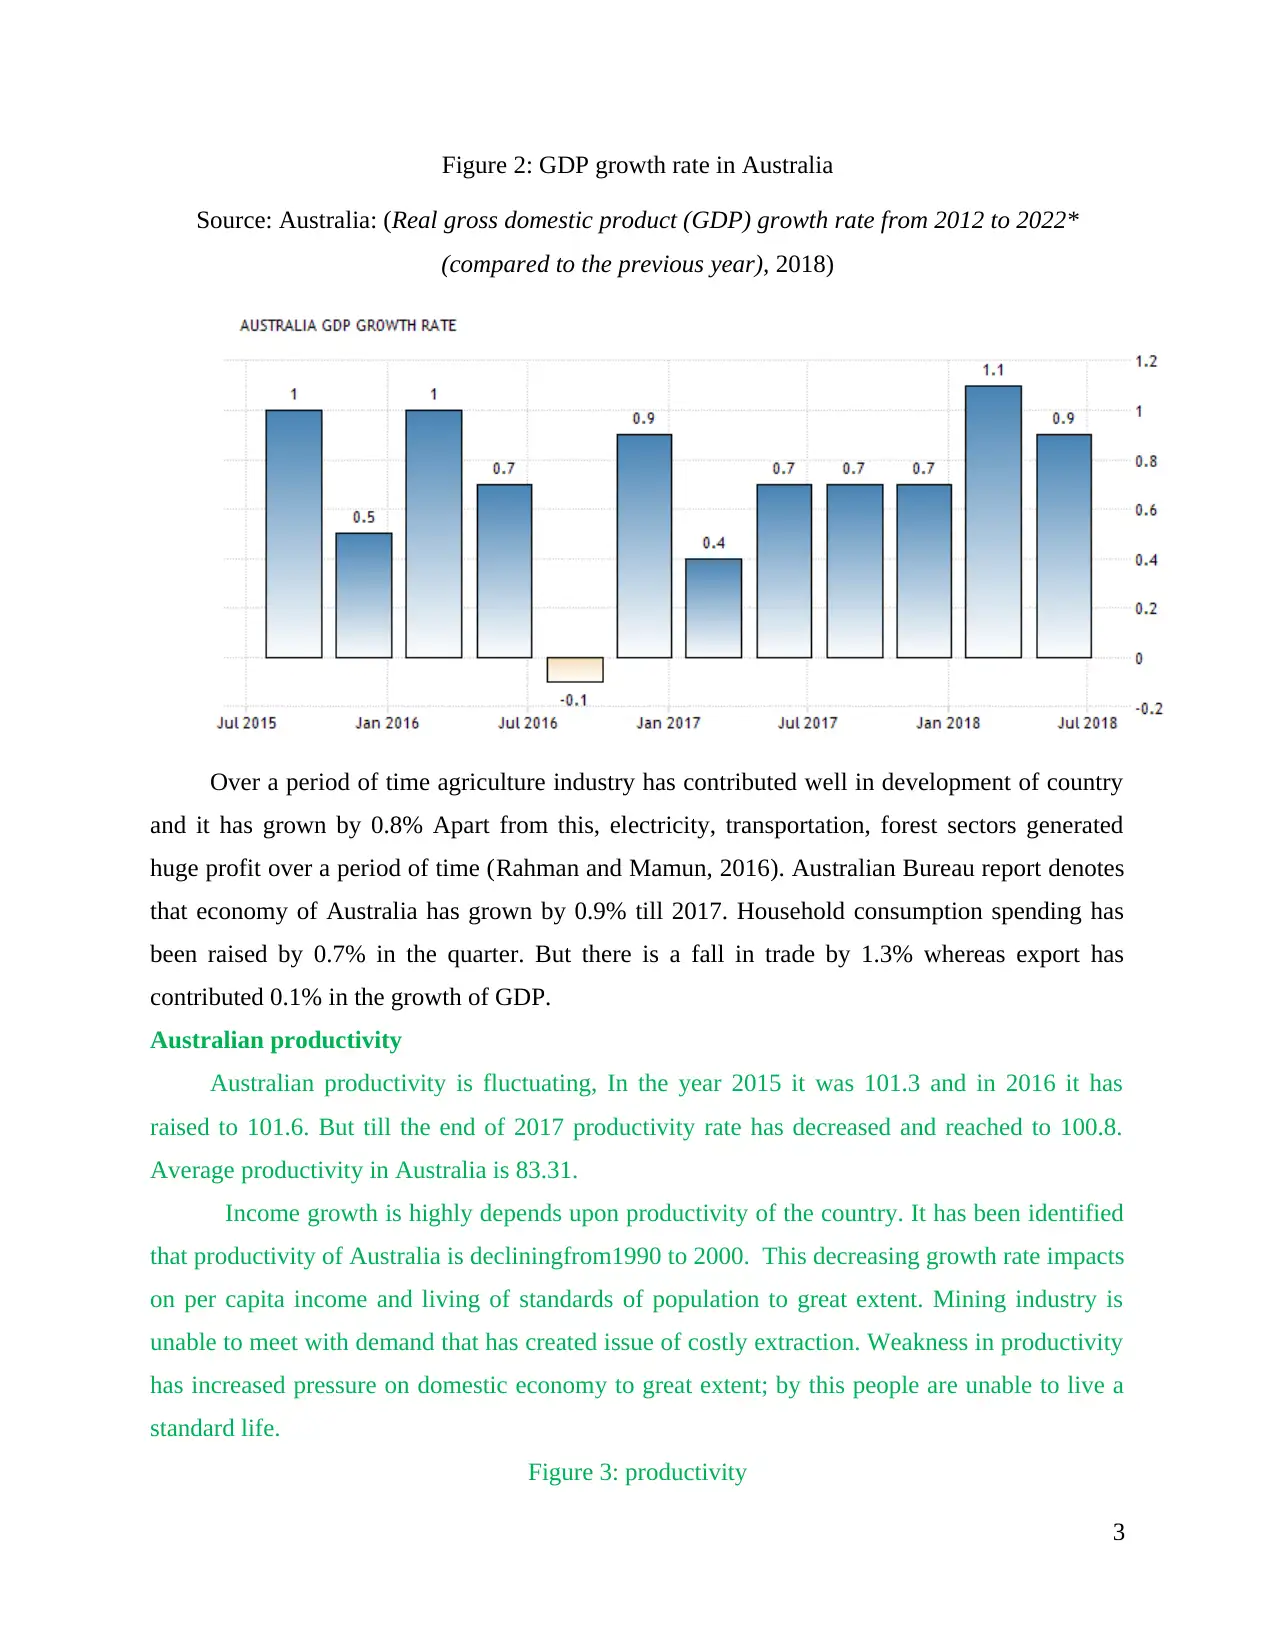
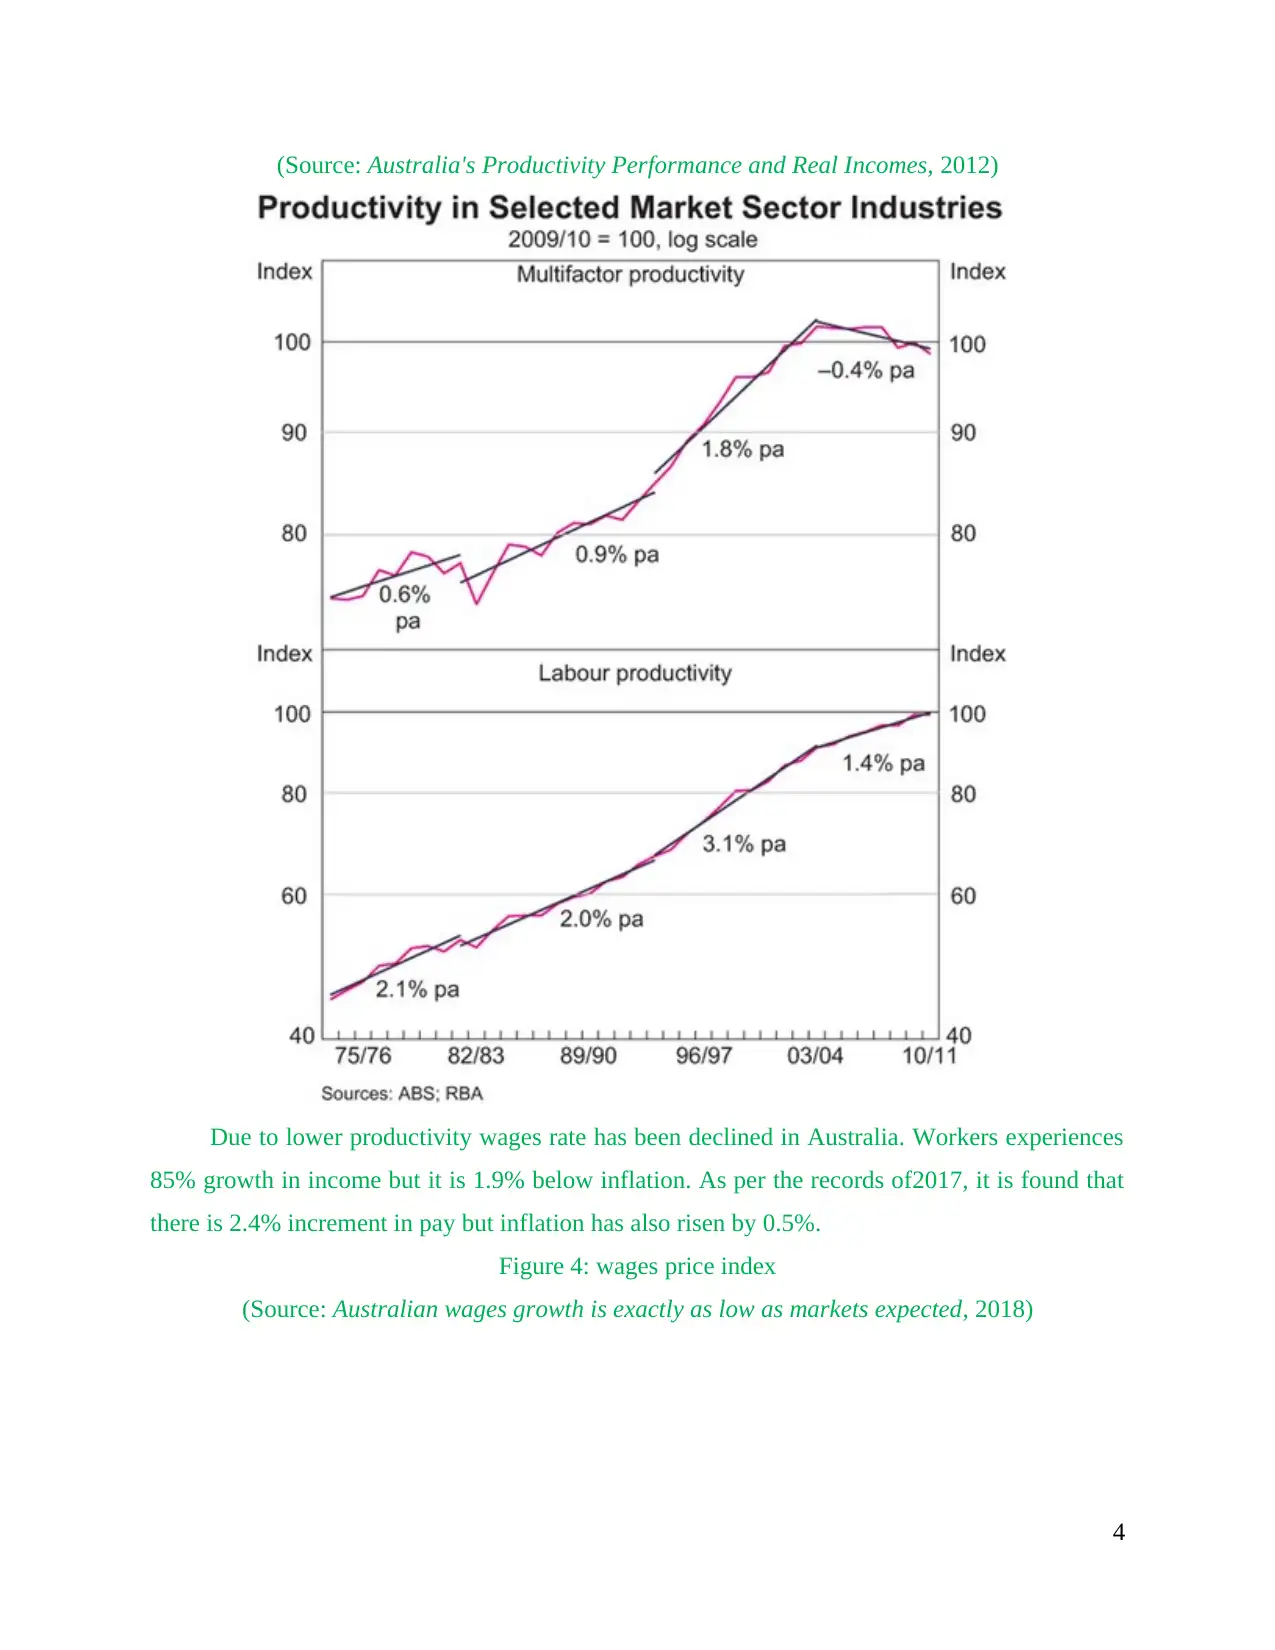
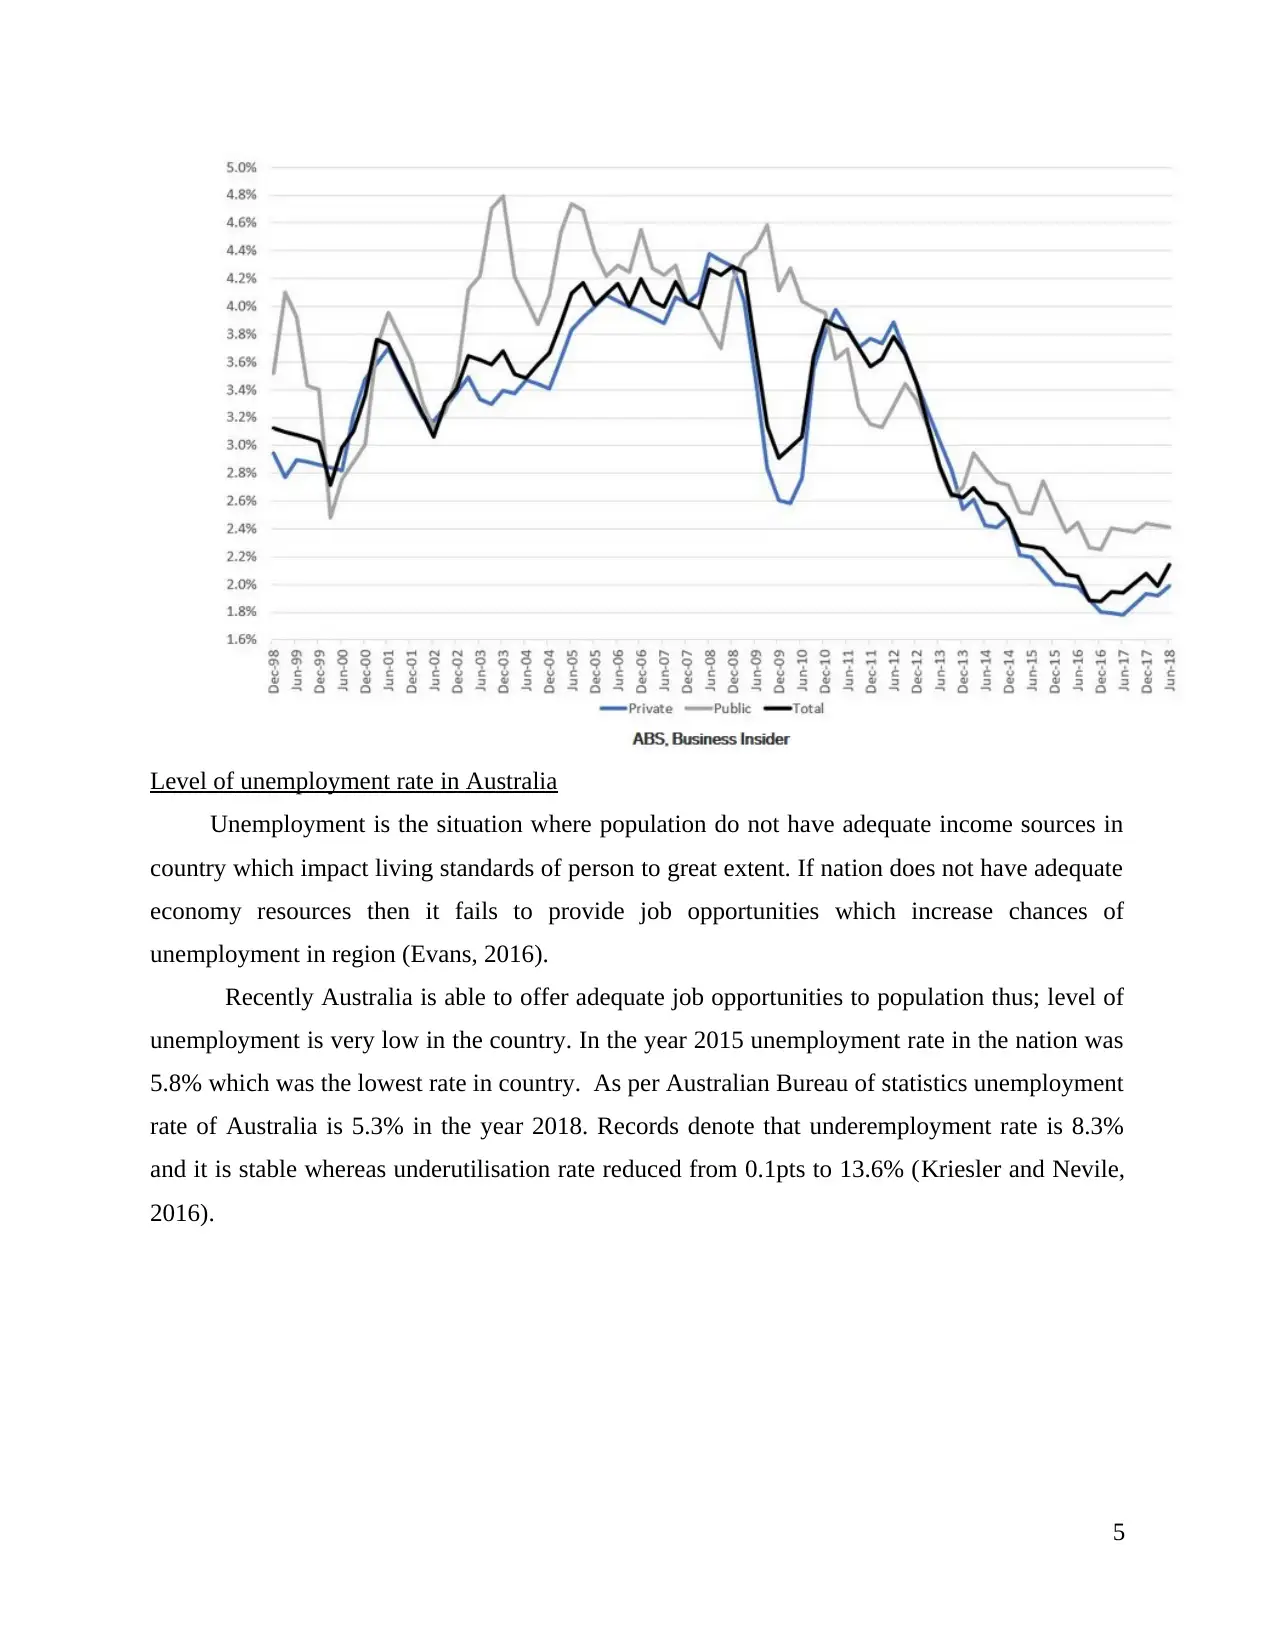
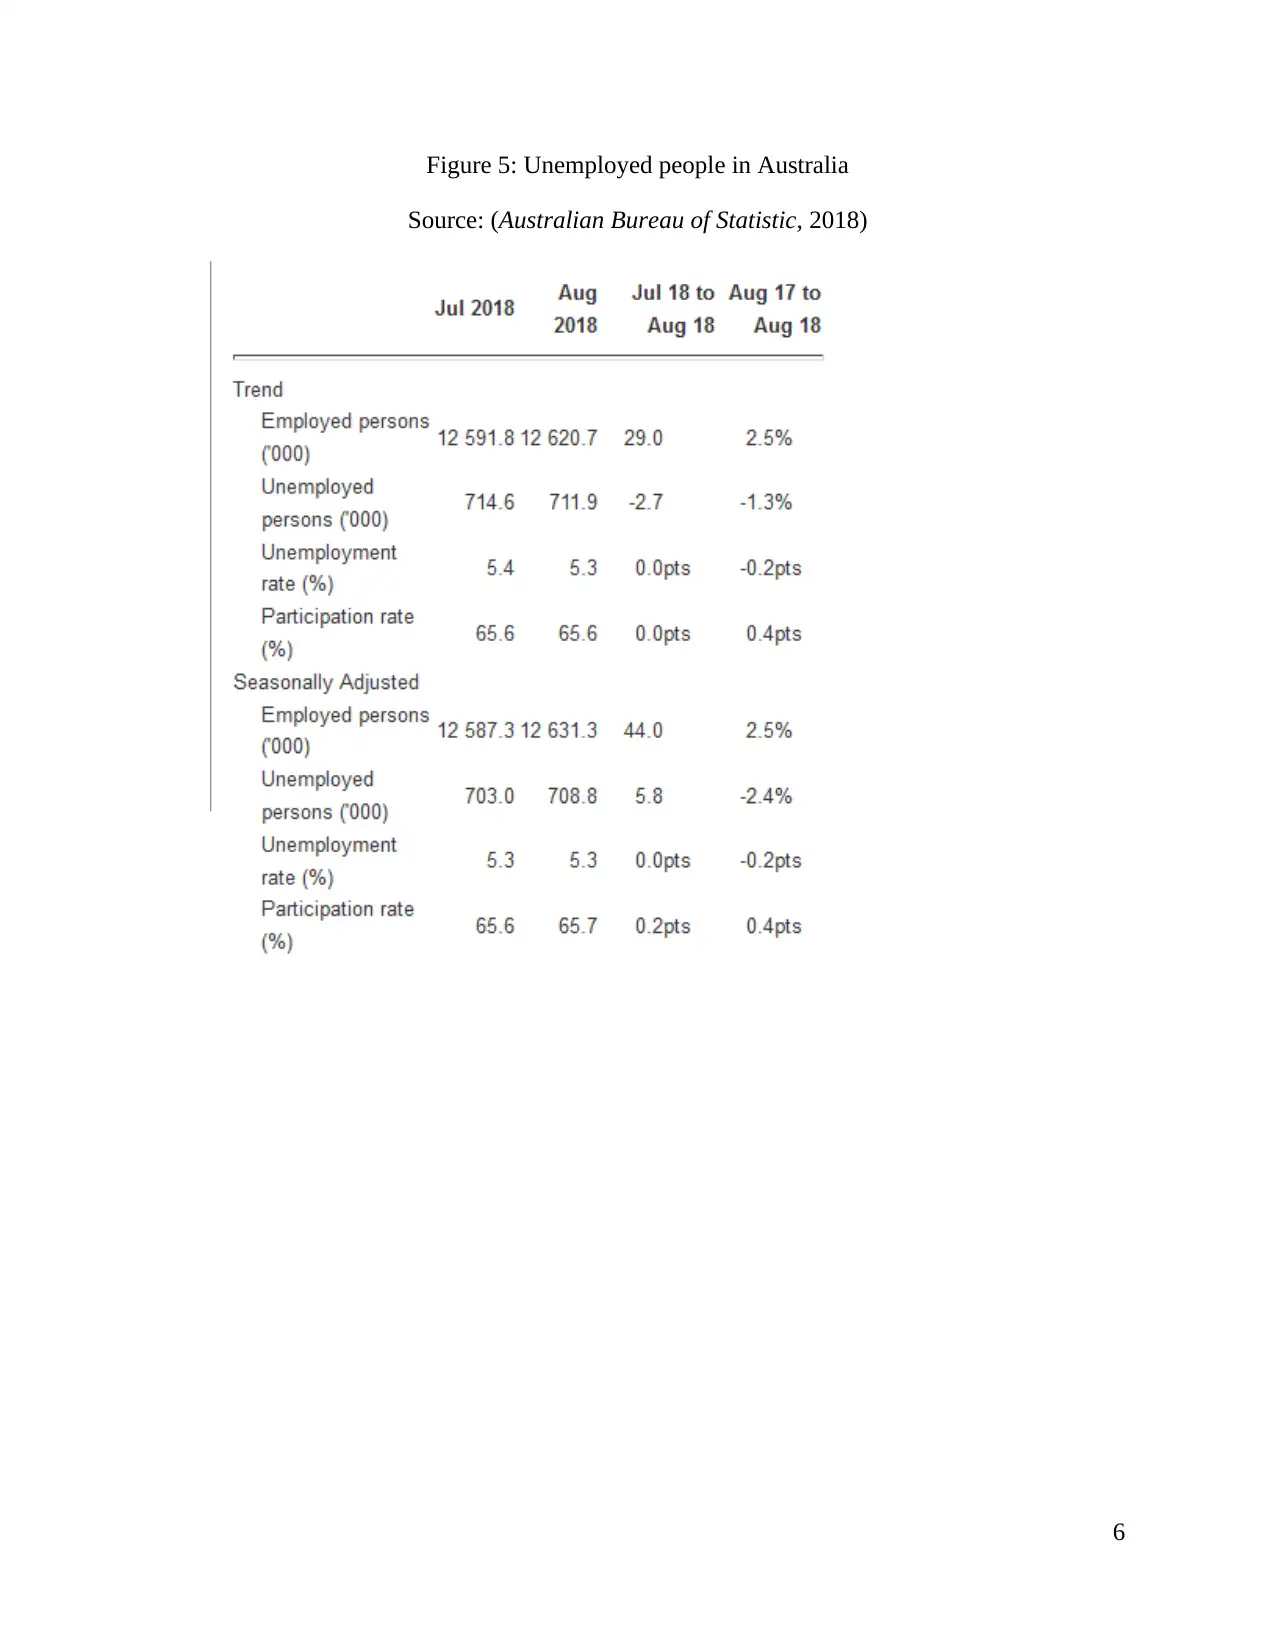
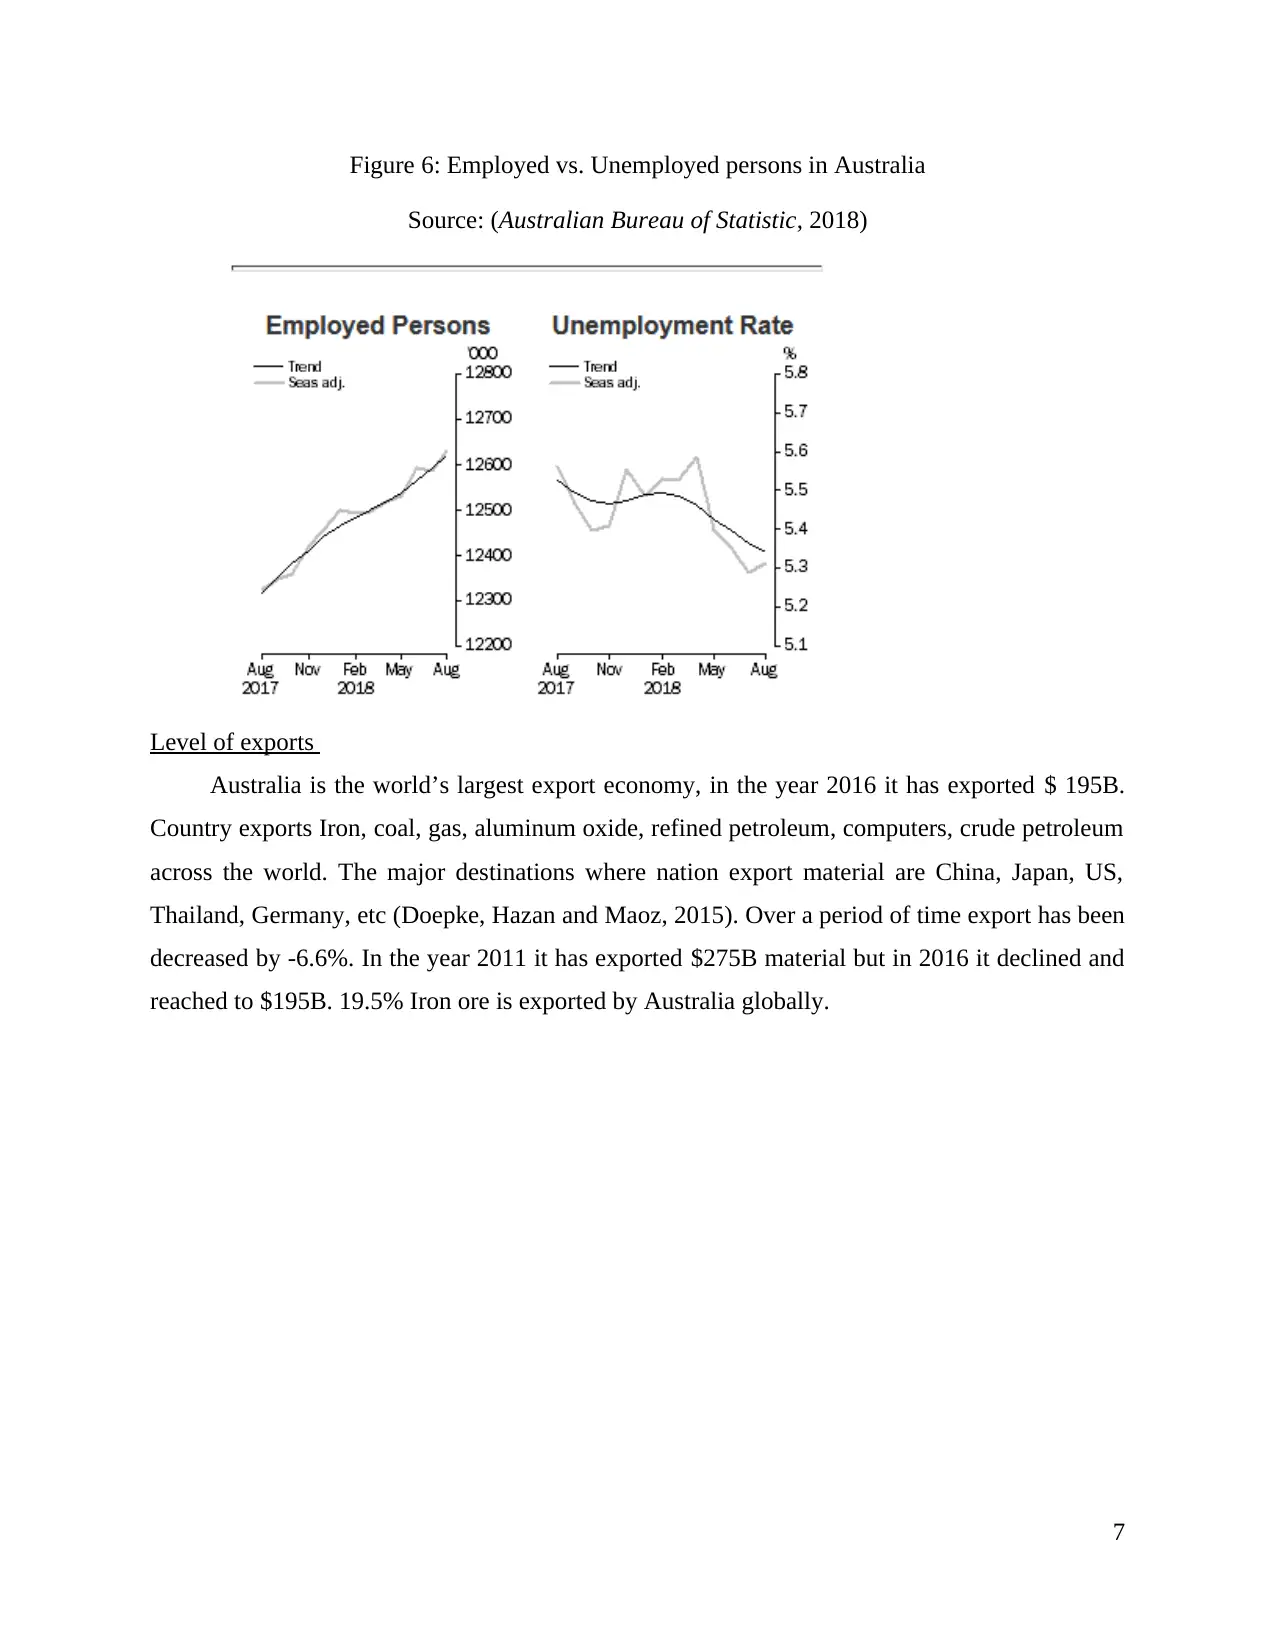
This report provides a comprehensive economic analysis of Australia, focusing on key indicators such as Gross Domestic Product (GDP), unemployment rates, and import/export levels over the past five years. It examines the methods used to calculate GDP, including output, expenditure, and income approaches. The report details the fluctuating GDP growth, highlighting the contributions of various sectors like agriculture and mining. It also explores the unemployment trends, export and import levels, and the influence of inflation and foreign investment on the Australian economy. Furthermore, the report discusses the nature of assets, reasons behind Australia's economic resilience, and the roles of the Reserve Bank of Australia (RBA) and fiscal policy in maintaining economic stability. The report concludes with a summary of the economic factors that contribute to Australia's overall development and growth.
Document Page
ECONOMIC
tabler-icon-diamond-filled.svg

Paraphrase This Document

Need a fresh take? Get an instant paraphrase of this document with our AI Paraphraser
Document Page
TABLE OF CONTENTS
INTRODUCTION...........................................................................................................................1
MAIN BODY..................................................................................................................................1
GDP.............................................................................................................................................1
Ways to calculate GDP................................................................................................................1
Australian GDP over last 5 years.................................................................................................1
Level of unemployment rate in Australia....................................................................................3
Level of exports...........................................................................................................................5
Level of import............................................................................................................................8
Inflation rate and foreign investment in Australia.......................................................................9
Nature of assets such as having market shares..........................................................................12
Reasons, why Australia is not facing recession in recent history..............................................13
Role of RBA (Reserve bank of Australia).................................................................................13
Fiscal policy of Government for economic growth...................................................................14
CONCLUSION..............................................................................................................................15
REFERENCES..............................................................................................................................16
Document Page
INTRODUCTION
Development rate and growth of any country is determined by its fiscal condition which is
core element of economics. Macro economy determines GDP, employment rate and price index
of nation that assist in understanding overall functioning of region. Present study will discuss
GDP of Australia over last 5 years. Furthermore, it will explain the level of unemployment rate,
import and export in nation. In addition, it will give justification for the reason why Australia has
not faced recession in recent history. Moreover, it will outline role of Reserve bank of Australia
(RBA).
MAIN BODY
GDP
Gross domestic product is the monetary value of products and services in an economy over
a period of time. It is considered as indicator to measure wealth and growth of nation. It includes
consumption of public, private goods, outlets of government, investments, paid in construction
cost, balance of trade, investments, net exports, government expenditure, personal consumption
spending, etc (Liaqat, Kifle and Alauddin, 2016). GDP is the method of measuring overall of
economic condition of nation at broad level. Inflation, deflation rates are common tools that
allows seamless comparisons between GDP of various countries. It is measured by using three
different methods: output, expenditure, income techniques. In output method authorities measure
market value of goods within boundary of nation wherein expenditure total spending within
domestic boundaries are calculated and in income process total earned revenue through various
sources are counted in order to measure overall economic value of region (Healy, 2016).
Ways to calculate GDP
GDP is calculated annually or quarterly.
GDP= Private consumption+ gross investment + government investments + spending of
government+ (Export- Imports).
Australian GDP over last 5 years
Gross domestic product (GDP) is considered as essential component that determines
financial condition of country. GDP rate is being calculated to measure overall performance of
region and finding actual condition of the economy. Australian economy is largest mixed
1
Document Page
economies across the globe (Jiang and et.al, 2017). In the year 2010 GDP rate of Australia was
2.6% and in the year 2012 it has reached to 3.9%. However, after decline country faced issues
and till the end of 2013 its GDP rate declined to 2.16%. Government took various actions to
improve fiscal condition of nation and have made changes in its policies. All these things helped
in improving GDP, in the year 2015 which led to increase up to 2.47%.
Australian GDP is highly fluctuating and due to changes in economic elements price of
products and services get changes. All these things affect GDP rate of region to great extent
(Wong, 2017). In the year 2016 GDP rate of Australia was 2.65%, in 2018 it was recorded
2.96%. It is expected that till the end of 2022 Australian GDP will reach to 2.61%
Figure 1: GDP of Australia
Source: (Australia GDP Growth Rate, 2018)
2
tabler-icon-diamond-filled.svg

Paraphrase This Document

Need a fresh take? Get an instant paraphrase of this document with our AI Paraphraser
Document Page
Figure 2: GDP growth rate in Australia
Source: Australia: (Real gross domestic product (GDP) growth rate from 2012 to 2022*
(compared to the previous year), 2018)
Over a period of time agriculture industry has contributed well in development of country
and it has grown by 0.8% Apart from this, electricity, transportation, forest sectors generated
huge profit over a period of time (Rahman and Mamun, 2016). Australian Bureau report denotes
that economy of Australia has grown by 0.9% till 2017. Household consumption spending has
been raised by 0.7% in the quarter. But there is a fall in trade by 1.3% whereas export has
contributed 0.1% in the growth of GDP.
Australian productivity
Australian productivity is fluctuating, In the year 2015 it was 101.3 and in 2016 it has
raised to 101.6. But till the end of 2017 productivity rate has decreased and reached to 100.8.
Average productivity in Australia is 83.31.
Income growth is highly depends upon productivity of the country. It has been identified
that productivity of Australia is decliningfrom1990 to 2000. This decreasing growth rate impacts
on per capita income and living of standards of population to great extent. Mining industry is
unable to meet with demand that has created issue of costly extraction. Weakness in productivity
has increased pressure on domestic economy to great extent; by this people are unable to live a
standard life.
Figure 3: productivity
3
Document Page
(Source: Australia's Productivity Performance and Real Incomes, 2012)
Due to lower productivity wages rate has been declined in Australia. Workers experiences
85% growth in income but it is 1.9% below inflation. As per the records of2017, it is found that
there is 2.4% increment in pay but inflation has also risen by 0.5%.
Figure 4: wages price index
(Source: Australian wages growth is exactly as low as markets expected, 2018)
4
Document Page
Level of unemployment rate in Australia
Unemployment is the situation where population do not have adequate income sources in
country which impact living standards of person to great extent. If nation does not have adequate
economy resources then it fails to provide job opportunities which increase chances of
unemployment in region (Evans, 2016).
Recently Australia is able to offer adequate job opportunities to population thus; level of
unemployment is very low in the country. In the year 2015 unemployment rate in the nation was
5.8% which was the lowest rate in country. As per Australian Bureau of statistics unemployment
rate of Australia is 5.3% in the year 2018. Records denote that underemployment rate is 8.3%
and it is stable whereas underutilisation rate reduced from 0.1pts to 13.6% (Kriesler and Nevile,
2016).
5
tabler-icon-diamond-filled.svg

Paraphrase This Document

Need a fresh take? Get an instant paraphrase of this document with our AI Paraphraser
Document Page
Figure 5: Unemployed people in Australia
Source: (Australian Bureau of Statistic, 2018)
6
Document Page
Figure 6: Employed vs. Unemployed persons in Australia
Source: (Australian Bureau of Statistic, 2018)
Level of exports
Australia is the world’s largest export economy, in the year 2016 it has exported $ 195B.
Country exports Iron, coal, gas, aluminum oxide, refined petroleum, computers, crude petroleum
across the world. The major destinations where nation export material are China, Japan, US,
Thailand, Germany, etc (Doepke, Hazan and Maoz, 2015). Over a period of time export has been
decreased by -6.6%. In the year 2011 it has exported $275B material but in 2016 it declined and
reached to $195B. 19.5% Iron ore is exported by Australia globally.
7
Document Page
Figure 7: Export of Australia
Source: (Australia, 2018)
Recently export of Australia decreased month-on-month. Moreover, non- rural goods
sales have been decreased by 1% (Trofimov and Bin Rosli, 2018). Total exporters of regular
goods have been increased by 1% from 2015 to 2016.
8
tabler-icon-diamond-filled.svg

Paraphrase This Document

Need a fresh take? Get an instant paraphrase of this document with our AI Paraphraser
Document Page
Figure 8: Australia export
Source: (Australia Exports, 2018)
Figure 9: Export level
(Source: Australia’s export performance in 2015-16, 2017)
9
Document Page
Level of import
Import of the condition is steady and is recorded at AUD34.52Billion. In the year 2016
total import of Australia was AUD187B. Country is 23rd largest importer but over a period of
time its level of import has been reduced. By -3.8% annually. In the year $229B worth material
were imported whereas in the year 2016 it has reached to $187B. Cars, refined petroleum are the
major import products of the nation (Nguyen and Duncan, 2015). Cars account 8.85% and
refined petroleum accounts 5.71%. In the year 2007 worth of import was $165.34, it has
increased in 2008 and has reached to $200.27 in that year. In 2017, import was AUD228.58B.
Figure 10: Import export of Australia
Source: (Australian Bureau of Statistics, 2018)
10
chevron_up_icon
1 out of 21
circle_padding
hide_on_mobile
zoom_out_icon
[object Object]