Report: Economic Principles and Australia's GDP in 2019
VerifiedAdded on 2023/03/17
|16
|3999
|80
Report
AI Summary
This report provides a comprehensive analysis of the factors contributing to the predicted decline in Australia's GDP growth below 3% in 2019. It examines the historical GDP trends, the components of GDP (including household consumption, government consumption, investment in fixed capital, and net exports), and the influence of the housing market and China's economic slowdown. The report calculates the impact of these factors on GDP growth, considering their respective shares and growth rates. It concludes that both the low growth of the housing market and the slowdown in China's economy have significantly influenced Australia's GDP, supporting the prediction of a GDP growth rate below 3 percent. The analysis incorporates data on exports, imports, and investment to provide a detailed understanding of the economic forces at play.
Running head: ECONOMIC PRINCIPLES AND DECISION MAKING
Economic Principles and Decision Making
Name of the Student
Name of the University
Author Note
Economic Principles and Decision Making
Name of the Student
Name of the University
Author Note
Paraphrase This Document
Need a fresh take? Get an instant paraphrase of this document with our AI Paraphraser
1ECONOMIC PRINCIPLES AND DECISION MAKING
Executive Summary
This report pertains to discuss the prediction of fall in Australian GDP growth below 3
percent in 2019 is due to low growth of housing market in Australia and China’s economic
slowdown. To discuss the components of GDP have been considered and brief discussion on
them have been made to understand the role of the responsible factors and categorization of
them as the sub components. Before the discussion of components, the historical data of
Australia’s GDP have been discussed thoroughly along with fluctuations and trend to have
clear idea regarding the influence of the slowing down factors of GDP growth. The current
contributions of the components have been considered and the effects of the low growth of
housing market and change in export values due to China’s economic slowdown calculated
by considering current GDP value of Australia. The findings from the discussion led to the
conclusion that both the factors have influenced the GDP growth rate of Australia and as a
result, the prediction of fall in GDP growth below 3 percent is materialized.
2ECONOMIC PRINCIPLES AND DECISION MAKING
Table of Contents
Introduction................................................................................................................................3
Historical GDP Growth of Australia..........................................................................................3
Components of Australian GDP.................................................................................................5
Shares of different components in GDP.....................................................................................6
Housing market..........................................................................................................................7
Slowdown of China and impact on Australia............................................................................8
Exports of Australia...............................................................................................................8
Imports of Australia...............................................................................................................8
Conclusion................................................................................................................................11
References................................................................................................................................13
⊘ This is a preview!⊘
Do you want full access?
Subscribe today to unlock all pages.
Trusted by 1+ million students worldwide
3ECONOMIC PRINCIPLES AND DECISION MAKING
Introduction
Gross Domestic Product is a widely used parameter to measure and understand a
country’s economic scenario. However, many have criticized it as a poor indicator of a
country’s true economic and social welfare. Yet it is used to measure the economic output of
a country because of its versatility in considering only economic factors that influences the
overall output of an economy (Goodwin et al., 2015). Thus, every country measures GDP and
represents it economic output in terms of GDP.
This report discusses the GDP of Australia along with its historical data on GDP to
understand the prediction of fall in its GDP below 3 percent in 2019. It is argued that the
reason behind the prediction of fall in GDP is the low growth of housing market in Australia
and decrease in Australia’s export to China due to present adverse economic condition in
China (Blagrave & Vesperoni, 2018). Therefore, in the report the analysis of the major GDP
components is done to identify the main factor that are influenced by the aforesaid factors
that are believed to be responsible for the prediction of reduced GDP growth. Furthermore, in
the report, the data on growth rate of housing market is considered and calculations are made
to find the effect of the housing market investment on the GDP growth. The effect of
slowdown of economy of China is also considered and analysed and the effect on GDP of
Australia is discussed. Thus, the report discusses the effect of both the housing market and
Chinese economic slowdown on Australian GDP in 2019 and argues that low growth of
housing market is not the only responsible factor behind decreased Australian GDP but slow
economic growth of China is also the major factor behind it (Paramati, et al., 2018).
Historical GDP Growth of Australia
Low economic growth is one of the characteristics of developed economies. Australia
as developed country experiences low economic growth for a long time now, but the growth
Paraphrase This Document
Need a fresh take? Get an instant paraphrase of this document with our AI Paraphraser
4ECONOMIC PRINCIPLES AND DECISION MAKING
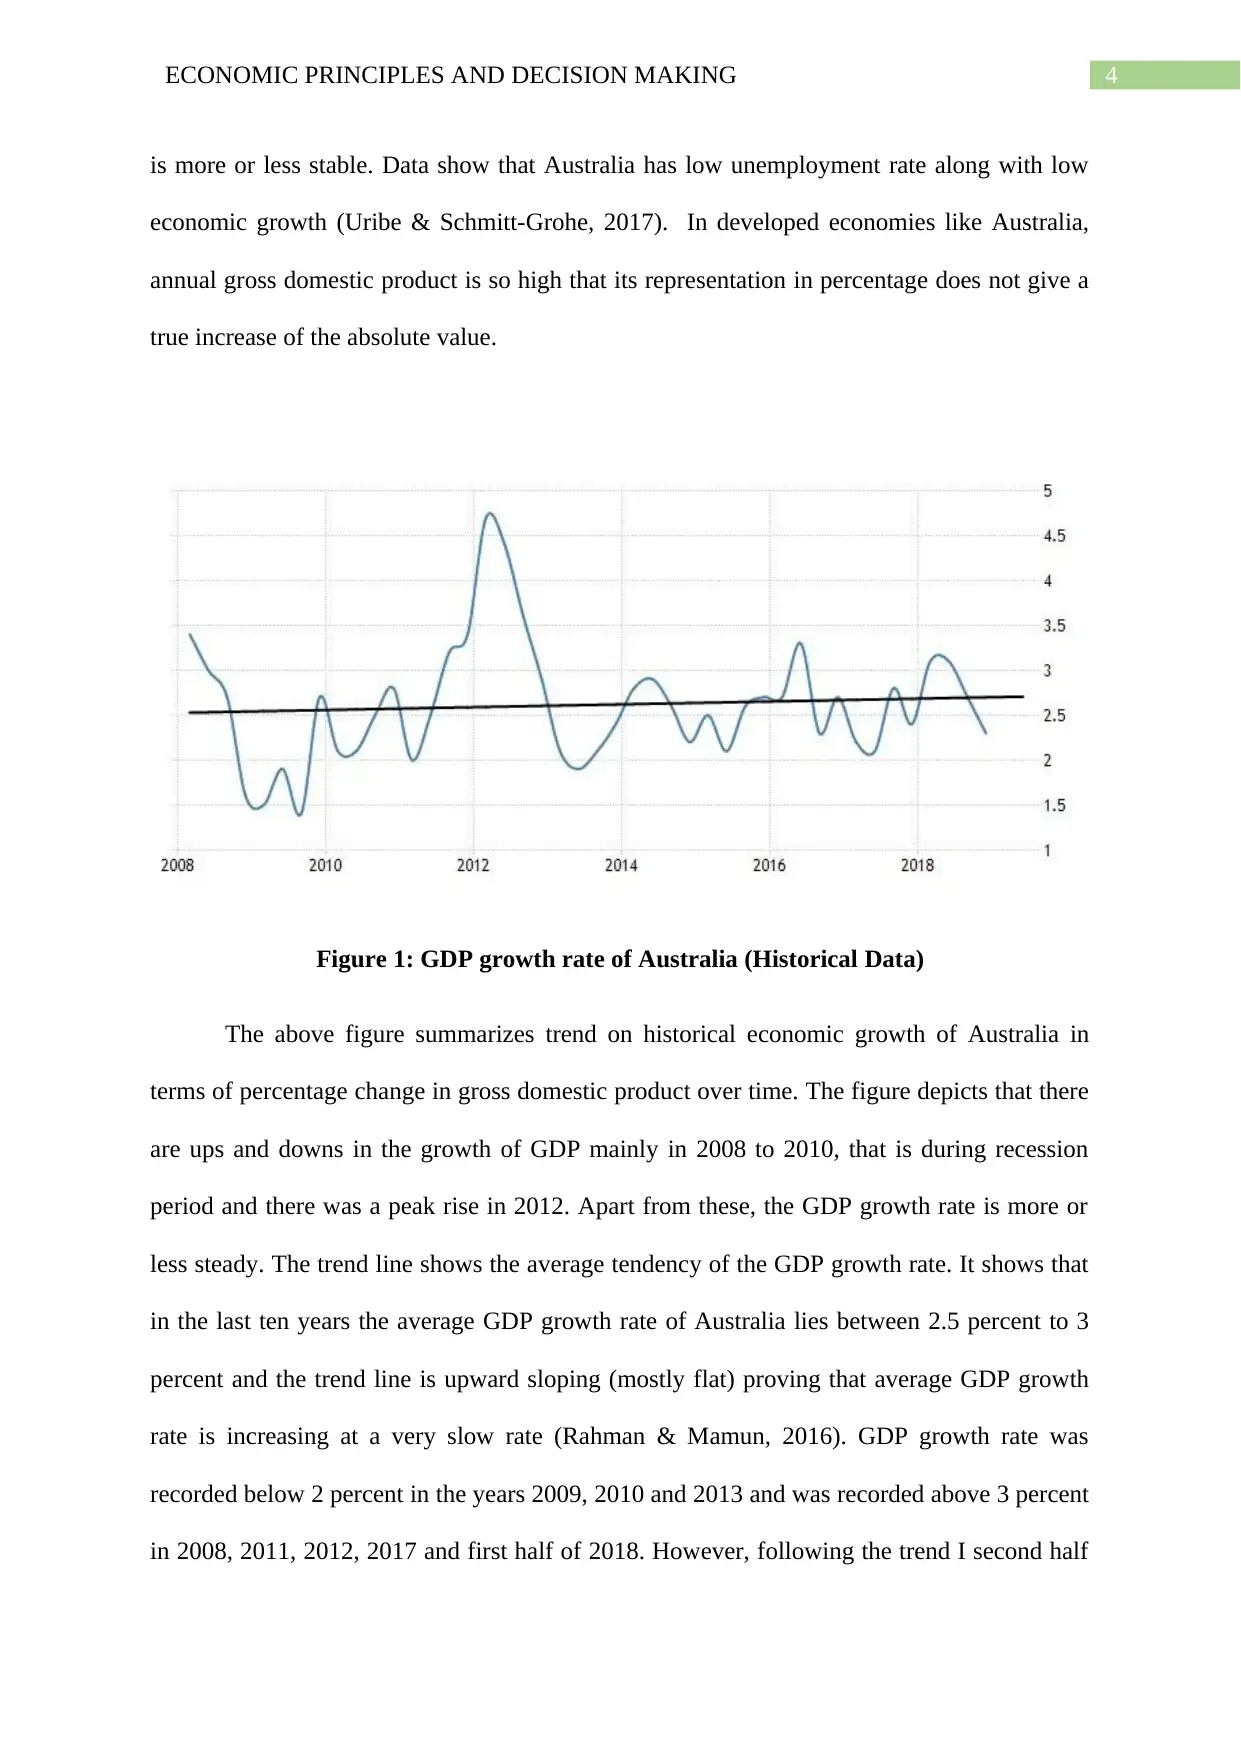
is more or less stable. Data show that Australia has low unemployment rate along with low
economic growth (Uribe & Schmitt-Grohe, 2017). In developed economies like Australia,
annual gross domestic product is so high that its representation in percentage does not give a
true increase of the absolute value.
Figure 1: GDP growth rate of Australia (Historical Data)
The above figure summarizes trend on historical economic growth of Australia in
terms of percentage change in gross domestic product over time. The figure depicts that there
are ups and downs in the growth of GDP mainly in 2008 to 2010, that is during recession
period and there was a peak rise in 2012. Apart from these, the GDP growth rate is more or
less steady. The trend line shows the average tendency of the GDP growth rate. It shows that
in the last ten years the average GDP growth rate of Australia lies between 2.5 percent to 3
percent and the trend line is upward sloping (mostly flat) proving that average GDP growth
rate is increasing at a very slow rate (Rahman & Mamun, 2016). GDP growth rate was
recorded below 2 percent in the years 2009, 2010 and 2013 and was recorded above 3 percent
in 2008, 2011, 2012, 2017 and first half of 2018. However, following the trend I second half
5ECONOMIC PRINCIPLES AND DECISION MAKING
of 2018 it is predicted that the GDP growth will fail to achieve 3 percent of growth rate and it
might hit much lower rate of growth. Several factors influence the GDP growth rate to
fluctuate some are internal issues like low production, low domestic demand and the other are
external low export demand from foreign countries, foreign currency appreciation and export
concentration (Shafiullah, Selvanathan & Naranpanawa, 2017). Hence, to understand the
GDP growth rate and its fluctuation in details it is necessary to understand the factors
influencing it.
Components of Australian GDP
The factors Australia GDP is composed of are household consumption, government
consumption, investment in fixed capital, investment inventories, imports of goods and
services and exports of goods and services. Household consumption includes expenditures
made by not for profit organizations that help households, resident households and
individuals on goods and services. The consumption accounts for both foreign and
domestically produced goods and services (Agenor & Montiel, 2015). Government
consumption includes expenditure made only on goods and services, that means excludes all
other expenses such as transfer payments like subsidies, unemployment and social security
payments. Investment in fixed capital include business expenditure on fixed properties like,
machinery, raw material, factory and equipment that lays the foundation for future production
and is measured as the gross value of the asset depreciation. Investment in inventories include
the stock of goods held by sellers that are ready for sale, if the stock rises due to fall in sale of
goods then it indicates that the economy is going into recession and if the opposite happens
then the economy is growing with acceleration (Heijdra, 2017). Of the two remaining
components, export of goods and services include sales to foreign countries gifts or grants to
foreign residents and imports of goods and services include purchase and receivables of
goods and services by domestic individuals from foreign residents.
⊘ This is a preview!⊘
Do you want full access?
Subscribe today to unlock all pages.
Trusted by 1+ million students worldwide
6ECONOMIC PRINCIPLES AND DECISION MAKING
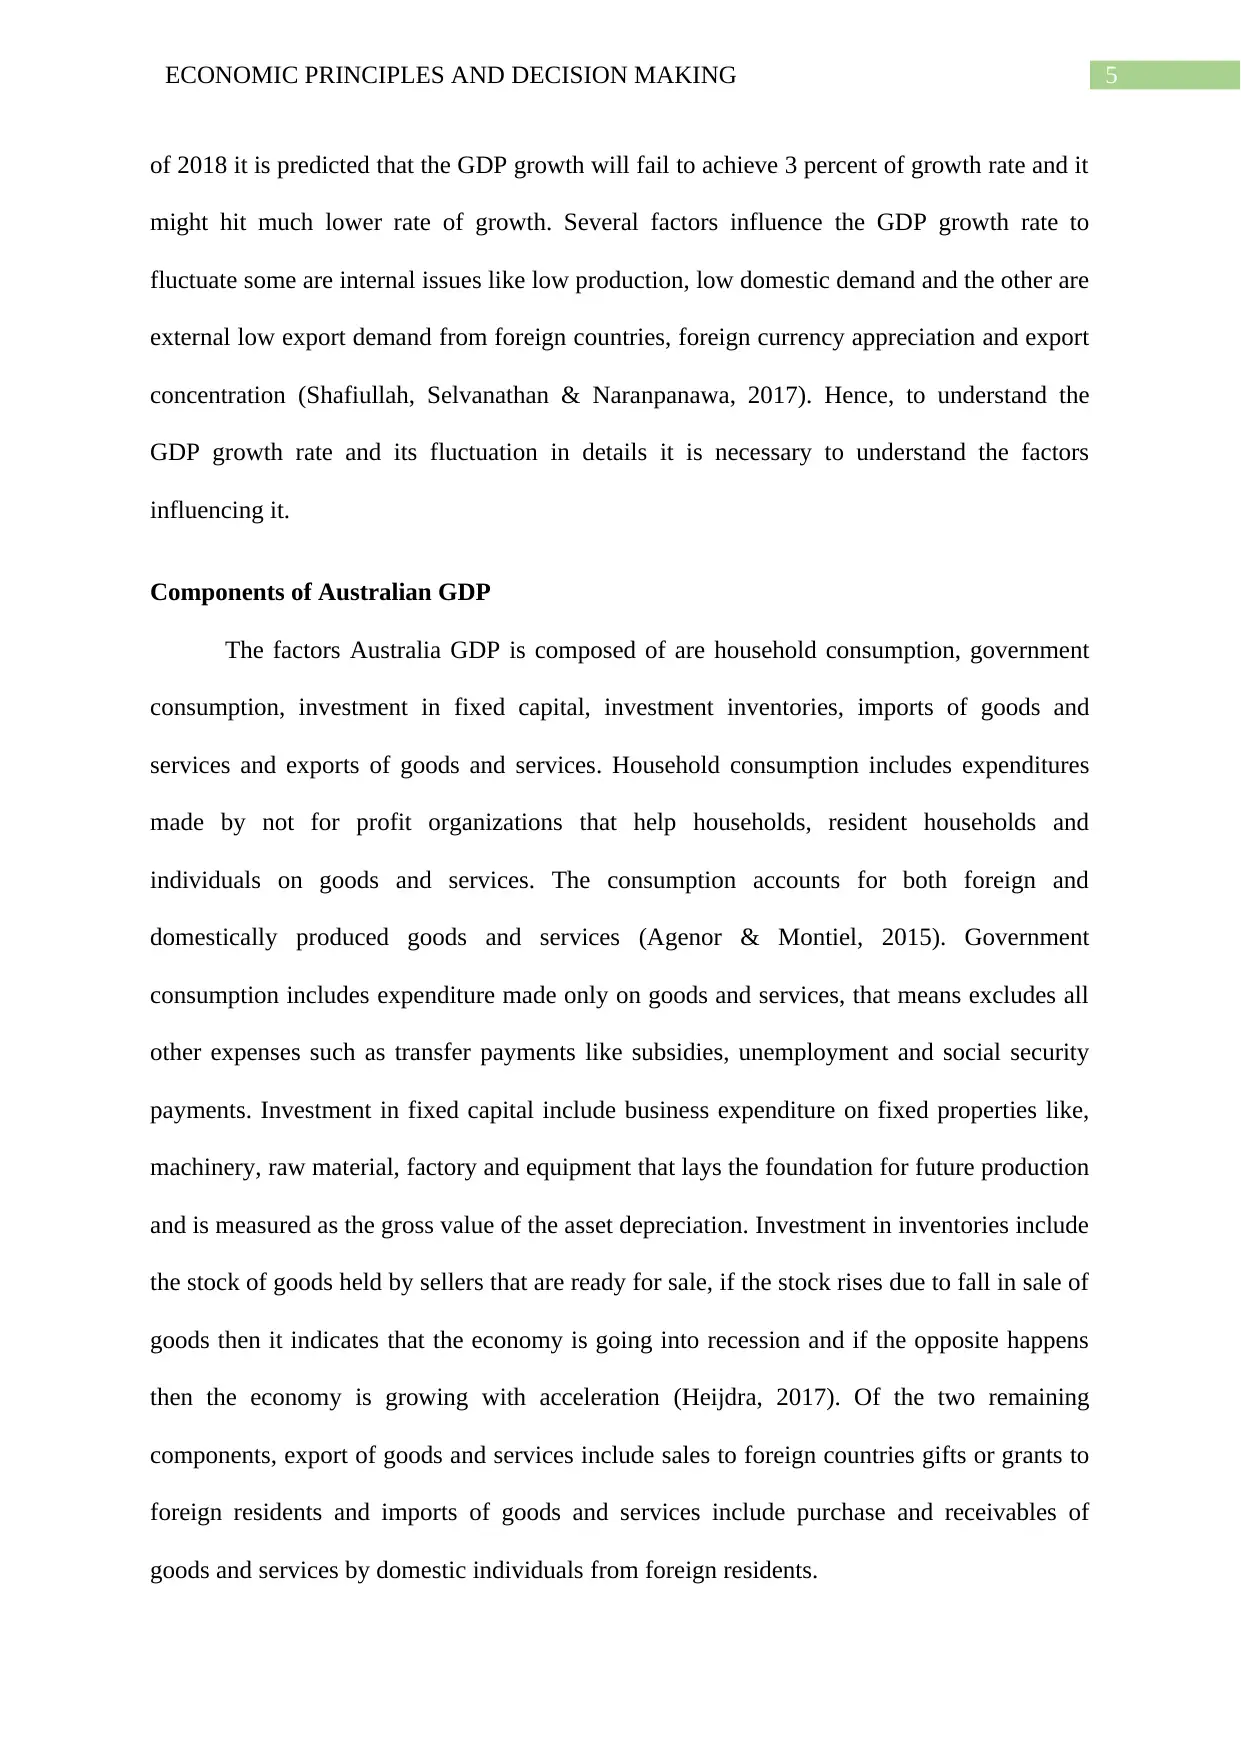
Shares of different components in GDP
56.10%
18.60%
24.70%
0.60%
Share of different components in GDP
Consumption
Investment
Government expenditure
Net export
Figure 2: Share of different components in Australia’s GDP
The four components as mentioned above are the primary contributor of the entire
GDP. In 2018, household consumption contributes 56.1%, government contributes 18.6 %,
capital investment contributes 24.7% and net exports contribute 0.6% in GDP. The total value
of GDP of Australia in 2018 is $1,418,280 million.
In broad aspect, household consumption includes all the expenses made by the
individuals such as purchase of all products, payments to government as licence fee, earnings
in kind, consumption of products produced by an individual household itself and any rents
and payments to service providers or government (Finlay & Price, 2015). In case of
government expenditure, all the expenditures along with transfer payments are included. The
spending include, expenses for government healthcare facilities, spending on national
defence, per capita spending, maintenance spending such as road, museums, heritage
buildings and public premises and parks maintenance and other social spending. Net export is
a combination of exports and imports (Sadat, 2017). More is the export, more will be the
value net export and is a positive factor. Lastly, the capital investment is the main reflection
Paraphrase This Document
Need a fresh take? Get an instant paraphrase of this document with our AI Paraphraser
7ECONOMIC PRINCIPLES AND DECISION MAKING
of the industrial growth of an economy. More is the capital investment more will be the
money flow in the economy, there will be more income, and there will be positive economic
growth. Thus, all the components except imports influence the GDP positively (Tyers &
Walker, 2016). Hence, growth in all the positive factors are welcome for GDP growth.
Housing market
The share of housing market in GDP of Australia is approximately 5.1% in 2018.
Housing investment is included under capital investment part of the GDP (Paris, 2017). The
total value of housing market contribution in GDP is
Value of housingmarket ∈GDP= 5.1×1418280
100
¿ Value of housingmarket ∈GDP=$ 72332.28 million
Therefore, the value of housing market in GDP in 2018 is $78005.4 million. It is predicted
that the housing market will grow at a rate of 8% per annum (Engsted & Pedersen, 2015)
Hence, future value of housing market next year will probably be
Future value of housing market =( 8
100 × 72332.28 )+72332.28
¿ , Future value of housing market=$ 78118.86 million (¿)
Therefore, increase in value of housing is ($78118.86 – $72332.28) or $5786.58 million.
$5786.58 million will be the increase in total GDP also because housing market is a part of it
(Bjornland, Ravazzolo & Thorsrud, 2017). Hence, percentage change in GDP due to growth
in housing market is given below
Percentage chaneg ∈GDP= 5786.58
1418280 ×100
¿ , Percentage change∈GDP=0.41 %
8ECONOMIC PRINCIPLES AND DECISION MAKING
Hence, due to predicted 8% growth in housing market the percentage growth in GDP
will be 0.41%. This growth is rate is slower than the historical growth rate of GDP that is
given as 2.75% average for the last ten years and in 2018, it was 1.95%. Hence from the
lower rate of growth of housing market it can be said that even if with the positive growth in
housing market GDP is not improving significantly (Stanford, 2018) Thus, the role of
housing market in improving GDP growth is nominal.
Slowdown of China and impact on Australia
Exports of Australia
Australia is at 23rd position among all the exporting economies in the world as in
2016. It earns around $253.8billion from exports in 2018. The major five commodities that
Australia exports are iron ore, gold, wheat, copper ore and coal briquettes (Marks, 2017).
Among other notable export products are frozen bovine meat, wool, goat and sheep meat and
wine. With export share of 24%, iron ore holds number 1 position among all the export
products in Australia. The major countries to which Australia exports are Japan, China, the
United States of America, South Korea and the United Kingdom (Albinski, 2015). Among all
the mentioned countries in the above statement China is the largest exporter of Australia’s
product with $74billion worth of goods. Trading with China came out to be fruitful for
Australia as it gains trade surplus of amount $19.1billion.
Imports of Australia
Australia imported goods from foreign countries worth $227.3billion. The major
products that Australia imports are computers, medicines, crude oil, precious metals and
gems, household furniture, iron and steel, plastic products, gold and electric machinery
equipment (Patience, 2018).
⊘ This is a preview!⊘
Do you want full access?
Subscribe today to unlock all pages.
Trusted by 1+ million students worldwide
9ECONOMIC PRINCIPLES AND DECISION MAKING
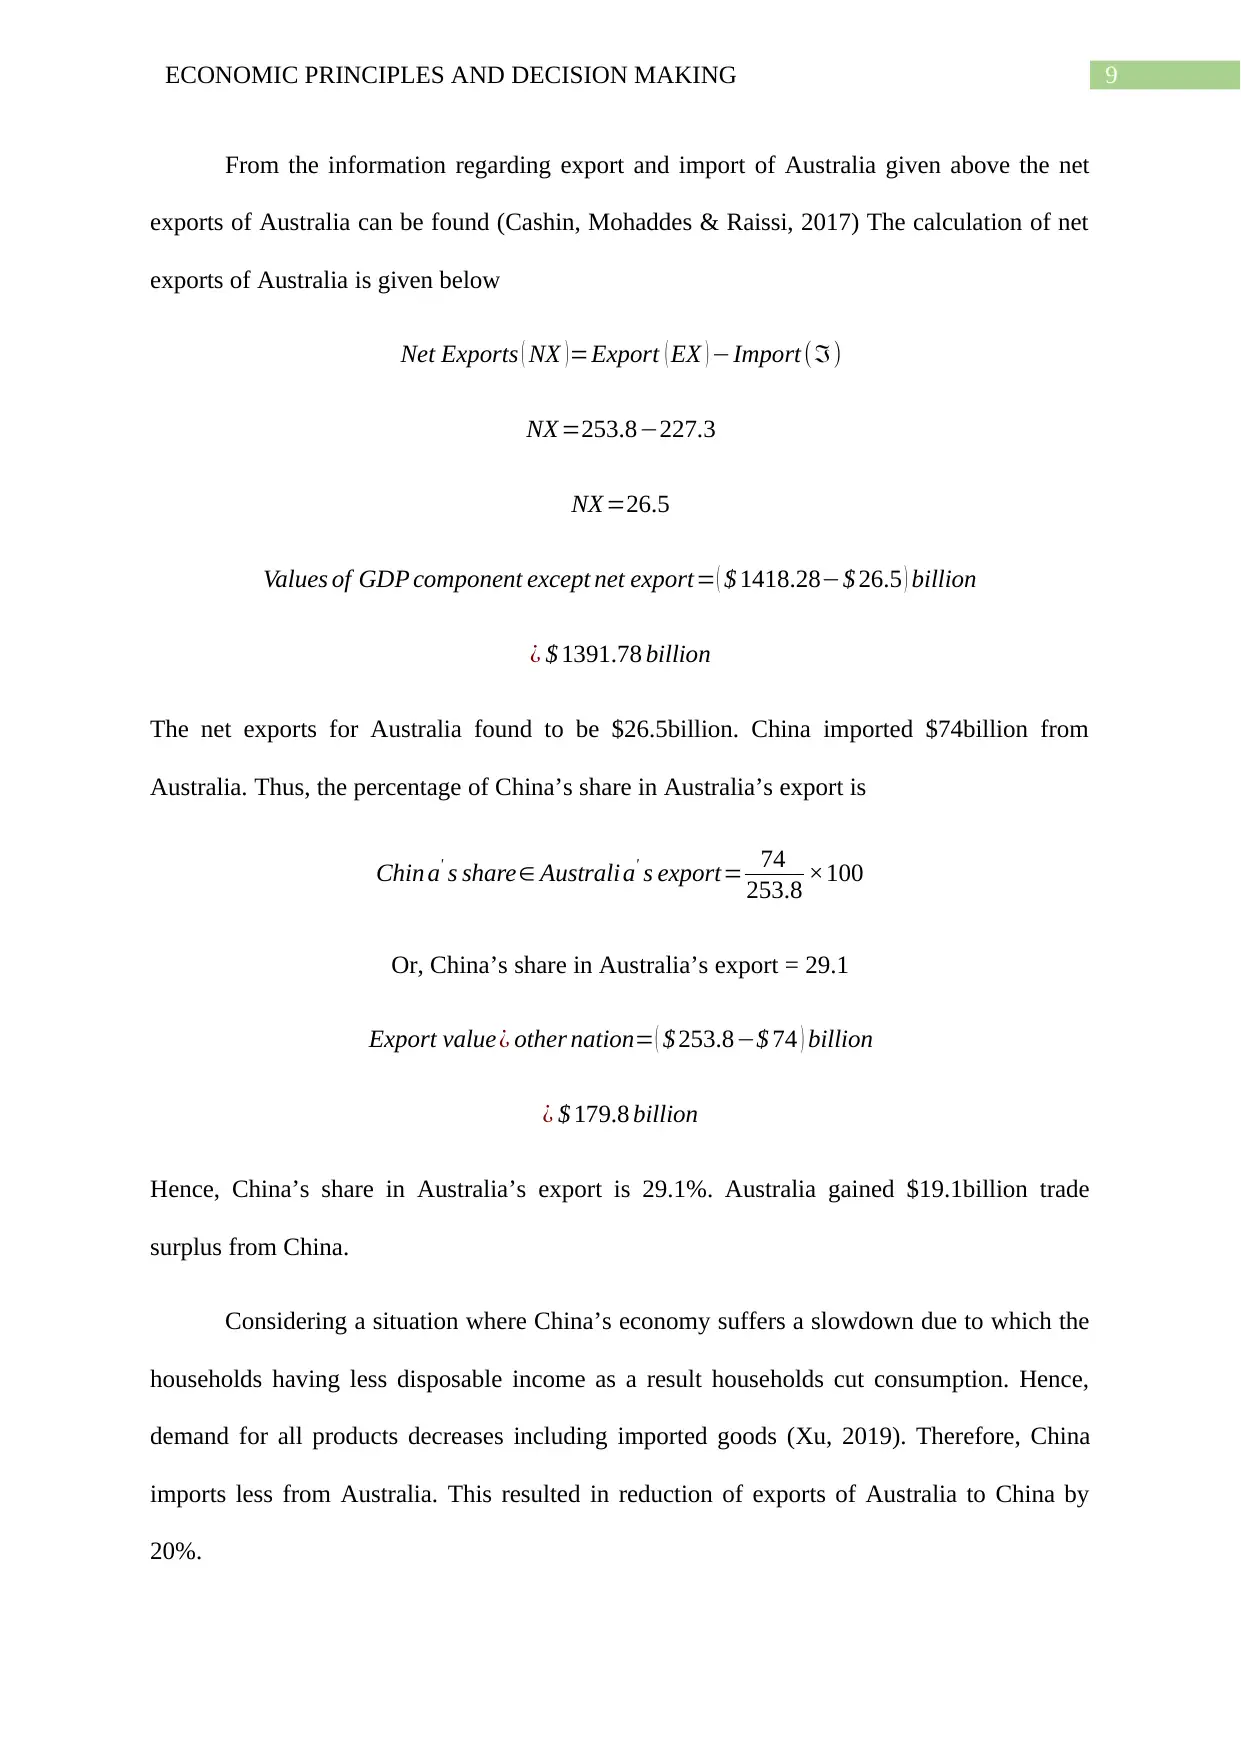
From the information regarding export and import of Australia given above the net
exports of Australia can be found (Cashin, Mohaddes & Raissi, 2017) The calculation of net
exports of Australia is given below
Net Exports ( NX ) =Export ( EX ) −Import (ℑ)
NX =253.8−227.3
NX =26.5
Values of GDP component except net export= ( $ 1418.28−$ 26.5 ) billion
¿ $ 1391.78 billion
The net exports for Australia found to be $26.5billion. China imported $74billion from
Australia. Thus, the percentage of China’s share in Australia’s export is
Chin a' s share∈ Australi a' s export= 74
253.8 ×100
Or, China’s share in Australia’s export = 29.1
Export value¿ other nation= ( $ 253.8−$ 74 ) billion
¿ $ 179.8 billion
Hence, China’s share in Australia’s export is 29.1%. Australia gained $19.1billion trade
surplus from China.
Considering a situation where China’s economy suffers a slowdown due to which the
households having less disposable income as a result households cut consumption. Hence,
demand for all products decreases including imported goods (Xu, 2019). Therefore, China
imports less from Australia. This resulted in reduction of exports of Australia to China by
20%.
Paraphrase This Document
Need a fresh take? Get an instant paraphrase of this document with our AI Paraphraser
10ECONOMIC PRINCIPLES AND DECISION MAKING
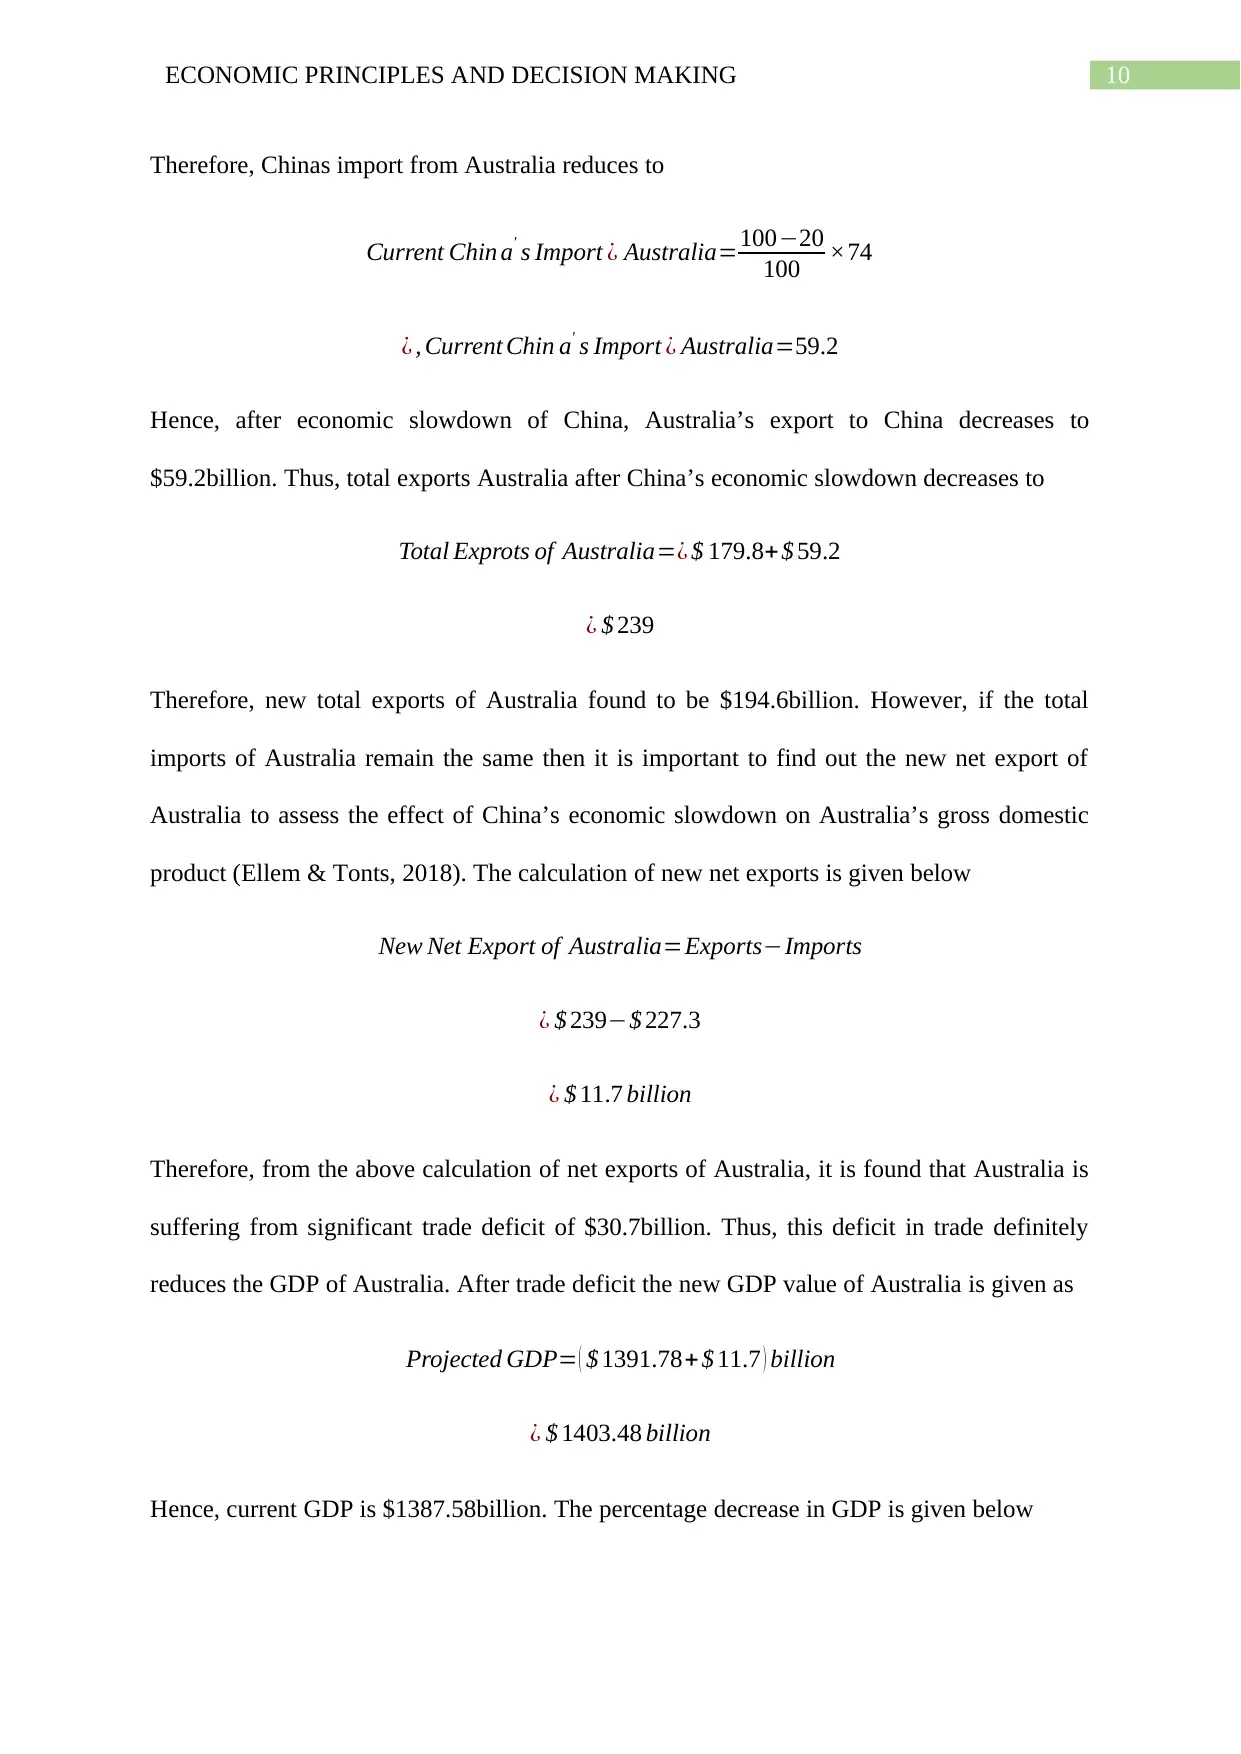
Therefore, Chinas import from Australia reduces to
Current Chin a' s Import ¿ Australia=100−20
100 ×74
¿ , Current Chin a' s Import ¿ Australia=59.2
Hence, after economic slowdown of China, Australia’s export to China decreases to
$59.2billion. Thus, total exports Australia after China’s economic slowdown decreases to
Total Exprots of Australia=¿ $ 179.8+ $ 59.2
¿ $ 239
Therefore, new total exports of Australia found to be $194.6billion. However, if the total
imports of Australia remain the same then it is important to find out the new net export of
Australia to assess the effect of China’s economic slowdown on Australia’s gross domestic
product (Ellem & Tonts, 2018). The calculation of new net exports is given below
New Net Export of Australia=Exports−Imports
¿ $ 239−$ 227.3
¿ $ 11.7 billion
Therefore, from the above calculation of net exports of Australia, it is found that Australia is
suffering from significant trade deficit of $30.7billion. Thus, this deficit in trade definitely
reduces the GDP of Australia. After trade deficit the new GDP value of Australia is given as
Projected GDP= ( $ 1391.78+ $ 11.7 ) billion
¿ $ 1403.48 billion
Hence, current GDP is $1387.58billion. The percentage decrease in GDP is given below
11ECONOMIC PRINCIPLES AND DECISION MAKING
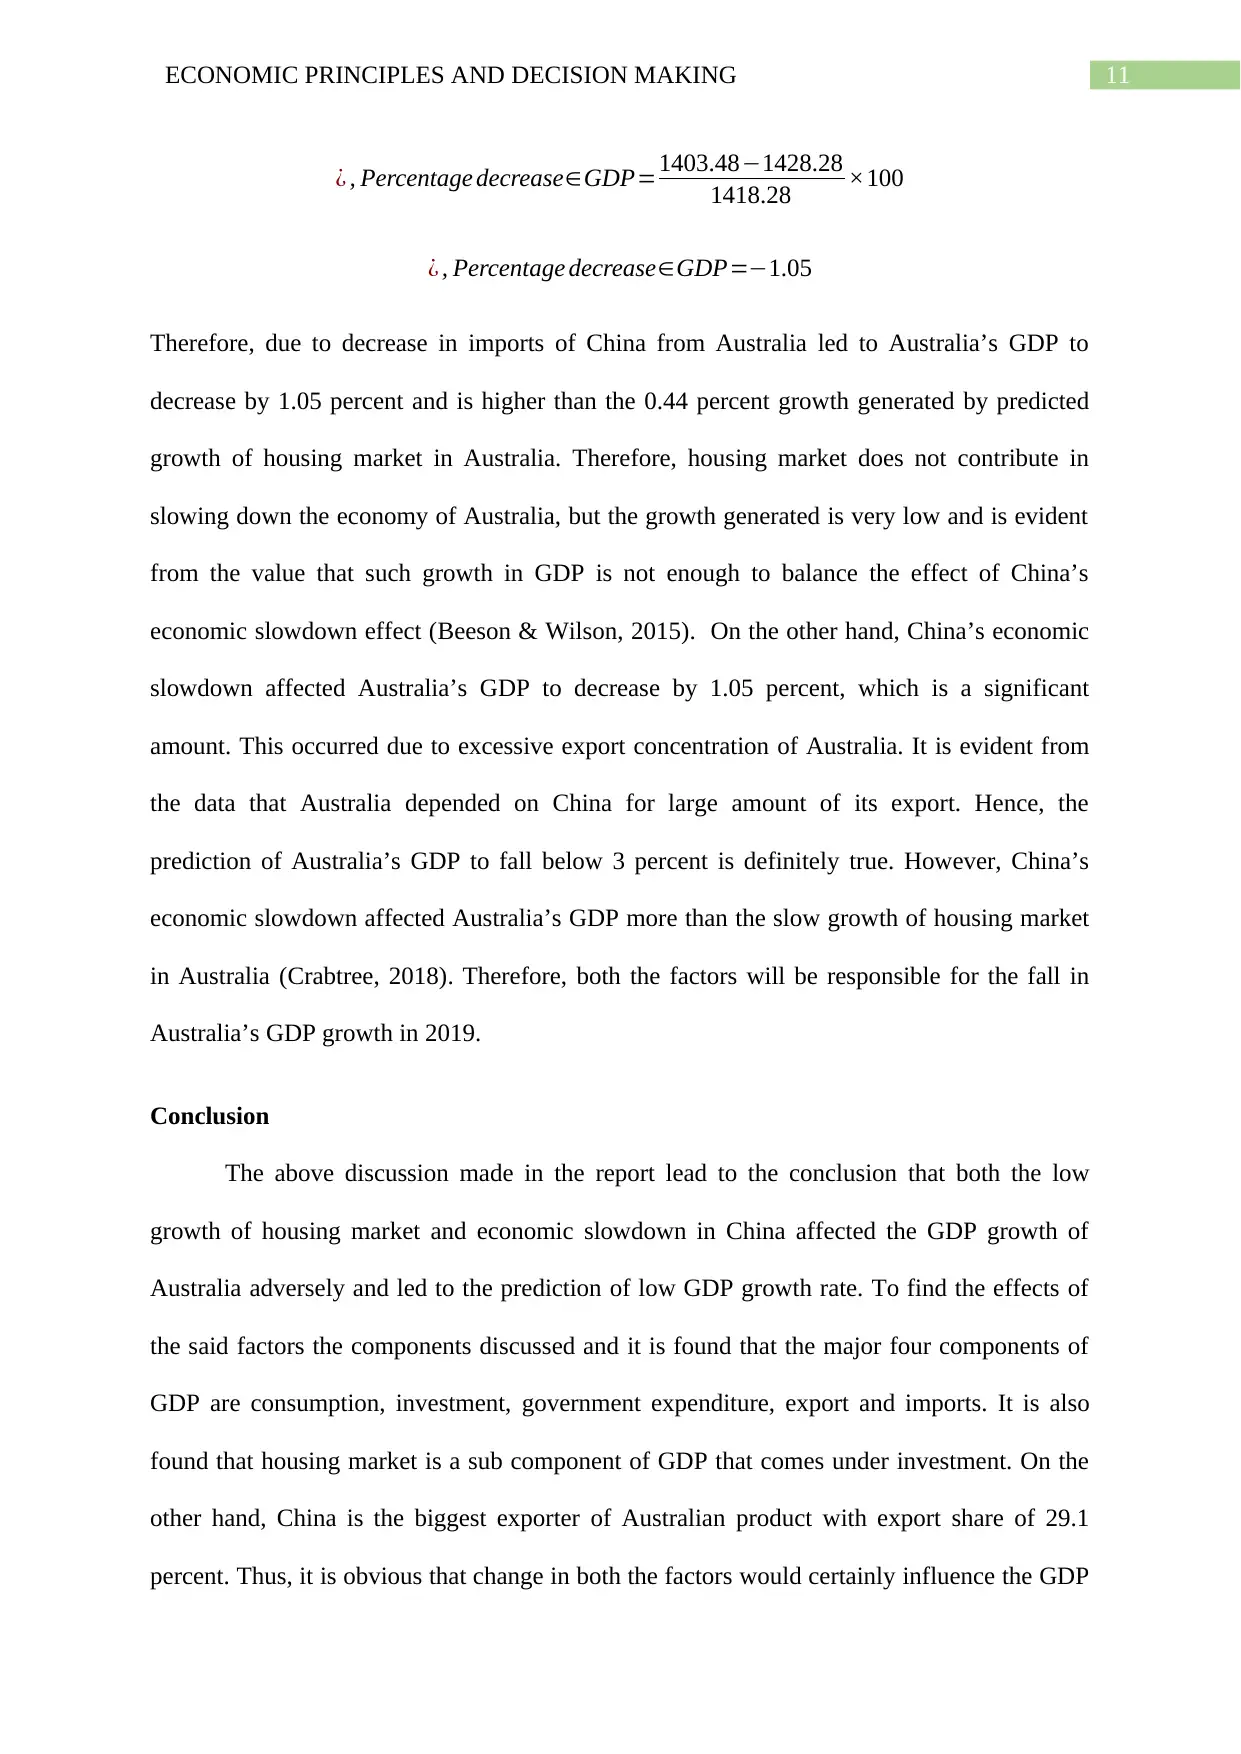
¿ , Percentage decrease∈GDP=1403.48−1428.28
1418.28 ×100
¿ , Percentage decrease∈GDP=−1.05
Therefore, due to decrease in imports of China from Australia led to Australia’s GDP to
decrease by 1.05 percent and is higher than the 0.44 percent growth generated by predicted
growth of housing market in Australia. Therefore, housing market does not contribute in
slowing down the economy of Australia, but the growth generated is very low and is evident
from the value that such growth in GDP is not enough to balance the effect of China’s
economic slowdown effect (Beeson & Wilson, 2015). On the other hand, China’s economic
slowdown affected Australia’s GDP to decrease by 1.05 percent, which is a significant
amount. This occurred due to excessive export concentration of Australia. It is evident from
the data that Australia depended on China for large amount of its export. Hence, the
prediction of Australia’s GDP to fall below 3 percent is definitely true. However, China’s
economic slowdown affected Australia’s GDP more than the slow growth of housing market
in Australia (Crabtree, 2018). Therefore, both the factors will be responsible for the fall in
Australia’s GDP growth in 2019.
Conclusion
The above discussion made in the report lead to the conclusion that both the low
growth of housing market and economic slowdown in China affected the GDP growth of
Australia adversely and led to the prediction of low GDP growth rate. To find the effects of
the said factors the components discussed and it is found that the major four components of
GDP are consumption, investment, government expenditure, export and imports. It is also
found that housing market is a sub component of GDP that comes under investment. On the
other hand, China is the biggest exporter of Australian product with export share of 29.1
percent. Thus, it is obvious that change in both the factors would certainly influence the GDP
⊘ This is a preview!⊘
Do you want full access?
Subscribe today to unlock all pages.
Trusted by 1+ million students worldwide
1 out of 16
Related Documents


Your All-in-One AI-Powered Toolkit for Academic Success.
+13062052269
info@desklib.com
Available 24*7 on WhatsApp / Email
![[object Object]](/_next/static/media/star-bottom.7253800d.svg)
Unlock your academic potential
Copyright © 2020–2026 A2Z Services. All Rights Reserved. Developed and managed by ZUCOL.