Service Industry Contribution to GDP and Australian Salary Analysis
VerifiedAdded on 2023/03/30
|23
|4496
|418
Report
AI Summary
This report investigates the relationship between the service industry's contribution to Australia's Gross Domestic Product (GDP) and the salary levels of employees within that sector. Using secondary data from 2001 to 2012, the study employs linear regression and correlation analysis to determine if a significant relationship exists and to assess its strength. The research aims to address whether the growth of the service industry influences average salaries and if future salaries can be predicted based on this relationship. The findings suggest a weak linear relationship, indicating that the service industry's contribution to GDP does not strongly correlate with employee salary levels in Australia. The report also acknowledges limitations and provides recommendations for future research.
Running head: GDP AND SALARY LEVEL 1
Australian Gross Domestic Product and Salary Levels:
Does the Contribution of Service Industry Towards Australian GDP Affect The Salary Levels of
Employees in the Service Industry?
Student Name
Institution
Australian Gross Domestic Product and Salary Levels:
Does the Contribution of Service Industry Towards Australian GDP Affect The Salary Levels of
Employees in the Service Industry?
Student Name
Institution
Paraphrase This Document
Need a fresh take? Get an instant paraphrase of this document with our AI Paraphraser
GDP AND SALARY LEVELS 2
Executive Summary
The main objective of the research study is to establish whether a significant relationship
exists between the contributions of service industry towards Australian GDP the salary levels in
the Australian service industry. The study also aimed at establishing the strength of the
relationship between the contributions of service industry towards Australian GDP the salary
levels in the Australian service industry.
Even though the previous critical literature does not address the issue of salary level of a
specific sector in an economy and the GDP growth sufficiently, many studies show that the
performance of an economy has no effect on income distribution. Previous research study shows
that the contribution specific industry sector of an economy does not affect the income
distribution and wage levels of employees working in the industry.
The data used in the research study was retrieved from secondary sources to determine
the relationship and the degree of strength between the contributions of service industry towards
Australian GDP the salary levels in the Australian service industry. The study results found out
that significant relationship contributions of service industry towards Australian GDP the salary
levels in the Australian service industry does not exist. The study concludes that a weak linear
relationship exist between contributions of service industry towards Australian GDP and the
salary levels of employees working in the Australian service industry.
GDP AND SALARY LEVELS 3
Table of Contents
1.0 Introduction 4
1.1 Problem Statement 5
1.2 Research Aims 6
1.2.1 Research objectives 6
2.0 Critical Literature Review 7
3.0 Methodology 9
3.1 Data Collection 9
3.2 Data Description 9
3.3 Data Analysis Techniques 9
3.3.1 The Linear Regression and Correlation Analysis 10
3.3.2 The Assumption of Linear Regression Analysis 11
4.0 Findings and Data Analysis 12
4.1 Descriptive Statistics 12
4.2 Correlation Analysis 12
4.3 Regression Analysis 13
4.4 Findings 14
5.0 Conclusion 17
5.1 Addressing Research Aims and Questions 17
5.2 Limitations 18
5.2 Recommendations 18
6.0 References19
⊘ This is a preview!⊘
Do you want full access?
Subscribe today to unlock all pages.
Trusted by 1+ million students worldwide
GDP AND SALARY LEVELS 4
1.0 Introduction
The Australian economy is dependent on several sectors including construction, service
industry, agriculture, and manufacturing industries. In ancient times, the Australian economy
depended greatly on the production of goods for export. However, structural changes to the
Australian economy over time changed the economy from a goods-producing economy to a
service-based economy (Herrendorf, Rogerson & Valentinyi, 2014). Today, Australians are
consuming more services, producing more services, and exporting more specialized services to
foreign countries than in the last decade. For this reason, the Australian economy witnessed a
shift from the production of the goods economy to the service-reliant economy.
The remarkable rise of the real incomes of Australians is one of the main reasons for the
shift from a good-producing economy to a service-based economy. Since the 1960s, Australia
realized a continuous and uninterrupted economic growth for over 25 years. During this period
of excellent economic growth, the real income per household grew by two-fold. Consequently,
Australian households spent more of their income to access services. According to (Connolly &
C Lewis, 2010; McLachlan, Clark & Monday, 2002), a significant increase in income per
household in Australia resulted in higher expenditures on services such as education, health, and
food than on goods.
The demand for business-related services increased as the Australian economy shifted to
a service-based economy. With fast technological advancements in the last decade,
communication is more much easier and more effective compared to ancient times. Such
improvements in communication channels serve as an excellent tool for sales and marketing for
Australian business services within the borders and across the borders. OECD (2017) statistics
show that the service industry contributes approximately 61% of the Australian economy.
Paraphrase This Document
Need a fresh take? Get an instant paraphrase of this document with our AI Paraphraser
GDP AND SALARY LEVELS 5
Therefore, the service industry is the biggest contributor and the main source of employment for
most Australians.
1.1 Problem Statement
The Australian economy is very large, often referred to as a mixed market economy
averaging 1.69 trillion Australian dollars in 2017 (Rohner, 2018). As a result, the Australian
economy was ranked the 13th best economy in terms of nominal GDP across the world.
Additionally, the 2018 economic statistics indicate that Australia had the highest median wealth
per adult, which resulted from the 25-year uninterrupted economic growth (Sier, 2016).
Arguably, Australia 25-year uninterrupted eco0nomuc growth ranks as the best consistent and
uninterrupted economic growth in the world. Today, Australia income per household is very high
such that almost every household can access and pay for business services without much
struggle.
Moreover, the most dominant sector of the Australian GDP is the service industry sector,
which employs 79.2% of the working Australia workforce (“The World Investment Report
2017”, 2017). Even though 79% of the working labor force in Australia work in the service
industry and the service industry is the main contributor of the Australian economy, the question
of whether the corresponding growth of service industry affects the average salary of staff
working in the service industry. The question of whether an employee salary in the service
industry increases or decreases with the rate of the service industry is equally important in the
prediction of employee salaries in the future. Additionally, understanding the relationship
between the service industry contribution to the Australian GDP and the employee remuneration
assists in projecting future profits
GDP AND SALARY LEVELS 6
1.2 Research Aims
The main objective of the research study is to establish whether a significant relationship exists
between the contributions of service industry towards Australian GDP the salary levels in the
Australian service industry.
1.2.1 Research Objectives
The research aim at answering the following two questions:
i) Is there a significant relationship between the contribution of service industry towards
Australian GDP and the salary levels in the Australian service industry?
ii) If a linear relationship exists between the contribution of service industry towards
Australian GDP and the salary levels in the Australian service industry, how strong is
the relationship?
iii) Is the relationship between the growth of the service industry and average salaries of
employees strong enough to predict future salaries?
⊘ This is a preview!⊘
Do you want full access?
Subscribe today to unlock all pages.
Trusted by 1+ million students worldwide
GDP AND SALARY LEVELS 7
2.0 Critical Literature Review
Recent research studies do not provide a significant evidence of the relationship between
a specific sector contribution to a country’s economic growth and employees wage levels in the
specific economic sector. However, in mid-1990s, substantial recent studies showed that
economic growth hurt income inequality. Deininger & Squire (1996) conducted a quality test on
GDP data and average employees’ wages, and Gini coefficient data to determine whether income
inequality, wage levels, and economic growth in measured in GDP are related in any way. The
study findings showed that little or no relationship between the GDP performance of an
economy, wage levels, and income inequality.
Panizza (2002) set up a research study to determine if unequal income distribution and
the economic growth in GDP are related. Panizza’s study, which employed a cross-state panel
for the U.S found that unequal income distribution and the economic growth in GDP are not
positively correlated. However, unequal income distribution and the economic growth in GDP
are negatively correlated. Moreover, negative correlation between economic growth and income
inequality is not robust and small differences in income inequality measurement methods result
in large differences in the process of estimating the correlation between income inequality and
GDP performance of a country (Hummels, Ishii & K-M Yi, 2001; Manalo & Orsmond, 2013;
Los, Timmer & Vries, 2015; Timmer, Eurmban, Los, Stehrer & De Vries, 2014).
Johnson & Noguera (2012) and Dollar & Kray (2000) conducted a similar research study
which found out that average economic growth affected the poor segment of society but no
significant relations between unequal income distribution and economic performance. The
income levels of the low earning segment of an economy changed about the average or minimum
Paraphrase This Document
Need a fresh take? Get an instant paraphrase of this document with our AI Paraphraser
GDP AND SALARY LEVELS 8
wage levels of an economy (Heath, 2016; Francois, Manchin & Tomberger, 2015; Kelly & La
Cava, 2014).
Efforts to determine the benefit economic growth offers to the wage earners in any
economy proves that no relationship between significant returns for wage earners from economic
growth. According to Rayner & Bishop, (2013), Berlingieri (2013) and Weisbrot et al. (2000),
the poor segment of society and the lowest minimum wage earners never exploit the economic
growth returns. Therefore, economic growth has fewer benefits to minimum wage earners in
terms of salary levels. A relatively similar research study where Tabassum & Majeed (2008)
analyzed sample data for 69 third world economy countries showed that unequal income
distribution positively affects economic growth in the short run, however, in the long run,
unequal distribution of income derails economic growth.
The shape of the income distribution graph has been used by economists to describe the
economic growth of countries. Bartel, Lach & Sicherman, (2014) and Voitchovsky (2005)
conducted a study to understand, evaluate, and elaborate how useful the income distribution
graph was in the prediction a country's economic performance. Voitchovsky’s study utilized
Luxembourg income study data for in the study. The study findings showed that income
inequality in the upper part of the U-shaped curve suggests that income inequality increases with
an increase in economic growth. In contrast, at the low bottom of the curve indicate that income
inequality is decrease with a decrease in GDP. Positive and negative correlation between income
distribution and the GDP (economic growth) is associated with gradient value of the income
distribution curve (Autor, Levy & Murnane, 2003; Antràs, Chor, Fally & Hillberry, 2012).
Mostly, the upper parts of the curve were associated with positive economic growth, while the
lower and bottom parts of the curve were associated with negative economic growth.
GDP AND SALARY LEVELS 9
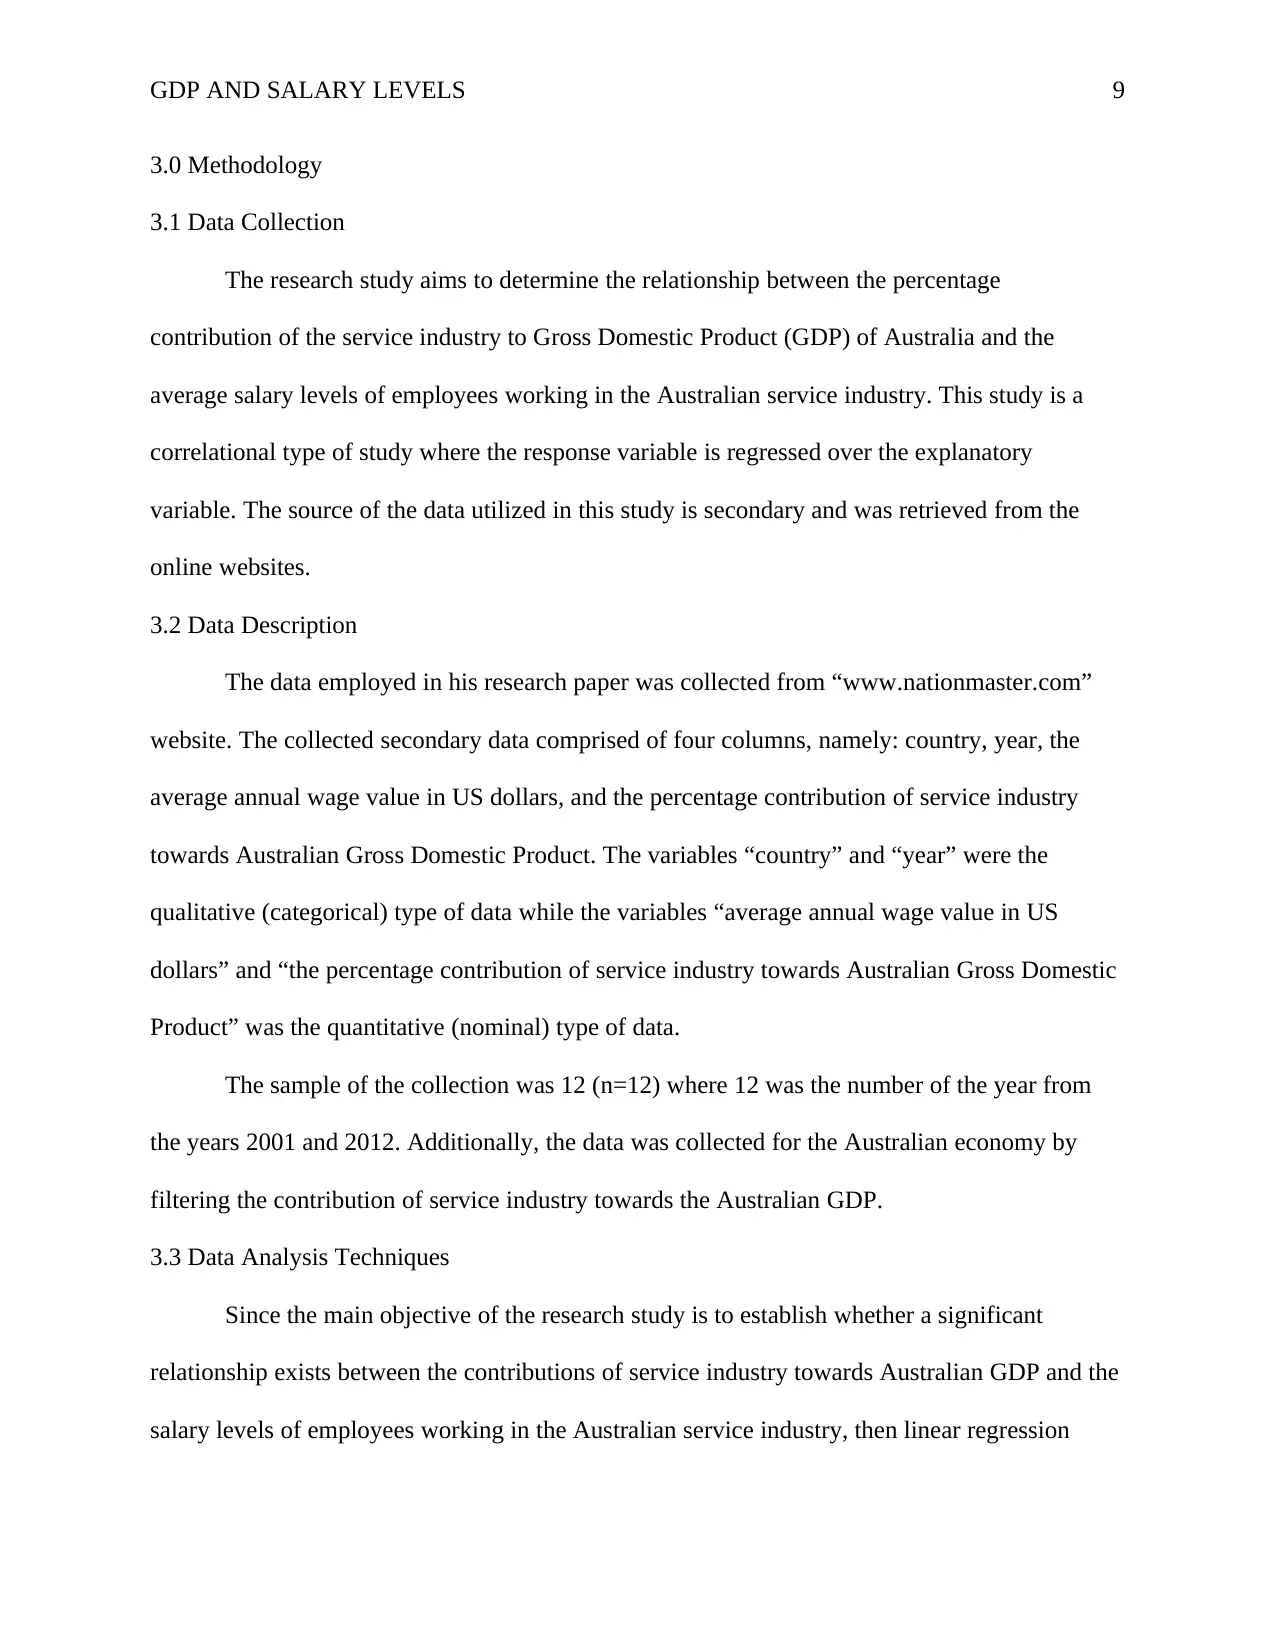
3.0 Methodology
3.1 Data Collection
The research study aims to determine the relationship between the percentage
contribution of the service industry to Gross Domestic Product (GDP) of Australia and the
average salary levels of employees working in the Australian service industry. This study is a
correlational type of study where the response variable is regressed over the explanatory
variable. The source of the data utilized in this study is secondary and was retrieved from the
online websites.
3.2 Data Description
The data employed in his research paper was collected from “www.nationmaster.com”
website. The collected secondary data comprised of four columns, namely: country, year, the
average annual wage value in US dollars, and the percentage contribution of service industry
towards Australian Gross Domestic Product. The variables “country” and “year” were the
qualitative (categorical) type of data while the variables “average annual wage value in US
dollars” and “the percentage contribution of service industry towards Australian Gross Domestic
Product” was the quantitative (nominal) type of data.
The sample of the collection was 12 (n=12) where 12 was the number of the year from
the years 2001 and 2012. Additionally, the data was collected for the Australian economy by
filtering the contribution of service industry towards the Australian GDP.
3.3 Data Analysis Techniques
Since the main objective of the research study is to establish whether a significant
relationship exists between the contributions of service industry towards Australian GDP and the
salary levels of employees working in the Australian service industry, then linear regression
⊘ This is a preview!⊘
Do you want full access?
Subscribe today to unlock all pages.
Trusted by 1+ million students worldwide
GDP AND SALARY LEVELS 10
analysis was the best data analysis test. Additionally, the study aimed at establishing the degree
of strength of the relationship between the Australian GDP and the salary levels in the Australian
service industry. The estimated regression model will be used to predict future salaries of
employees working in the Australian service industry.
The most suitable statistical package to analyze the collected data was “statistical
package for social science” version 21.0 (SPSS). The collected data was imported to SPSS, and
simple linear regression analysis and correlation analysis was conducted. During the process of
regression analysis, the variable “contributions of service industry towards Australian GDP the
salary levels in the Australian service industry” was the independent variable (explanatory) while
the “the average salaries of employees working in the Australian service industry” was the
response variable (dependent variable).
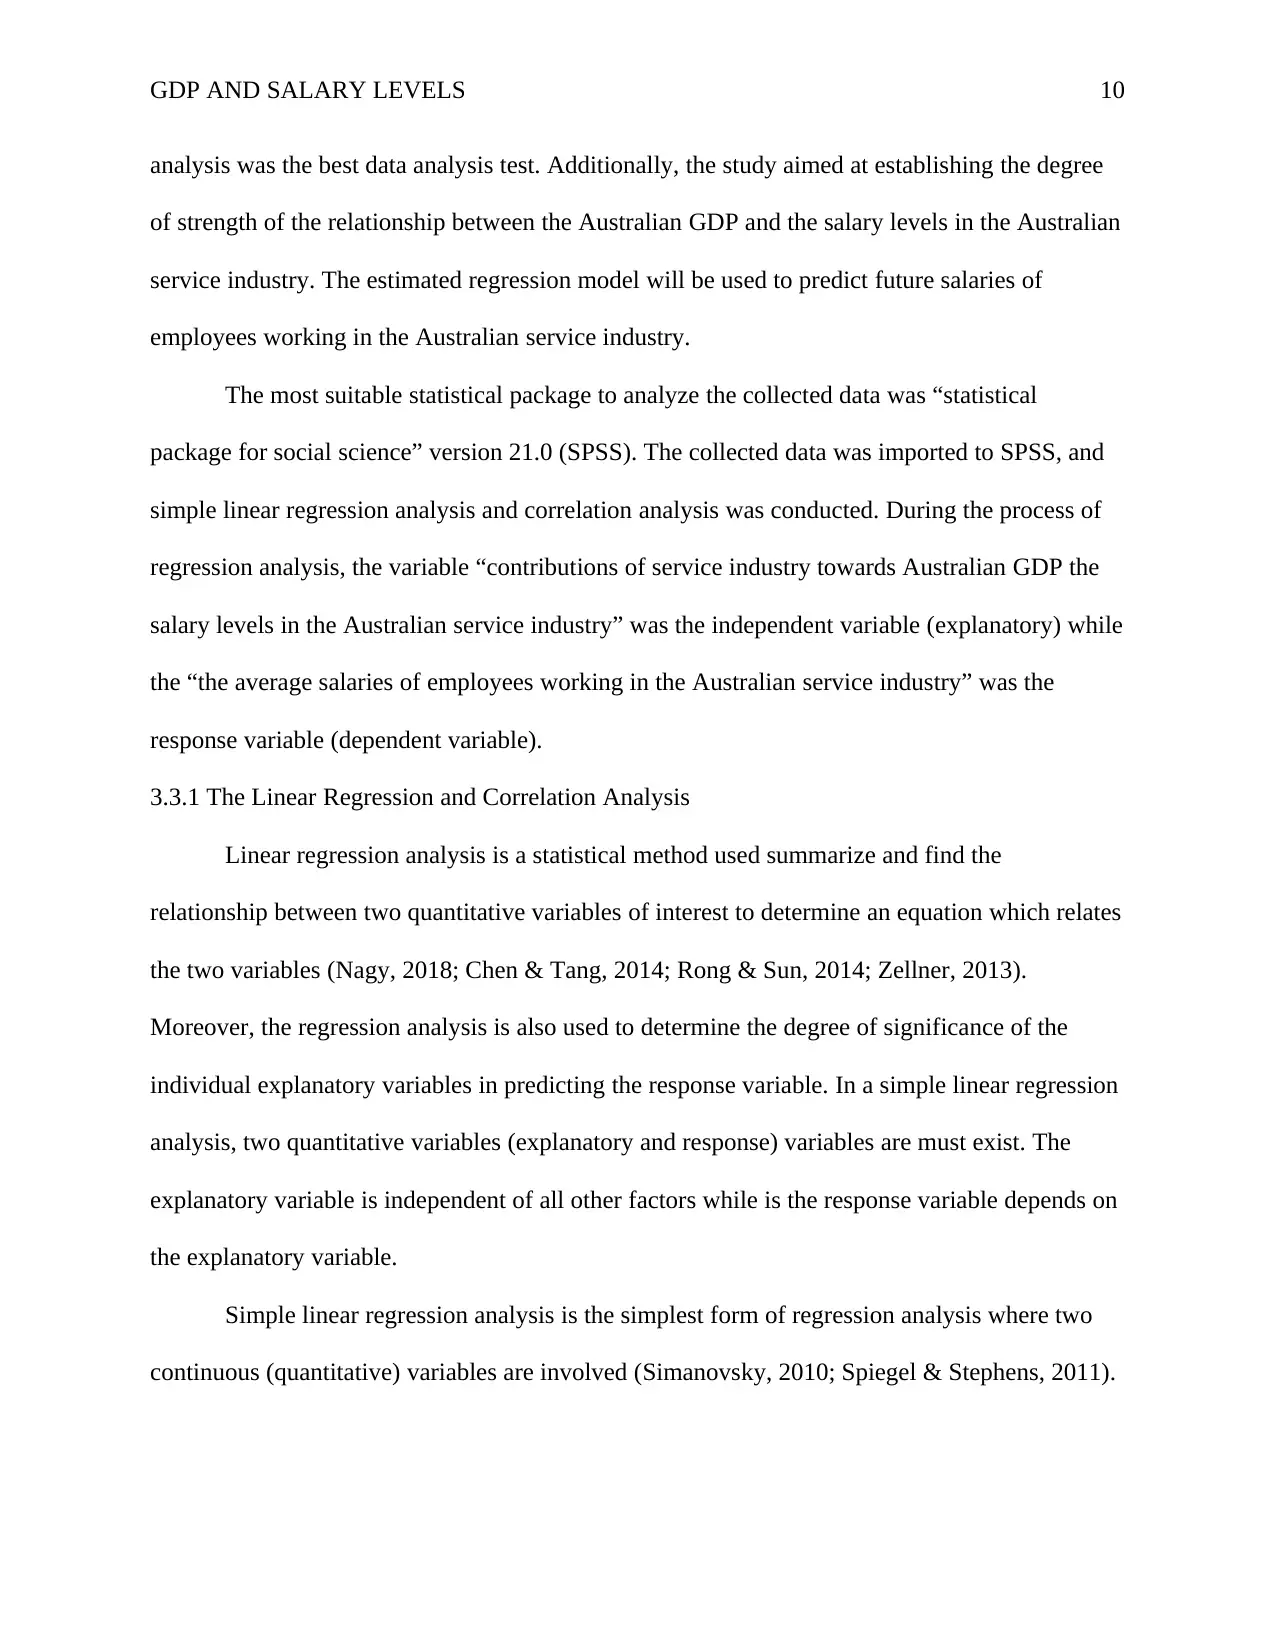
3.3.1 The Linear Regression and Correlation Analysis
Linear regression analysis is a statistical method used summarize and find the
relationship between two quantitative variables of interest to determine an equation which relates
the two variables (Nagy, 2018; Chen & Tang, 2014; Rong & Sun, 2014; Zellner, 2013).
Moreover, the regression analysis is also used to determine the degree of significance of the
individual explanatory variables in predicting the response variable. In a simple linear regression
analysis, two quantitative variables (explanatory and response) variables are must exist. The
explanatory variable is independent of all other factors while is the response variable depends on
the explanatory variable.
Simple linear regression analysis is the simplest form of regression analysis where two
continuous (quantitative) variables are involved (Simanovsky, 2010; Spiegel & Stephens, 2011).
analysis was the best data analysis test. Additionally, the study aimed at establishing the degree
of strength of the relationship between the Australian GDP and the salary levels in the Australian
service industry. The estimated regression model will be used to predict future salaries of
employees working in the Australian service industry.
The most suitable statistical package to analyze the collected data was “statistical
package for social science” version 21.0 (SPSS). The collected data was imported to SPSS, and
simple linear regression analysis and correlation analysis was conducted. During the process of
regression analysis, the variable “contributions of service industry towards Australian GDP the
salary levels in the Australian service industry” was the independent variable (explanatory) while
the “the average salaries of employees working in the Australian service industry” was the
response variable (dependent variable).
3.3.1 The Linear Regression and Correlation Analysis
Linear regression analysis is a statistical method used summarize and find the
relationship between two quantitative variables of interest to determine an equation which relates
the two variables (Nagy, 2018; Chen & Tang, 2014; Rong & Sun, 2014; Zellner, 2013).
Moreover, the regression analysis is also used to determine the degree of significance of the
individual explanatory variables in predicting the response variable. In a simple linear regression
analysis, two quantitative variables (explanatory and response) variables are must exist. The
explanatory variable is independent of all other factors while is the response variable depends on
the explanatory variable.
Simple linear regression analysis is the simplest form of regression analysis where two
continuous (quantitative) variables are involved (Simanovsky, 2010; Spiegel & Stephens, 2011).
Paraphrase This Document
Need a fresh take? Get an instant paraphrase of this document with our AI Paraphraser
GDP AND SALARY LEVELS 11
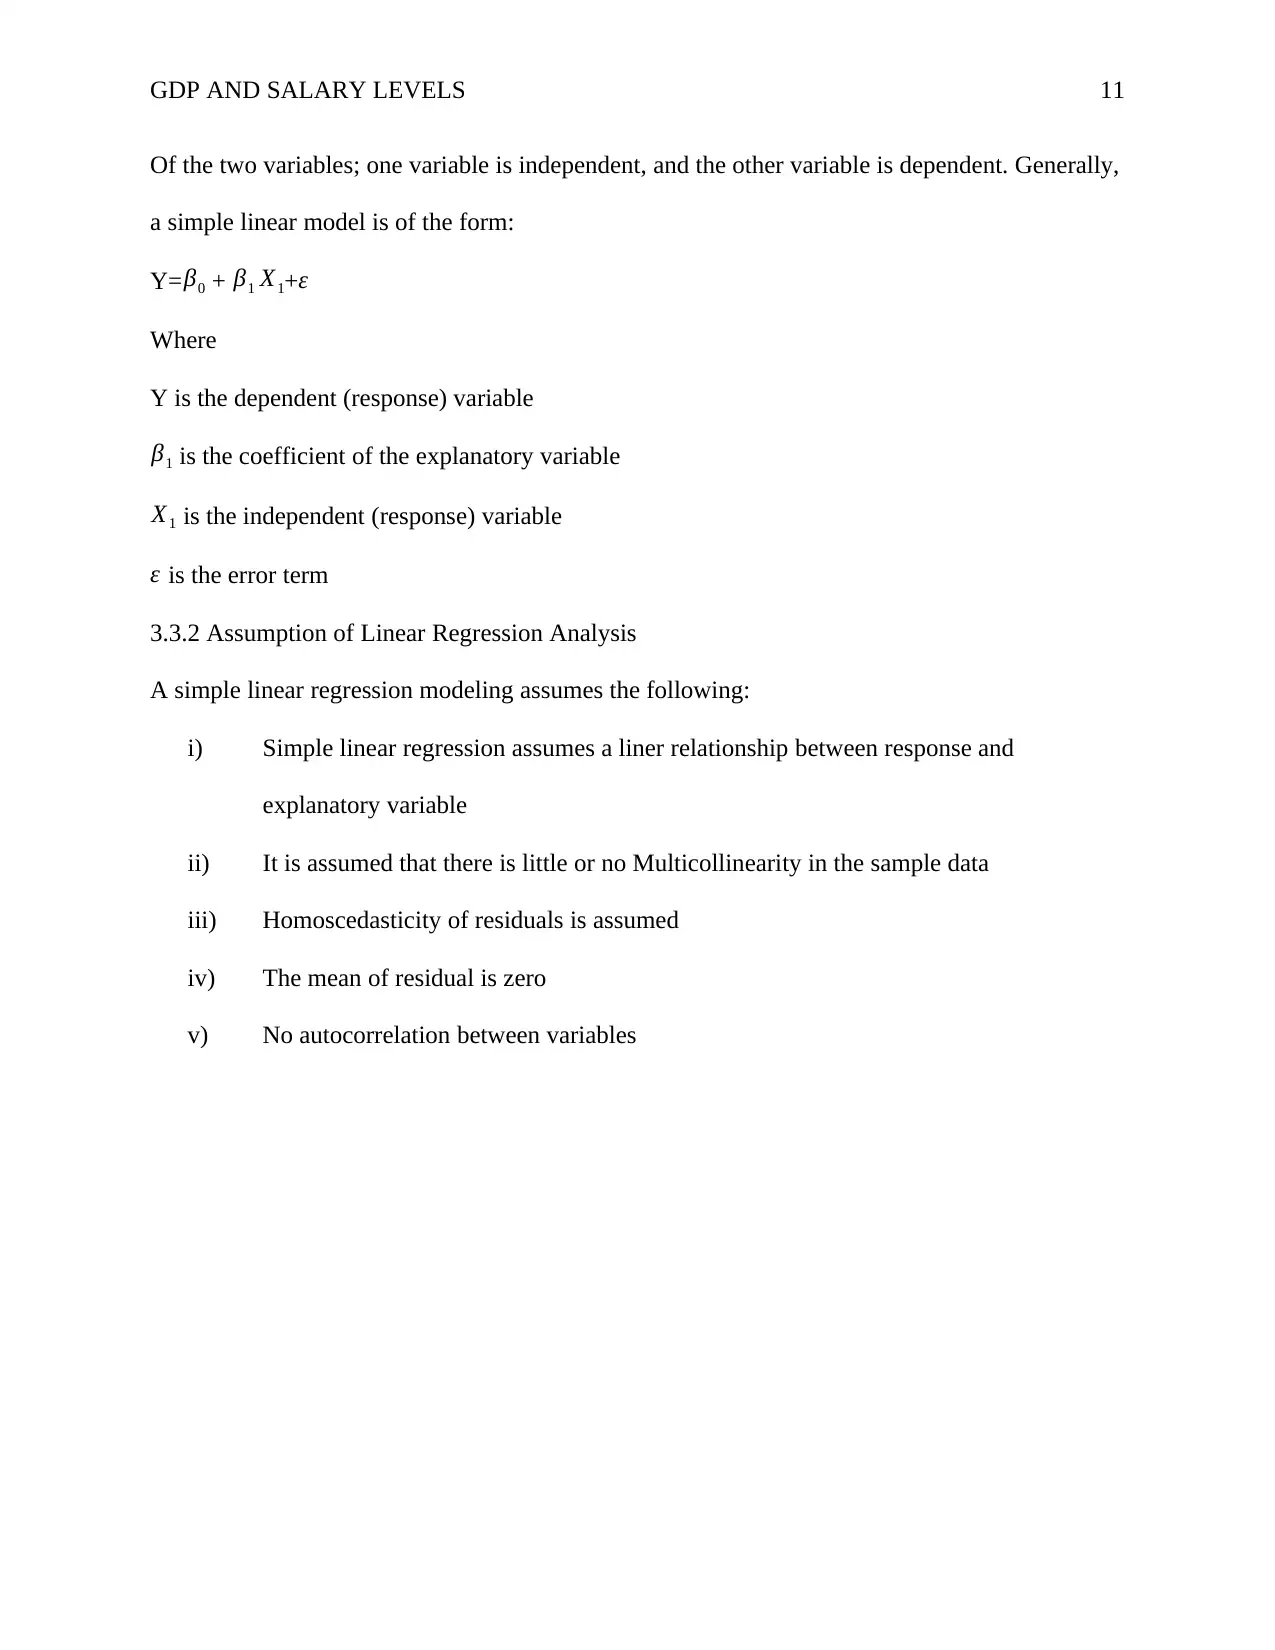
Of the two variables; one variable is independent, and the other variable is dependent. Generally,
a simple linear model is of the form:
Y=β0 + β1 X1+ε
Where
Y is the dependent (response) variable
β1 is the coefficient of the explanatory variable
X1 is the independent (response) variable
ε is the error term
3.3.2 Assumption of Linear Regression Analysis
A simple linear regression modeling assumes the following:
i) Simple linear regression assumes a liner relationship between response and
explanatory variable
ii) It is assumed that there is little or no Multicollinearity in the sample data
iii) Homoscedasticity of residuals is assumed
iv) The mean of residual is zero
v) No autocorrelation between variables
GDP AND SALARY LEVELS 12
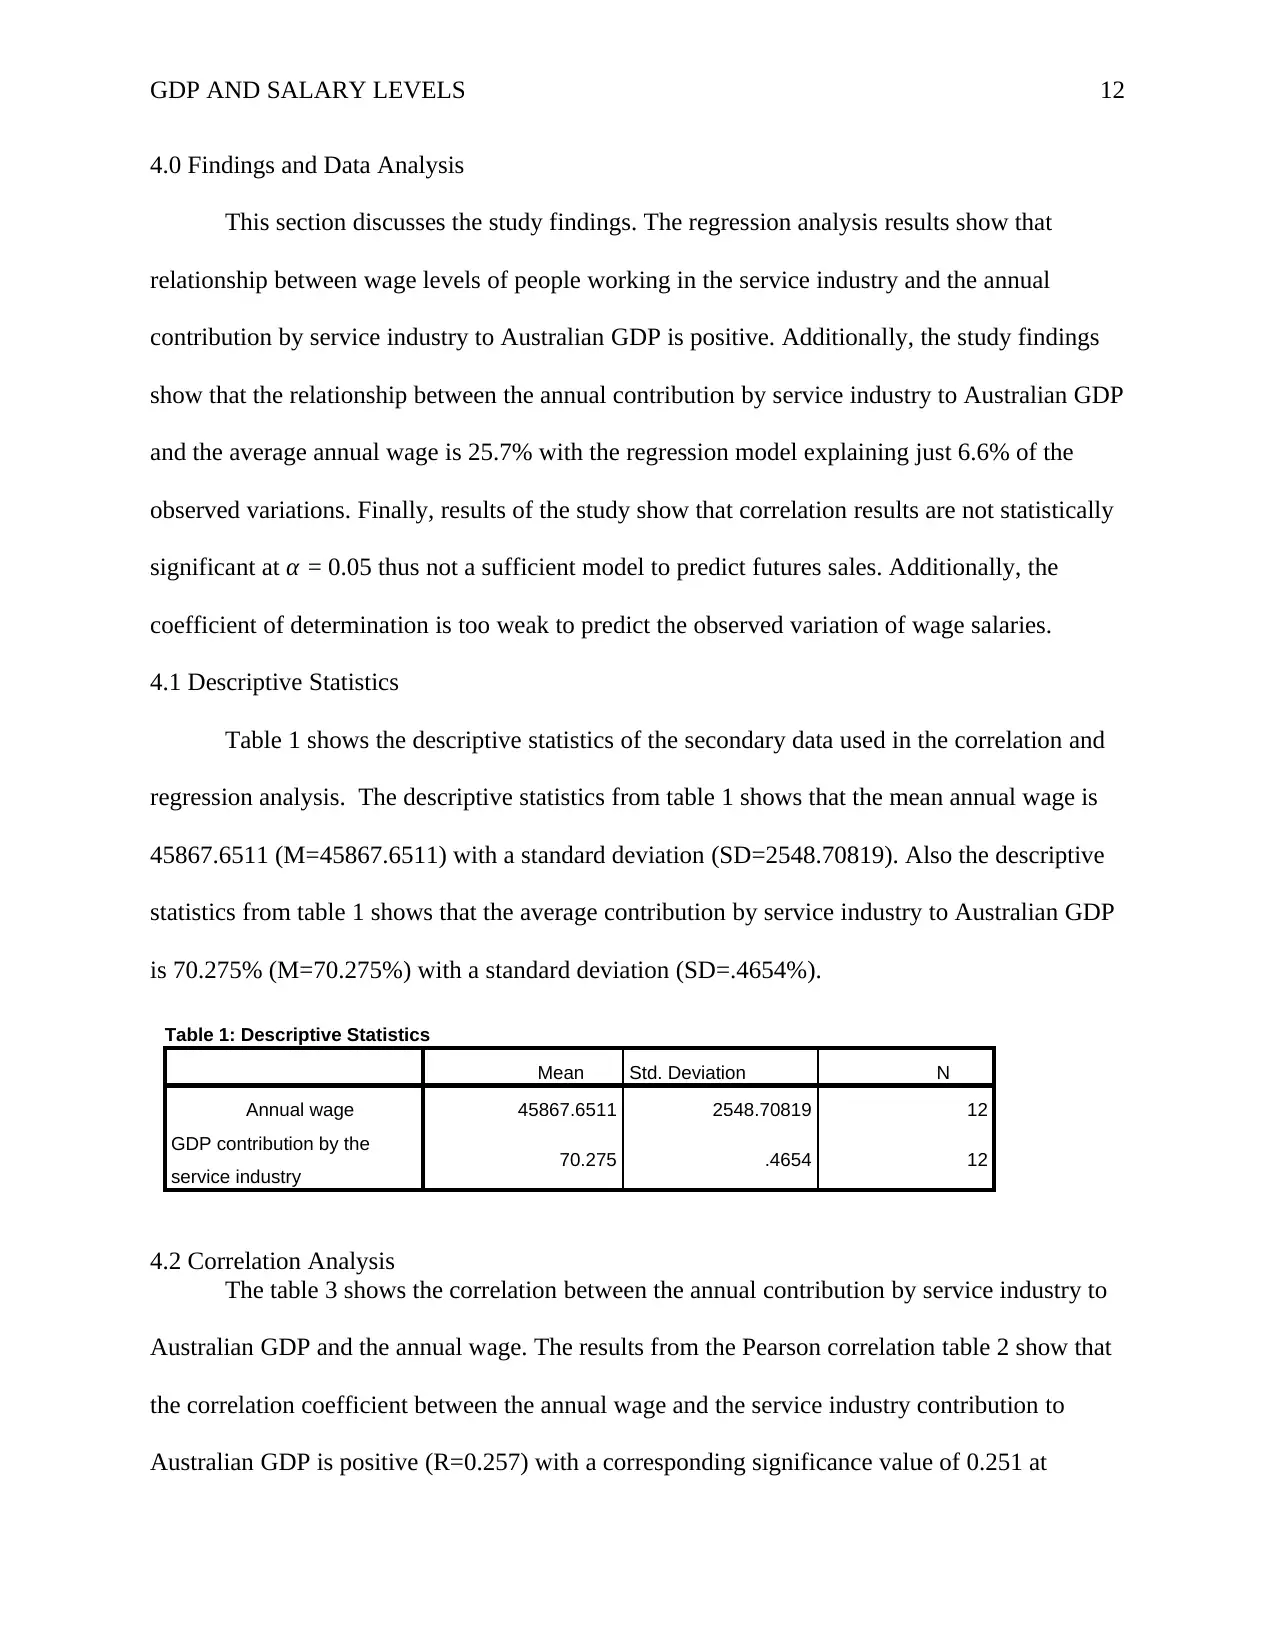
4.0 Findings and Data Analysis
This section discusses the study findings. The regression analysis results show that
relationship between wage levels of people working in the service industry and the annual
contribution by service industry to Australian GDP is positive. Additionally, the study findings
show that the relationship between the annual contribution by service industry to Australian GDP
and the average annual wage is 25.7% with the regression model explaining just 6.6% of the
observed variations. Finally, results of the study show that correlation results are not statistically
significant at α = 0.05 thus not a sufficient model to predict futures sales. Additionally, the
coefficient of determination is too weak to predict the observed variation of wage salaries.
4.1 Descriptive Statistics
Table 1 shows the descriptive statistics of the secondary data used in the correlation and
regression analysis. The descriptive statistics from table 1 shows that the mean annual wage is
45867.6511 (M=45867.6511) with a standard deviation (SD=2548.70819). Also the descriptive
statistics from table 1 shows that the average contribution by service industry to Australian GDP
is 70.275% (M=70.275%) with a standard deviation (SD=.4654%).
Table 1: Descriptive Statistics
Mean Std. Deviation N
Annual wage 45867.6511 2548.70819 12
GDP contribution by the
service industry 70.275 .4654 12
4.2 Correlation Analysis
The table 3 shows the correlation between the annual contribution by service industry to
Australian GDP and the annual wage. The results from the Pearson correlation table 2 show that
the correlation coefficient between the annual wage and the service industry contribution to
Australian GDP is positive (R=0.257) with a corresponding significance value of 0.251 at
⊘ This is a preview!⊘
Do you want full access?
Subscribe today to unlock all pages.
Trusted by 1+ million students worldwide
1 out of 23
Related Documents


Your All-in-One AI-Powered Toolkit for Academic Success.
+13062052269
info@desklib.com
Available 24*7 on WhatsApp / Email
![[object Object]](/_next/static/media/star-bottom.7253800d.svg)
Unlock your academic potential
Copyright © 2020–2026 A2Z Services. All Rights Reserved. Developed and managed by ZUCOL.