Analyzing the Global Economy: Trade, GDP, and Economic Indicators

Verified

Added on  2020/05/28

|30
|4007
|40
Homework Assignment
AI Summary
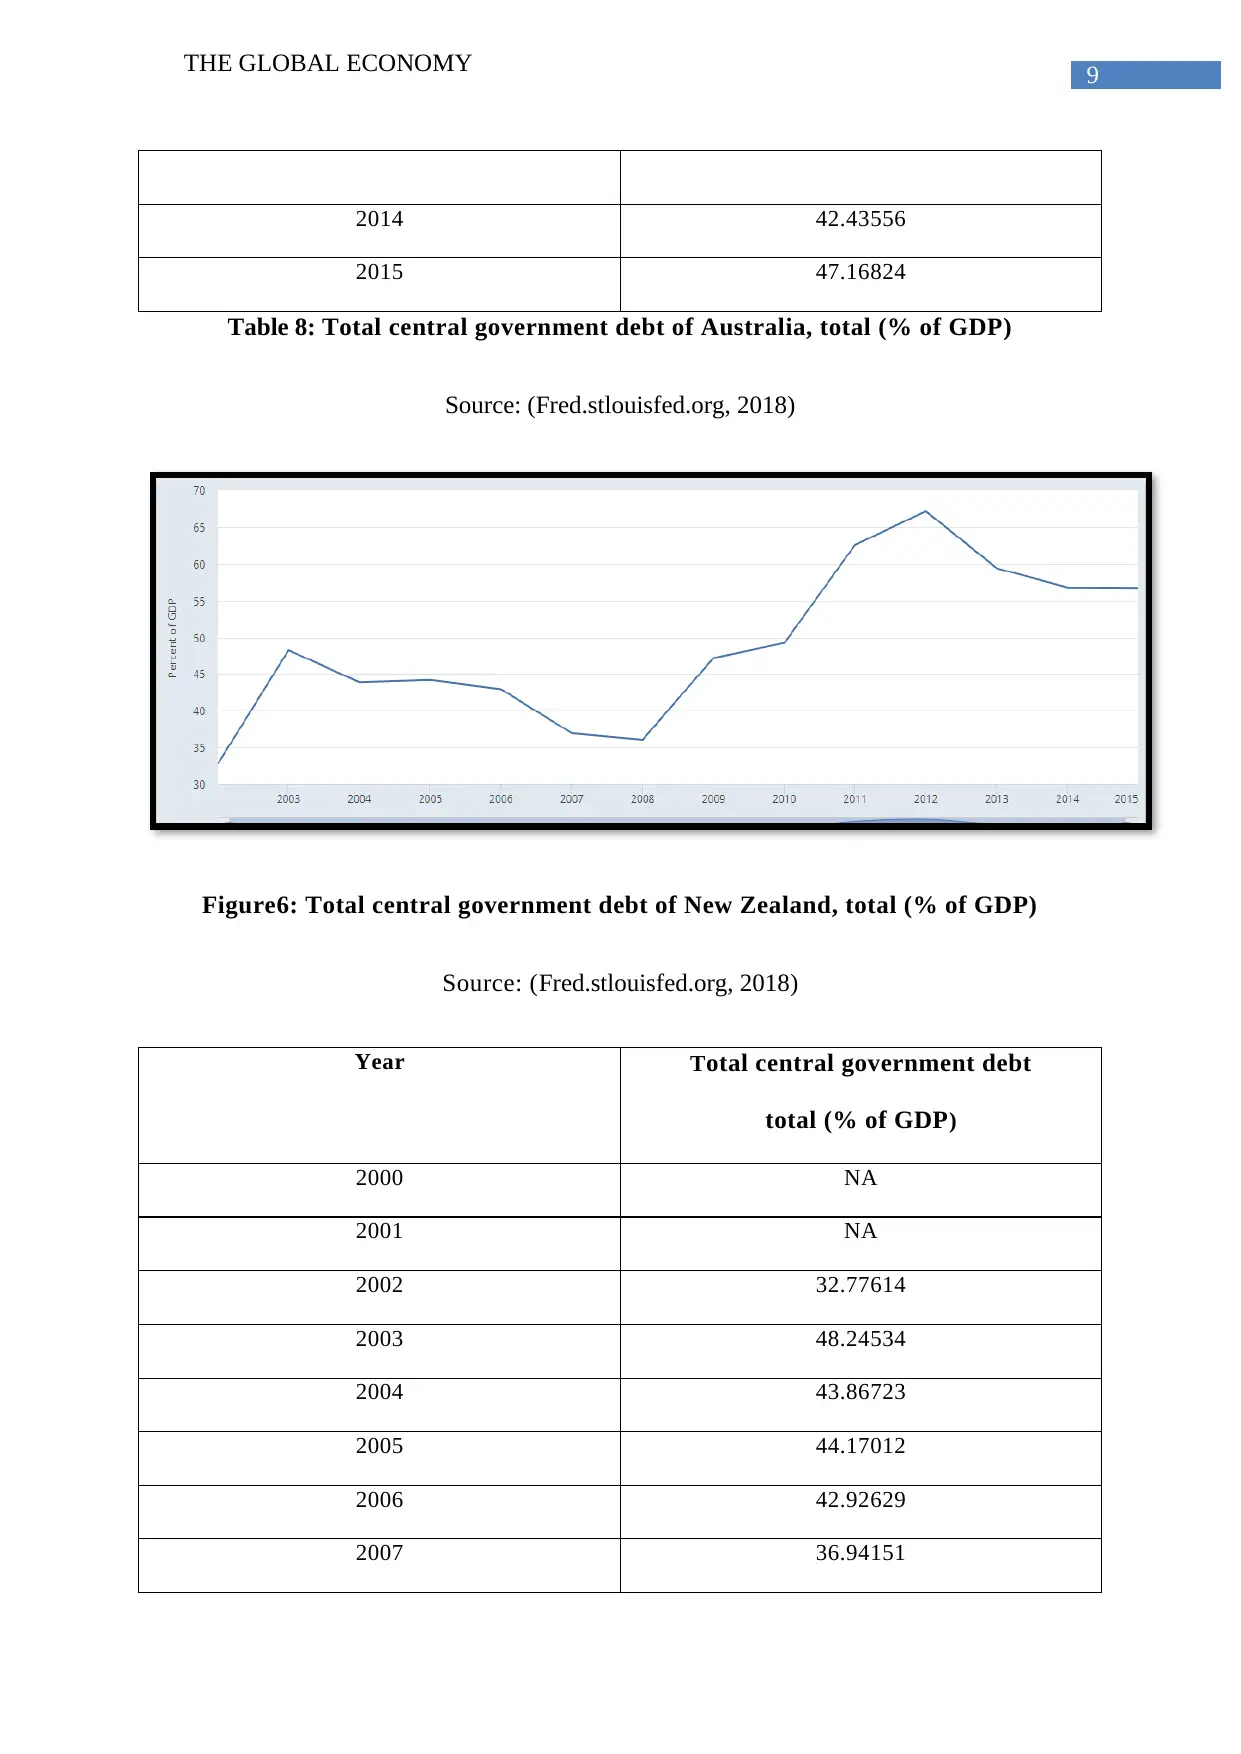
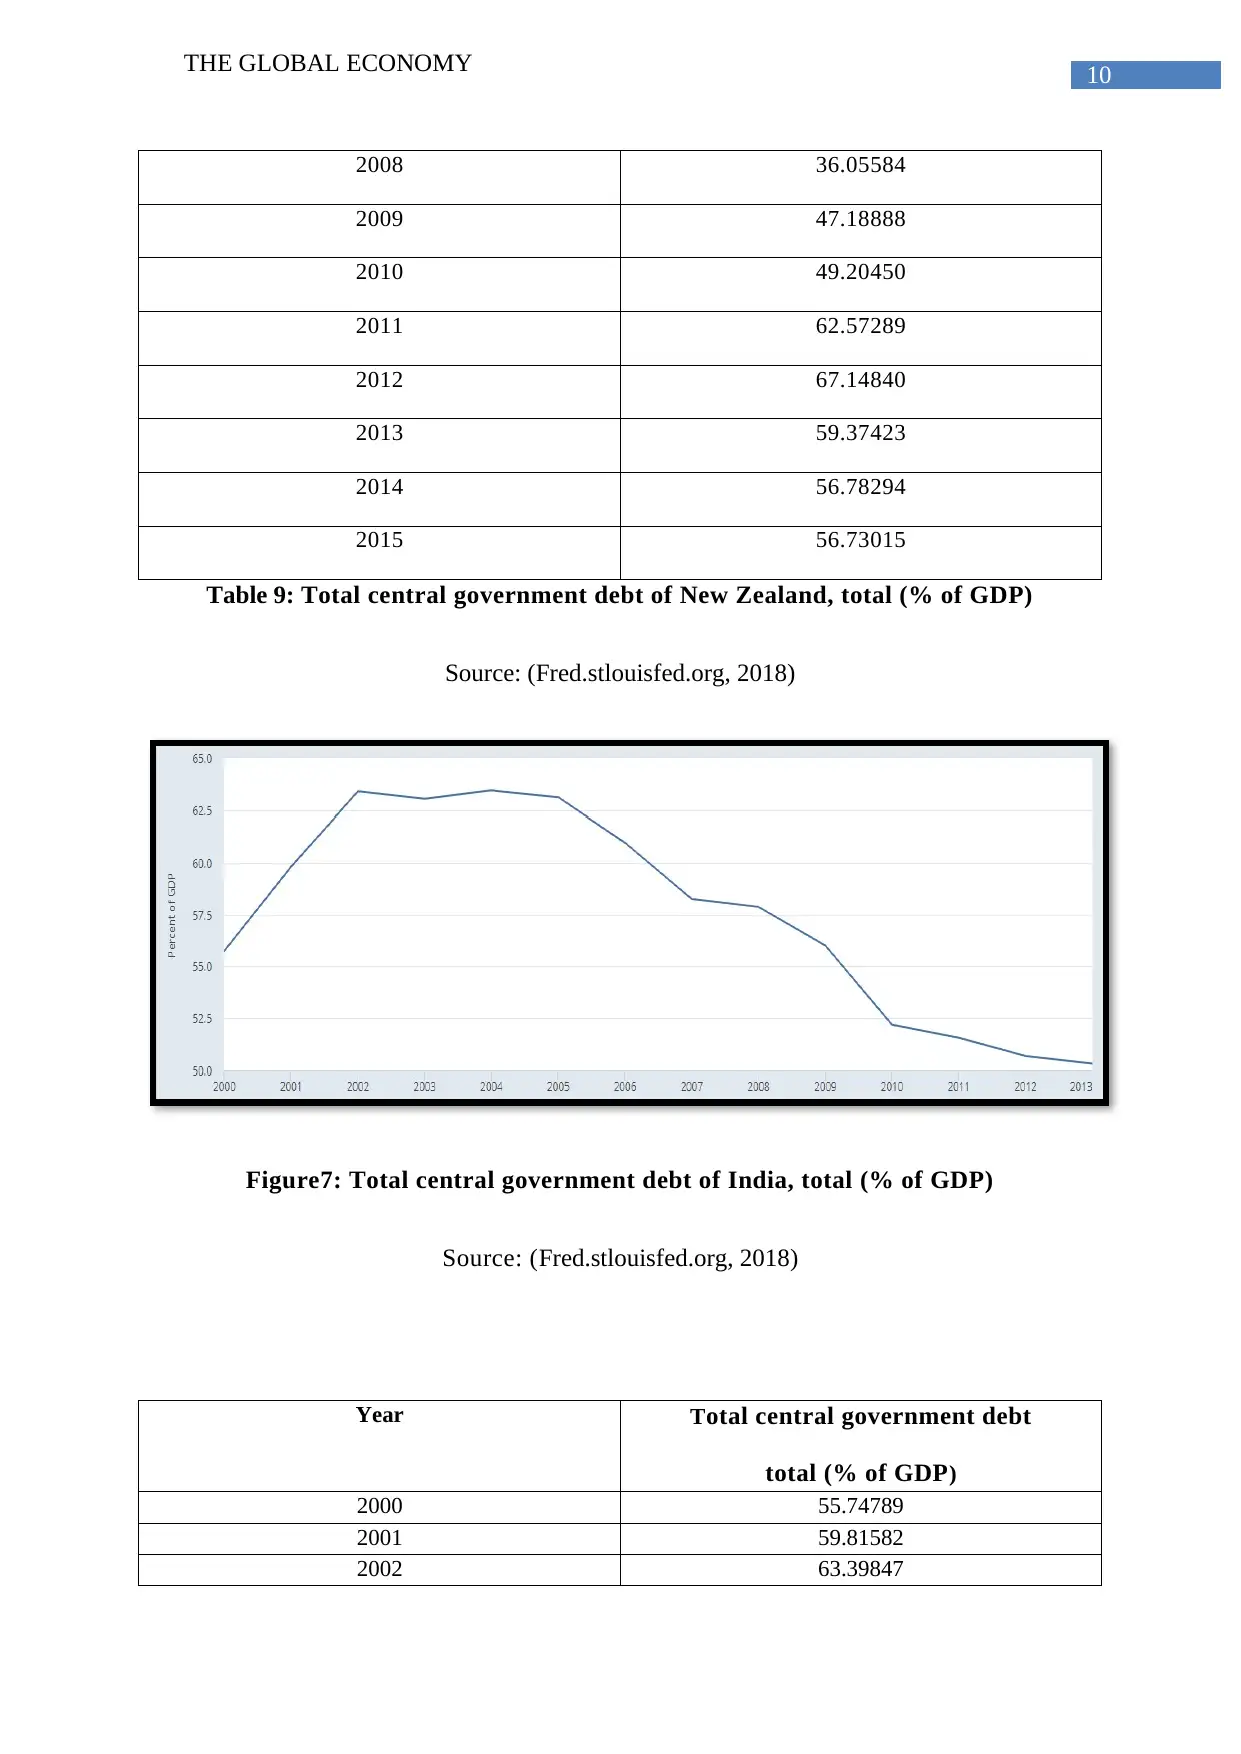
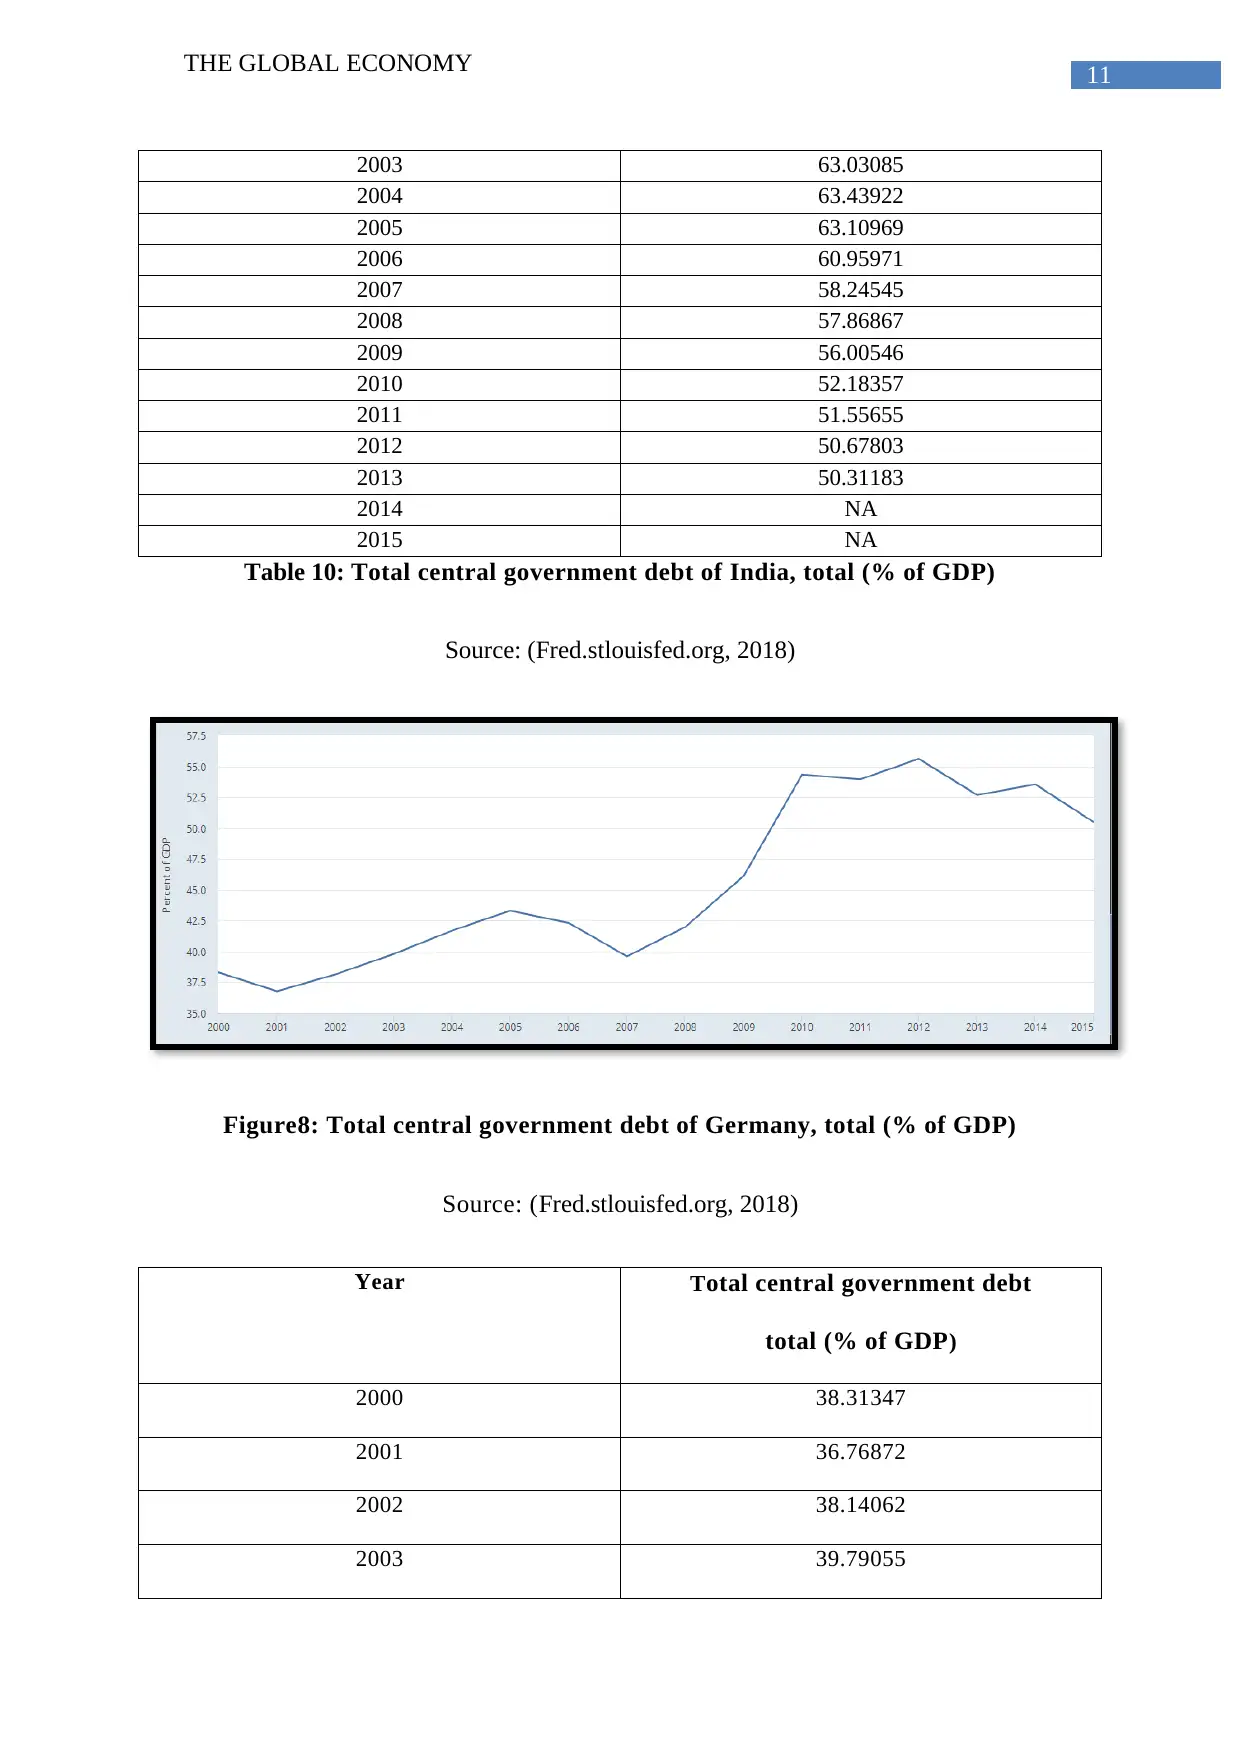
This assignment provides a comprehensive analysis of the global economy, with a particular focus on Australia's economic performance. It begins by examining Australia's bilateral trade relationships, identifying its top trading partners and export destinations. The analysis then delves into a comparative study of GDP, government debt, imports, and government final consumption for Australia, New Zealand, India, and Germany from 2000 to 2015. The assignment uses data from various sources to illustrate trends and fluctuations in these economic indicators. Furthermore, the assignment explores the relationship between inflation and unemployment rates in Australia, discussing their historical trends and correlations. Finally, the assignment touches upon long-run economic conditions, examining the impact of government expenditure on aggregate demand and supply. The data presented in tables and figures provides a detailed overview of the economic conditions of the countries and the factors influencing them.
Document Page
Running head: THE GLOBAL ECONOMY
The Global Economy
Name of the university
Name of the student
Author Note
tabler-icon-diamond-filled.svg

Paraphrase This Document

Need a fresh take? Get an instant paraphrase of this document with our AI Paraphraser
Document Page
1THE GLOBAL ECONOMY
Part A:
Answer 1:
The following table will show those countries, which have ranked the 6th, 7th, 8th, 9th
and 10th in terms of bilateral trade with Australia in 2014.
Rank Country
6 New Zealand
7 Malaysia
8 Thailand
9 Germany
10 India
Table 1: Bilateral trading partners of Australia, in 2014
Source: (Department of Foreign Affairs and Trade, 2018)
In the below table, the ranking of the previous countries in terms of Australia’s top
exports destination will be shown for the year 2015.
Country Rank
New Zealand 6
Malaysia 10
Thailand 13
Germany 15
India 5
Table 2: Ranking of the previous countries as Australia’s top exports destination, 2015
Source: (Department of Foreign Affairs and Trade, 2018)
Document Page
2THE GLOBAL ECONOMY
The top ten exporting countries of Australia is shown in below table for the year
2016.
Rank Country
1 China
2 Japan
3 United States
4 Republic of Korea
5 United Kingdom
6 India
7 New Zealand
8 Hong Kong
9 Singapore
10 Taiwan
Table 3: Top ten exporting countries of Australia, 2016
Source: (Department of Foreign Affairs and Trade, 2018)
Answer 2:
i)
Gross Domestic Products (GDP) of Australia, New Zealand, India and Germany
based on 2010 (U.S. Dollars), Annual, Not Seasonally Adjusted.
Document Page
3THE GLOBAL ECONOMY
Figure 1: Annual GDP of Australia (2010, U.S.D)
Source: (Fred.stlouisfed.org, 2018)
Year GDP Value ( 2010, USD)
Index (2010= 1)
2000 0.74000
2001 0.76000
2002 0.79100
2003 0.81300
2004 0.84600
2005 0.87100
2006 0.89500
2007 0.93400
2008 0.95800
2009 0.97600
2010 1.00000
2011 1.02700
2012 1.06700
tabler-icon-diamond-filled.svg

Paraphrase This Document

Need a fresh take? Get an instant paraphrase of this document with our AI Paraphraser
Document Page
4THE GLOBAL ECONOMY
2013 1.09100
2014 1.11800
2015 1.14700
Table 4: Annual GDP of Australia (2010, U.S.D)
Source: (Fred.stlouisfed.org, 2018)
Figure 2: Annual GDP of New Zealand (2010, U.S.D)
Source: (Fred.stlouisfed.org, 2018)
Year GDP Value ( 2010, USD)
Index (2010= 1)
2000 0.76400
2001 0.78100
2002 0.82100
2003 0.85800
2004 0.89600
2005 0.91900
2006 0.94400
2007 0.98100
2008 0.97700
Document Page
5THE GLOBAL ECONOMY
2009 0.98100
2010 1.00000
2011 1.01900
2012 1.04500
2013 1.06700
2014 1.09700
2015 1.13300
Table 5: Annual GDP of New Zealand (2010, U.S.D)
Source: (Fred.stlouisfed.org, 2018)
Figure 3: Annual GDP of India (2010, U.S.D)
Source: (Fred.stlouisfed.org, 2018)
Year GDP Value ( 2010, USD)
Index (2010= 1)
2000 NA
2001 NA
2002 NA
2003 NA
Document Page
6THE GLOBAL ECONOMY
2004 NA
2005 NA
2006 NA
2007 NA
2008 NA
2009 NA
2010 1.00000
2011 NA
2012 1.3200
2013 1.20100
2014 1.28500
2015 1.38200
Table 6: Annual GDP of India (2010, U.S.D)
Source: (Fred.stlouisfed.org, 2018)
Figure 4: Annual GDP of Germany (2010, U.S.D)
Source: (Fred.stlouisfed.org, 2018)
tabler-icon-diamond-filled.svg

Paraphrase This Document

Need a fresh take? Get an instant paraphrase of this document with our AI Paraphraser
Document Page
7THE GLOBAL ECONOMY
Year GDP Value ( 2010, USD)
Index (2010= 1)
2000 0.91400
2001 0.93000
2002 0.93000
2003 0.92300
2004 0.93400
2005 0.94000
2006 0.97500
2007 1.00700
2008 1.01800
2009 0.96100
2010 1.00000
2011 1.03700
2012 1.04200
2013 1.04700
2014 1.06700
2015 1.08600
Table 7: Annual GDP of Germany (2010, U.S.D)
Source: (Fred.stlouisfed.org, 2018)
ii)
Total central government debt of Australia, New Zealand, India and Germany, total (% of
GDP, Annual, Not Seasonally Adjusted)
Document Page
8THE GLOBAL ECONOMY
Figure5: Total central government debt of Australia, total (% of GDP)
Source: (Fred.stlouisfed.org, 2018)
Year Total central government debt
total (% of GDP)
2000 29.57454
2001 27.77455
2002 25.98684
2003 25.16258
2004 22.94081
2005 22.49565
2006 21.60331
2007 20.30457
2008 18.37448
2009 24.00725
2010 29.34086
2011 30.72087
2012 40.11420
2013 38.25787
Document Page
9THE GLOBAL ECONOMY
2014 42.43556
2015 47.16824
Table 8: Total central government debt of Australia, total (% of GDP)
Source: (Fred.stlouisfed.org, 2018)
Figure6: Total central government debt of New Zealand, total (% of GDP)
Source: (Fred.stlouisfed.org, 2018)
Year Total central government debt
total (% of GDP)
2000 NA
2001 NA
2002 32.77614
2003 48.24534
2004 43.86723
2005 44.17012
2006 42.92629
2007 36.94151
tabler-icon-diamond-filled.svg

Paraphrase This Document

Need a fresh take? Get an instant paraphrase of this document with our AI Paraphraser
Document Page
10THE GLOBAL ECONOMY
2008 36.05584
2009 47.18888
2010 49.20450
2011 62.57289
2012 67.14840
2013 59.37423
2014 56.78294
2015 56.73015
Table 9: Total central government debt of New Zealand, total (% of GDP)
Source: (Fred.stlouisfed.org, 2018)
Figure7: Total central government debt of India, total (% of GDP)
Source: (Fred.stlouisfed.org, 2018)
Year Total central government debt
total (% of GDP)
2000 55.74789
2001 59.81582
2002 63.39847
Document Page
11THE GLOBAL ECONOMY
2003 63.03085
2004 63.43922
2005 63.10969
2006 60.95971
2007 58.24545
2008 57.86867
2009 56.00546
2010 52.18357
2011 51.55655
2012 50.67803
2013 50.31183
2014 NA
2015 NA
Table 10: Total central government debt of India, total (% of GDP)
Source: (Fred.stlouisfed.org, 2018)
Figure8: Total central government debt of Germany, total (% of GDP)
Source: (Fred.stlouisfed.org, 2018)
Year Total central government debt
total (% of GDP)
2000 38.31347
2001 36.76872
2002 38.14062
2003 39.79055
chevron_up_icon
1 out of 30
circle_padding
hide_on_mobile
zoom_out_icon
[object Object]