GDP and Economic Growth in Australia: Government Policies & Industries
VerifiedAdded on 2023/06/13
|14
|3898
|476
Report
AI Summary
This report examines Australia's GDP and economic growth over the past five years, focusing on the impact of government policies and the performance of key industries. It highlights Australia's steady growth trend despite global financial challenges, attributing it to major industries and proactive government policies. The report delves into monetary and fiscal policy developments, emphasizing the role of low interest rates and government efforts to achieve budget surpluses. It also identifies key factors for future growth, such as increased female participation in the workforce and raising the retirement age. The analysis covers various sectors, including healthcare, finance, metal and mining, energy and utilities, materials and industrials, and the food and beverage industry, showcasing their contributions to Australia's economic landscape. Desklib provides access to similar reports and solved assignments for students.
Running Head: GDP AND ECONOMIC GROWTH
GDP and Economic Growth
GDP and Economic Growth in Australia in the last Five Years
GDP and Economic Growth
GDP and Economic Growth in Australia in the last Five Years
Paraphrase This Document
Need a fresh take? Get an instant paraphrase of this document with our AI Paraphraser
GDP AND ECONOMIC GROWTH 1
Executive Summary
The report covers the GDP and economic growth in Australia for the past five years. GDP is
the total value of all commodities that are produced within the domestic boundary of country,
in an accounting year. It is an indicator for the economic health of the country. Australia
being a resource abundant nation has high potential for growth. Despite the after effects of
global financial crisis, it was able to maintain a steady growth trend. The major industries of
Australia helped it grow out of the financial crisis. The Australian government formulated
policies to maintain this level of growth and improve simultaneously. The aim is to get back
to the phase of high budget surplus that Australia used to have. The monetary and fiscal
policies work together to attain a high and sustainable growth. The growth trend can be
improved by encouraging female participation in the workforce. Also, the retirement age can
be increased to increase the GDP. The ageing population poses a problem as a burden on the
government expenditure. Also, Australia aims to increase the usage of renewable energy
sources and contribute to the sustainable development. The scope for research and
development in various sectors provide opportunities for economic growth.
GDP AND ECONOMIC GROWTH 2
Table of Contents
Introduction................................................................................................................................1
Government Policies for economic growth................................................................................3
Monetary Policy Developments in the recent years...............................................................4
Fiscal Policy Developments in recent years...........................................................................4
The Game Changers...............................................................................................................5
Main Industries in Australia and their Economic Growth.........................................................5
Healthcare industry.................................................................................................................6
Financial industry...................................................................................................................6
Metal and Mining Industry.....................................................................................................7
Industry of energy and utility.................................................................................................7
Industry of Materials and industrials......................................................................................7
Food and Beverage Industry...................................................................................................8
Conclusion..................................................................................................................................8
References................................................................................................................................10
⊘ This is a preview!⊘
Do you want full access?
Subscribe today to unlock all pages.
Trusted by 1+ million students worldwide
GDP AND ECONOMIC GROWTH 3
Introduction
Australia is also known as Commonwealth of Australia. It is a sovereign and comprises of
Australian continent mainland, Tasmania and many other small islands. Australia is the sixth
largest country in the world (by total area) and largest country in Oceania. The country uses
Australian Dollar (AUD) as its official currency. It is one of the best nations to reside in, as
per the international comparisons of education, wealth, health and life quality (BBC News,
2018). The country follows Westminster government system and inherits the laws of the
British who once colonised the nation.
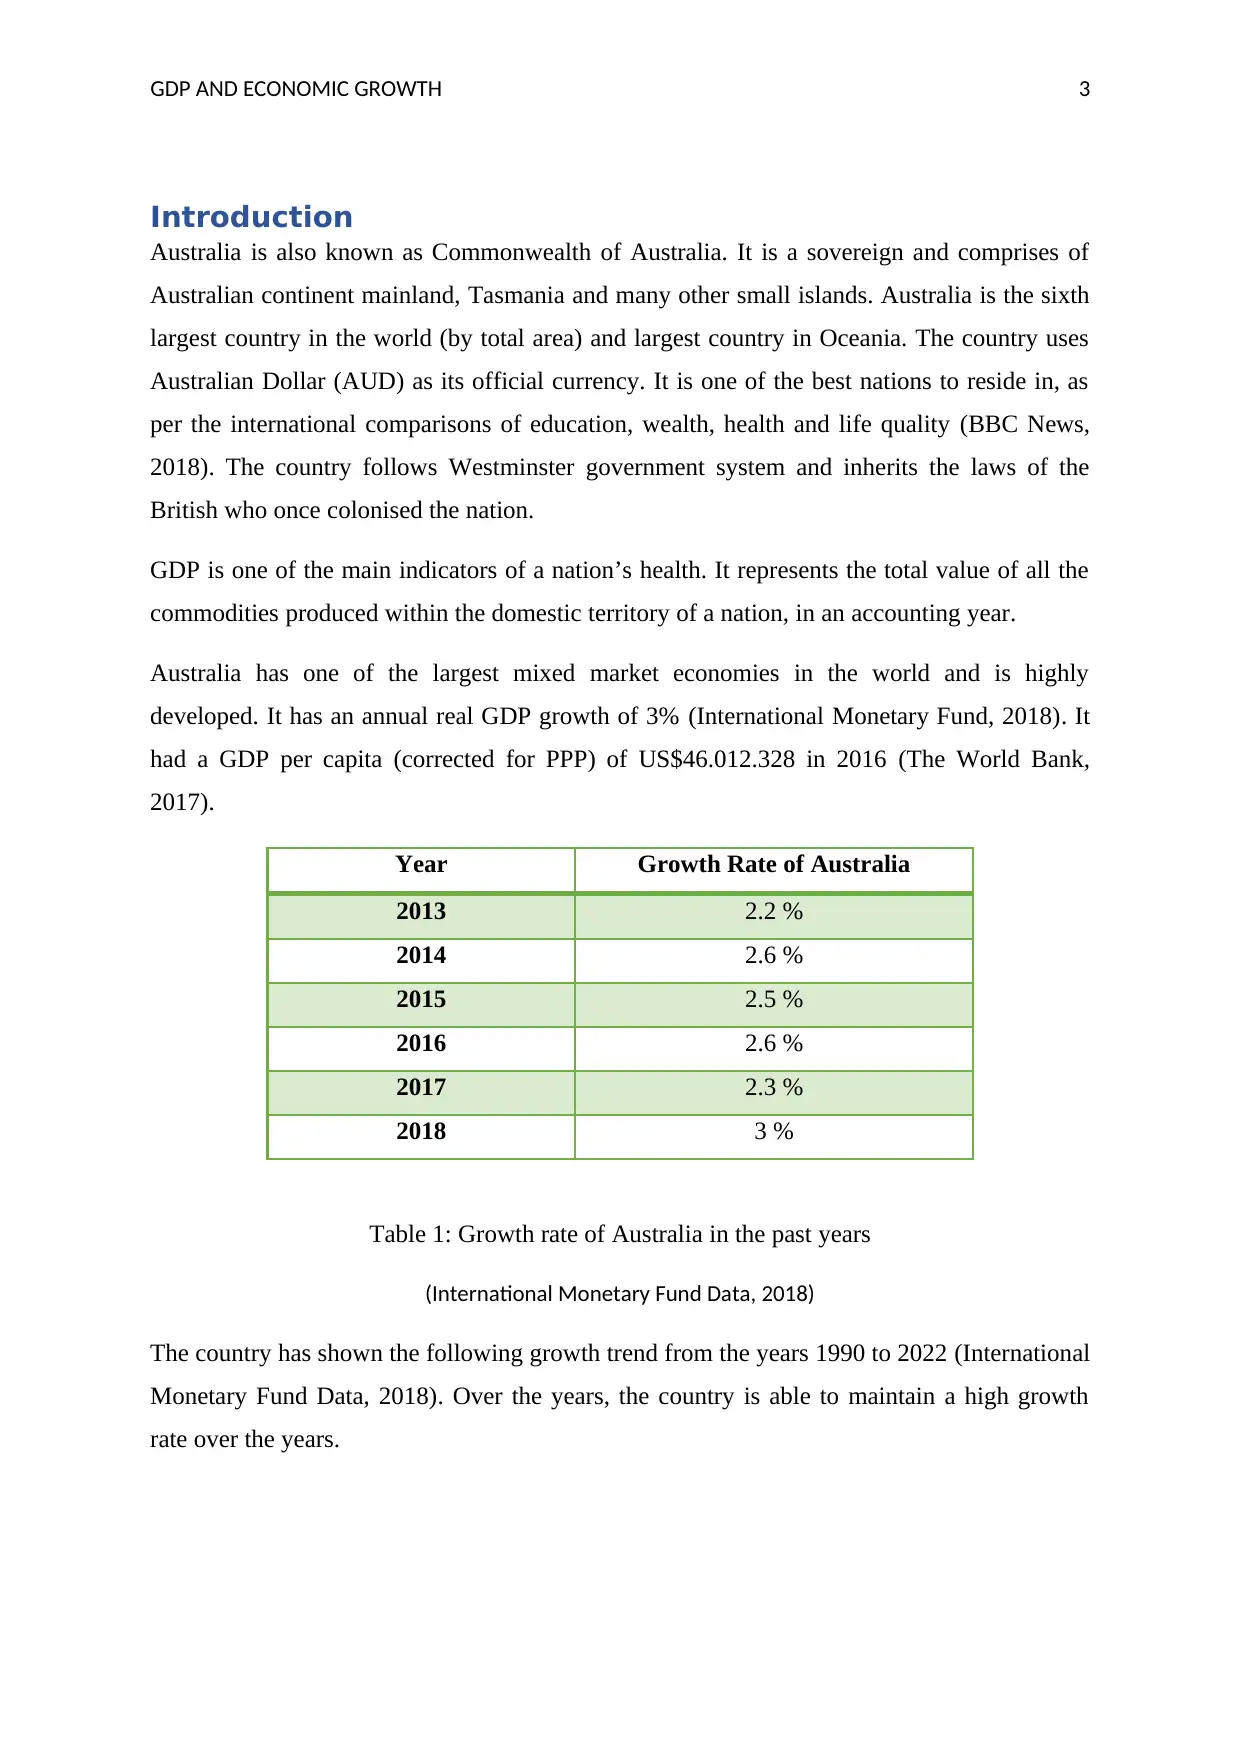
GDP is one of the main indicators of a nation’s health. It represents the total value of all the
commodities produced within the domestic territory of a nation, in an accounting year.
Australia has one of the largest mixed market economies in the world and is highly
developed. It has an annual real GDP growth of 3% (International Monetary Fund, 2018). It
had a GDP per capita (corrected for PPP) of US$46.012.328 in 2016 (The World Bank,
2017).
Year Growth Rate of Australia
2013 2.2 %
2014 2.6 %
2015 2.5 %
2016 2.6 %
2017 2.3 %
2018 3 %
Table 1: Growth rate of Australia in the past years
(International Monetary Fund Data, 2018)
The country has shown the following growth trend from the years 1990 to 2022 (International
Monetary Fund Data, 2018). Over the years, the country is able to maintain a high growth
rate over the years.
Introduction
Australia is also known as Commonwealth of Australia. It is a sovereign and comprises of
Australian continent mainland, Tasmania and many other small islands. Australia is the sixth
largest country in the world (by total area) and largest country in Oceania. The country uses
Australian Dollar (AUD) as its official currency. It is one of the best nations to reside in, as
per the international comparisons of education, wealth, health and life quality (BBC News,
2018). The country follows Westminster government system and inherits the laws of the
British who once colonised the nation.
GDP is one of the main indicators of a nation’s health. It represents the total value of all the
commodities produced within the domestic territory of a nation, in an accounting year.
Australia has one of the largest mixed market economies in the world and is highly
developed. It has an annual real GDP growth of 3% (International Monetary Fund, 2018). It
had a GDP per capita (corrected for PPP) of US$46.012.328 in 2016 (The World Bank,
2017).
Year Growth Rate of Australia
2013 2.2 %
2014 2.6 %
2015 2.5 %
2016 2.6 %
2017 2.3 %
2018 3 %
Table 1: Growth rate of Australia in the past years
(International Monetary Fund Data, 2018)
The country has shown the following growth trend from the years 1990 to 2022 (International
Monetary Fund Data, 2018). Over the years, the country is able to maintain a high growth
rate over the years.
Paraphrase This Document
Need a fresh take? Get an instant paraphrase of this document with our AI Paraphraser
GDP AND ECONOMIC GROWTH 4
1990
1992
1994
1996
1998
2000
2002
2004
2006
2008
2010
2012
2014
2016
2018
2020
2022
-2
-1
0
1
2
3
4
5
6 GDP Growth Rate in Australia
Australia
GDP growth rate
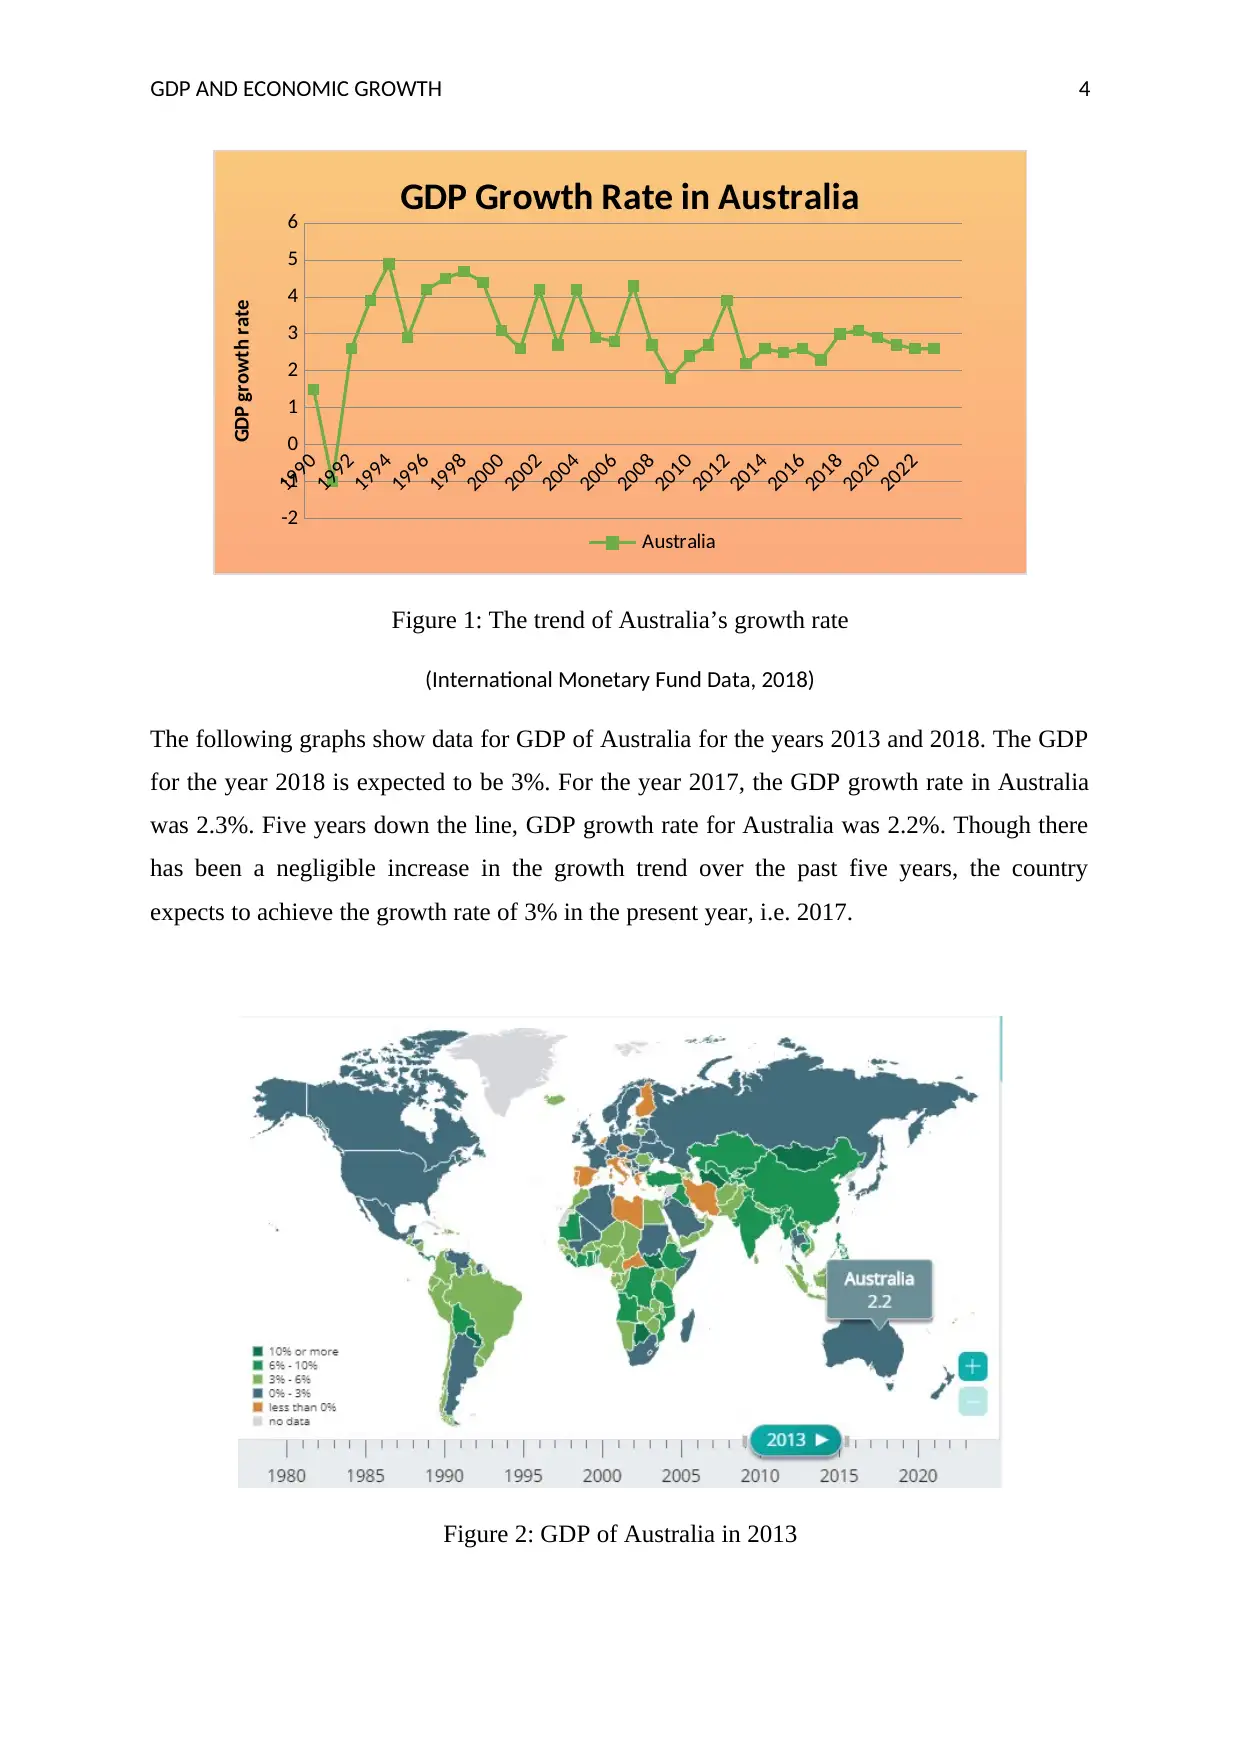
Figure 1: The trend of Australia’s growth rate
(International Monetary Fund Data, 2018)
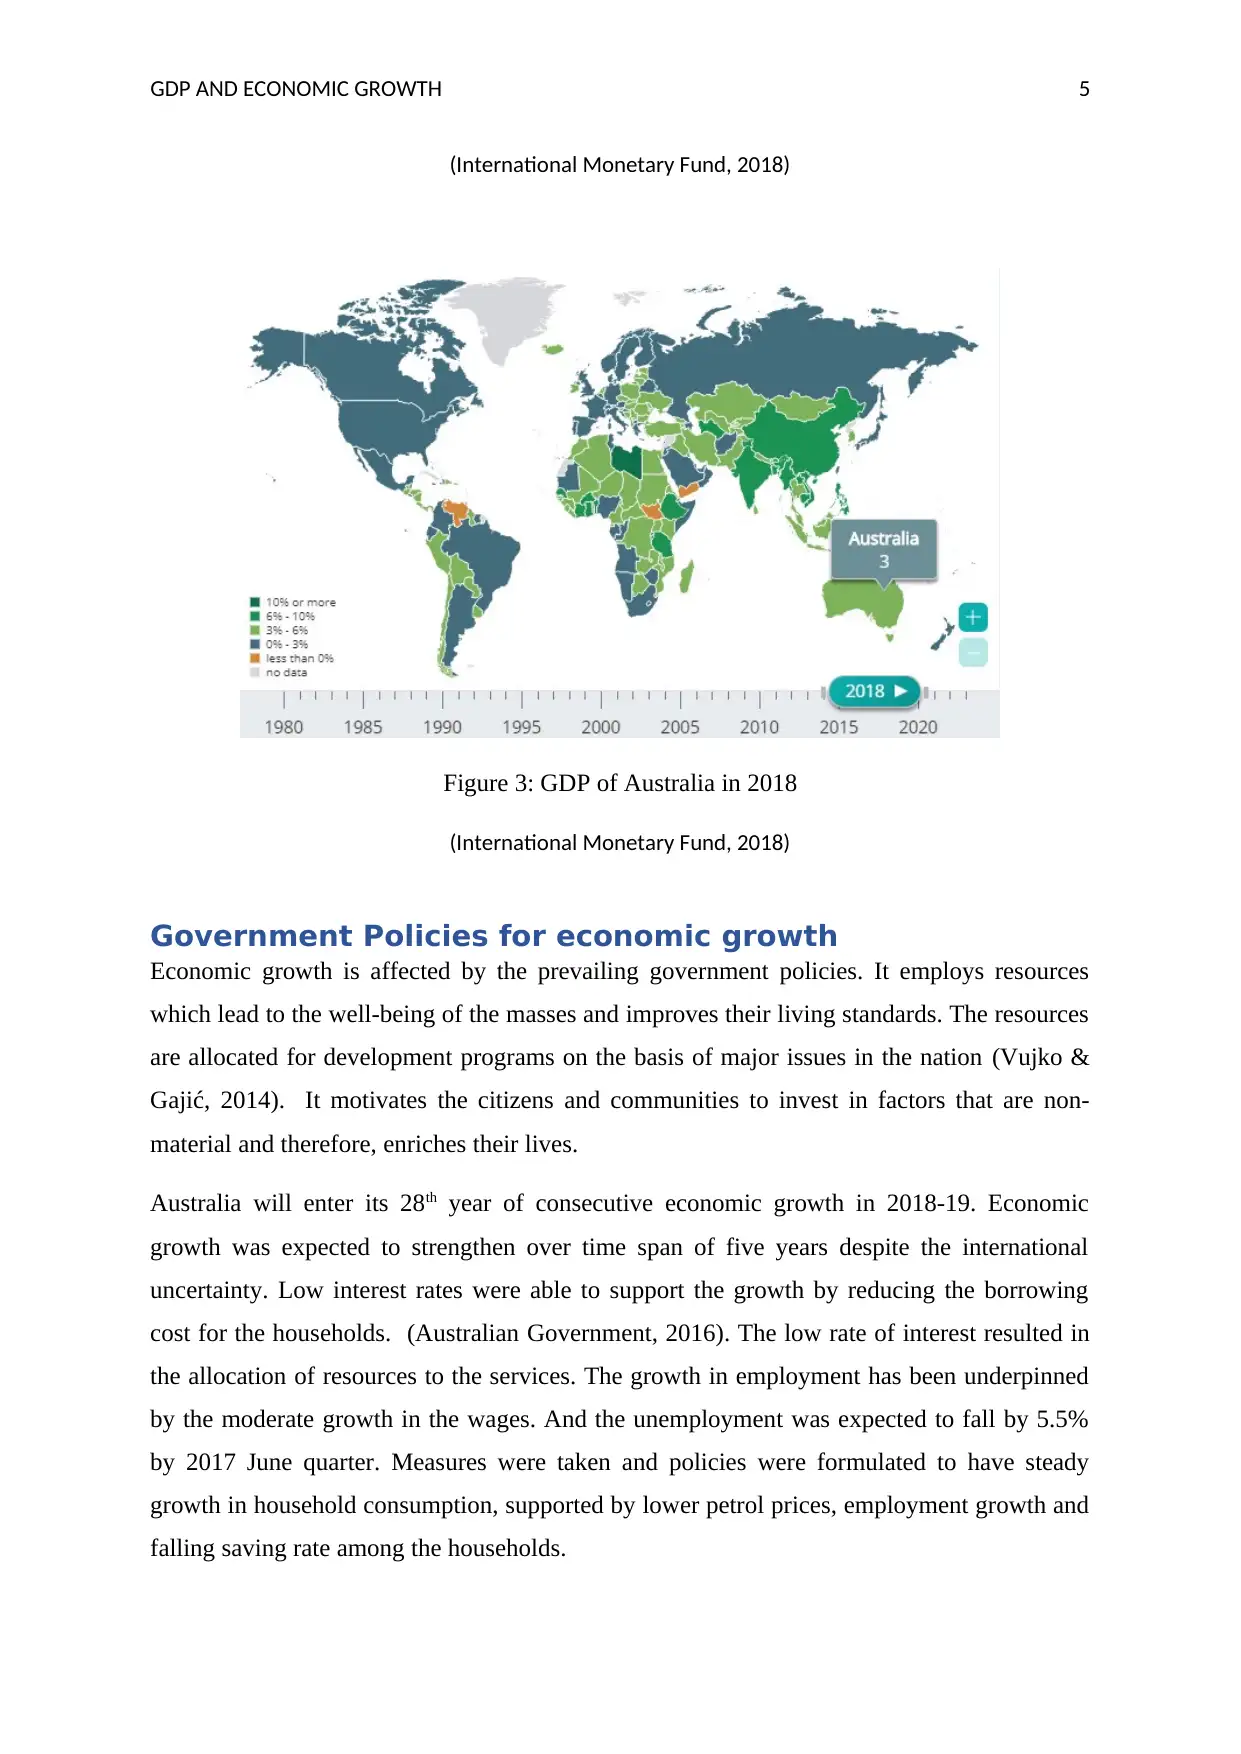
The following graphs show data for GDP of Australia for the years 2013 and 2018. The GDP
for the year 2018 is expected to be 3%. For the year 2017, the GDP growth rate in Australia
was 2.3%. Five years down the line, GDP growth rate for Australia was 2.2%. Though there
has been a negligible increase in the growth trend over the past five years, the country
expects to achieve the growth rate of 3% in the present year, i.e. 2017.
Figure 2: GDP of Australia in 2013
1990
1992
1994
1996
1998
2000
2002
2004
2006
2008
2010
2012
2014
2016
2018
2020
2022
-2
-1
0
1
2
3
4
5
6 GDP Growth Rate in Australia
Australia
GDP growth rate
Figure 1: The trend of Australia’s growth rate
(International Monetary Fund Data, 2018)
The following graphs show data for GDP of Australia for the years 2013 and 2018. The GDP
for the year 2018 is expected to be 3%. For the year 2017, the GDP growth rate in Australia
was 2.3%. Five years down the line, GDP growth rate for Australia was 2.2%. Though there
has been a negligible increase in the growth trend over the past five years, the country
expects to achieve the growth rate of 3% in the present year, i.e. 2017.
Figure 2: GDP of Australia in 2013
GDP AND ECONOMIC GROWTH 5
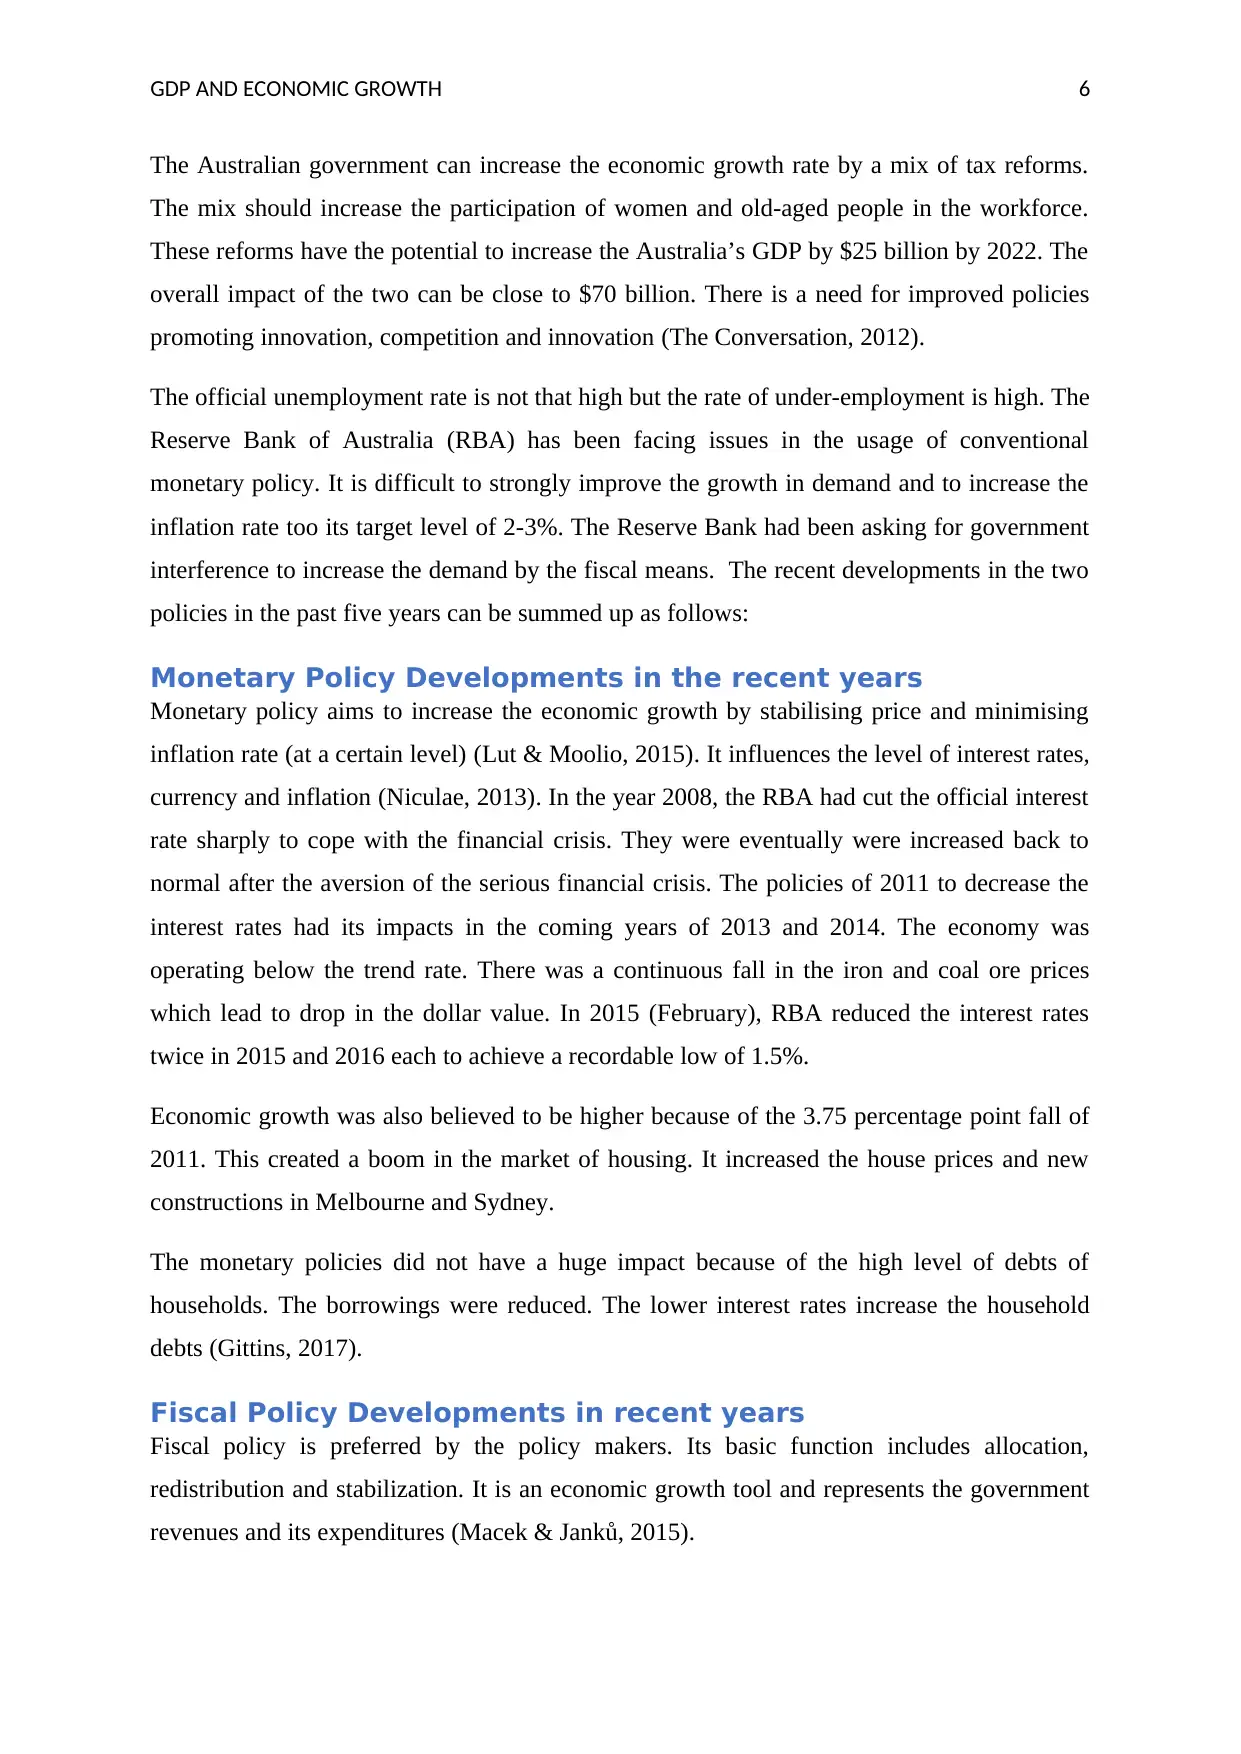
(International Monetary Fund, 2018)
Figure 3: GDP of Australia in 2018
(International Monetary Fund, 2018)
Government Policies for economic growth
Economic growth is affected by the prevailing government policies. It employs resources
which lead to the well-being of the masses and improves their living standards. The resources
are allocated for development programs on the basis of major issues in the nation (Vujko &
Gajić, 2014). It motivates the citizens and communities to invest in factors that are non-
material and therefore, enriches their lives.
Australia will enter its 28th year of consecutive economic growth in 2018-19. Economic
growth was expected to strengthen over time span of five years despite the international
uncertainty. Low interest rates were able to support the growth by reducing the borrowing
cost for the households. (Australian Government, 2016). The low rate of interest resulted in
the allocation of resources to the services. The growth in employment has been underpinned
by the moderate growth in the wages. And the unemployment was expected to fall by 5.5%
by 2017 June quarter. Measures were taken and policies were formulated to have steady
growth in household consumption, supported by lower petrol prices, employment growth and
falling saving rate among the households.
(International Monetary Fund, 2018)
Figure 3: GDP of Australia in 2018
(International Monetary Fund, 2018)
Government Policies for economic growth
Economic growth is affected by the prevailing government policies. It employs resources
which lead to the well-being of the masses and improves their living standards. The resources
are allocated for development programs on the basis of major issues in the nation (Vujko &
Gajić, 2014). It motivates the citizens and communities to invest in factors that are non-
material and therefore, enriches their lives.
Australia will enter its 28th year of consecutive economic growth in 2018-19. Economic
growth was expected to strengthen over time span of five years despite the international
uncertainty. Low interest rates were able to support the growth by reducing the borrowing
cost for the households. (Australian Government, 2016). The low rate of interest resulted in
the allocation of resources to the services. The growth in employment has been underpinned
by the moderate growth in the wages. And the unemployment was expected to fall by 5.5%
by 2017 June quarter. Measures were taken and policies were formulated to have steady
growth in household consumption, supported by lower petrol prices, employment growth and
falling saving rate among the households.
⊘ This is a preview!⊘
Do you want full access?
Subscribe today to unlock all pages.
Trusted by 1+ million students worldwide
GDP AND ECONOMIC GROWTH 6
The Australian government can increase the economic growth rate by a mix of tax reforms.
The mix should increase the participation of women and old-aged people in the workforce.
These reforms have the potential to increase the Australia’s GDP by $25 billion by 2022. The
overall impact of the two can be close to $70 billion. There is a need for improved policies
promoting innovation, competition and innovation (The Conversation, 2012).
The official unemployment rate is not that high but the rate of under-employment is high. The
Reserve Bank of Australia (RBA) has been facing issues in the usage of conventional
monetary policy. It is difficult to strongly improve the growth in demand and to increase the
inflation rate too its target level of 2-3%. The Reserve Bank had been asking for government
interference to increase the demand by the fiscal means. The recent developments in the two
policies in the past five years can be summed up as follows:
Monetary Policy Developments in the recent years
Monetary policy aims to increase the economic growth by stabilising price and minimising
inflation rate (at a certain level) (Lut & Moolio, 2015). It influences the level of interest rates,
currency and inflation (Niculae, 2013). In the year 2008, the RBA had cut the official interest
rate sharply to cope with the financial crisis. They were eventually were increased back to
normal after the aversion of the serious financial crisis. The policies of 2011 to decrease the
interest rates had its impacts in the coming years of 2013 and 2014. The economy was
operating below the trend rate. There was a continuous fall in the iron and coal ore prices
which lead to drop in the dollar value. In 2015 (February), RBA reduced the interest rates
twice in 2015 and 2016 each to achieve a recordable low of 1.5%.
Economic growth was also believed to be higher because of the 3.75 percentage point fall of
2011. This created a boom in the market of housing. It increased the house prices and new
constructions in Melbourne and Sydney.
The monetary policies did not have a huge impact because of the high level of debts of
households. The borrowings were reduced. The lower interest rates increase the household
debts (Gittins, 2017).
Fiscal Policy Developments in recent years
Fiscal policy is preferred by the policy makers. Its basic function includes allocation,
redistribution and stabilization. It is an economic growth tool and represents the government
revenues and its expenditures (Macek & Janků, 2015).
Paraphrase This Document
Need a fresh take? Get an instant paraphrase of this document with our AI Paraphraser
GDP AND ECONOMIC GROWTH 7
Philip Lowe pressurised the government to assist monetary policy in increasing demand.
There was preoccupation of the government in ‘fiscal sustainability’ through realisation of
budget surplus. Weak growth in tax collections, led to little or no success in its achievement.
The objective of the fiscal budget was to increase the surpluses and have a stronger base
through spending cuts as well as tax increment. ‘Zombie spending cuts’ were removed from
the budget by the Senate. They were expected to increase the savings. The effect had
worsening effect on the budget balance in the year 2017-18 by over $13 billion spread over
four years. The new decisions of tax increase, which were incorporated in the budget, are
expected to have negligible effect on the balance of the budget. It will yield an improvement
of $20 billion spread over four years. The main measures to increase the revenue included the
indirect taxes levied on the five big banks’ liabilities.
There was a net increase in the infrastructure spending by $5 billion. This included the
second Sydney airport, inland railways and national broadband network.
The Game Changers
As per the Grattan Institute report, there are three game changers in case of Australia’s
economic growth which supposedly provide it with large economic benefits in a shorter span
of time. GDP could rise by $25 billion per year if the Australian government collected greater
revenue from pro- economic activity and efficient taxes and lesser from the inefficient or
distortionary ones. The GST should bring under its ambit the sectors like education, food and
health. The revenue should be used to bring down the income and corporate taxes; and
compensate the ones on welfare. The women must be encouraged to be a part of the
workforce. The reforms in the tax structure will lead to greater female participation as they
will be able to retain a greater share of their income, after paying the tax and other expenses.
The changes in taxation, means testing and benefits can considerably improve the
participation rate, as can be seen from the case of Canada. The other factor to impact the
growth rate can be the increase in the retirement age. This can increase the GDP to $25
billion by 2020, given the age was increased to that of New Zealand (The Conversation,
2012).
Main Industries in Australia and their Economic Growth
The main industry in Australia is the primary industry. The manufacturing industry also has
an important part in the growth process. The growth trends discussed above were led by the
GDP AND ECONOMIC GROWTH 8
developments in its major industries. The industries lead to overall growth in the economy.
The establishment or growth of an industry leads to increased employment in the economy. It
generates new job opportunities for the masses and leads infrastructural development. The
industry plays an important role in the GDP and growth rate in an economy. Industries that
play a major part in the growth in the Australian market are healthcare, finance, metal and
mining metallurgy, energies and utility industry and many others.
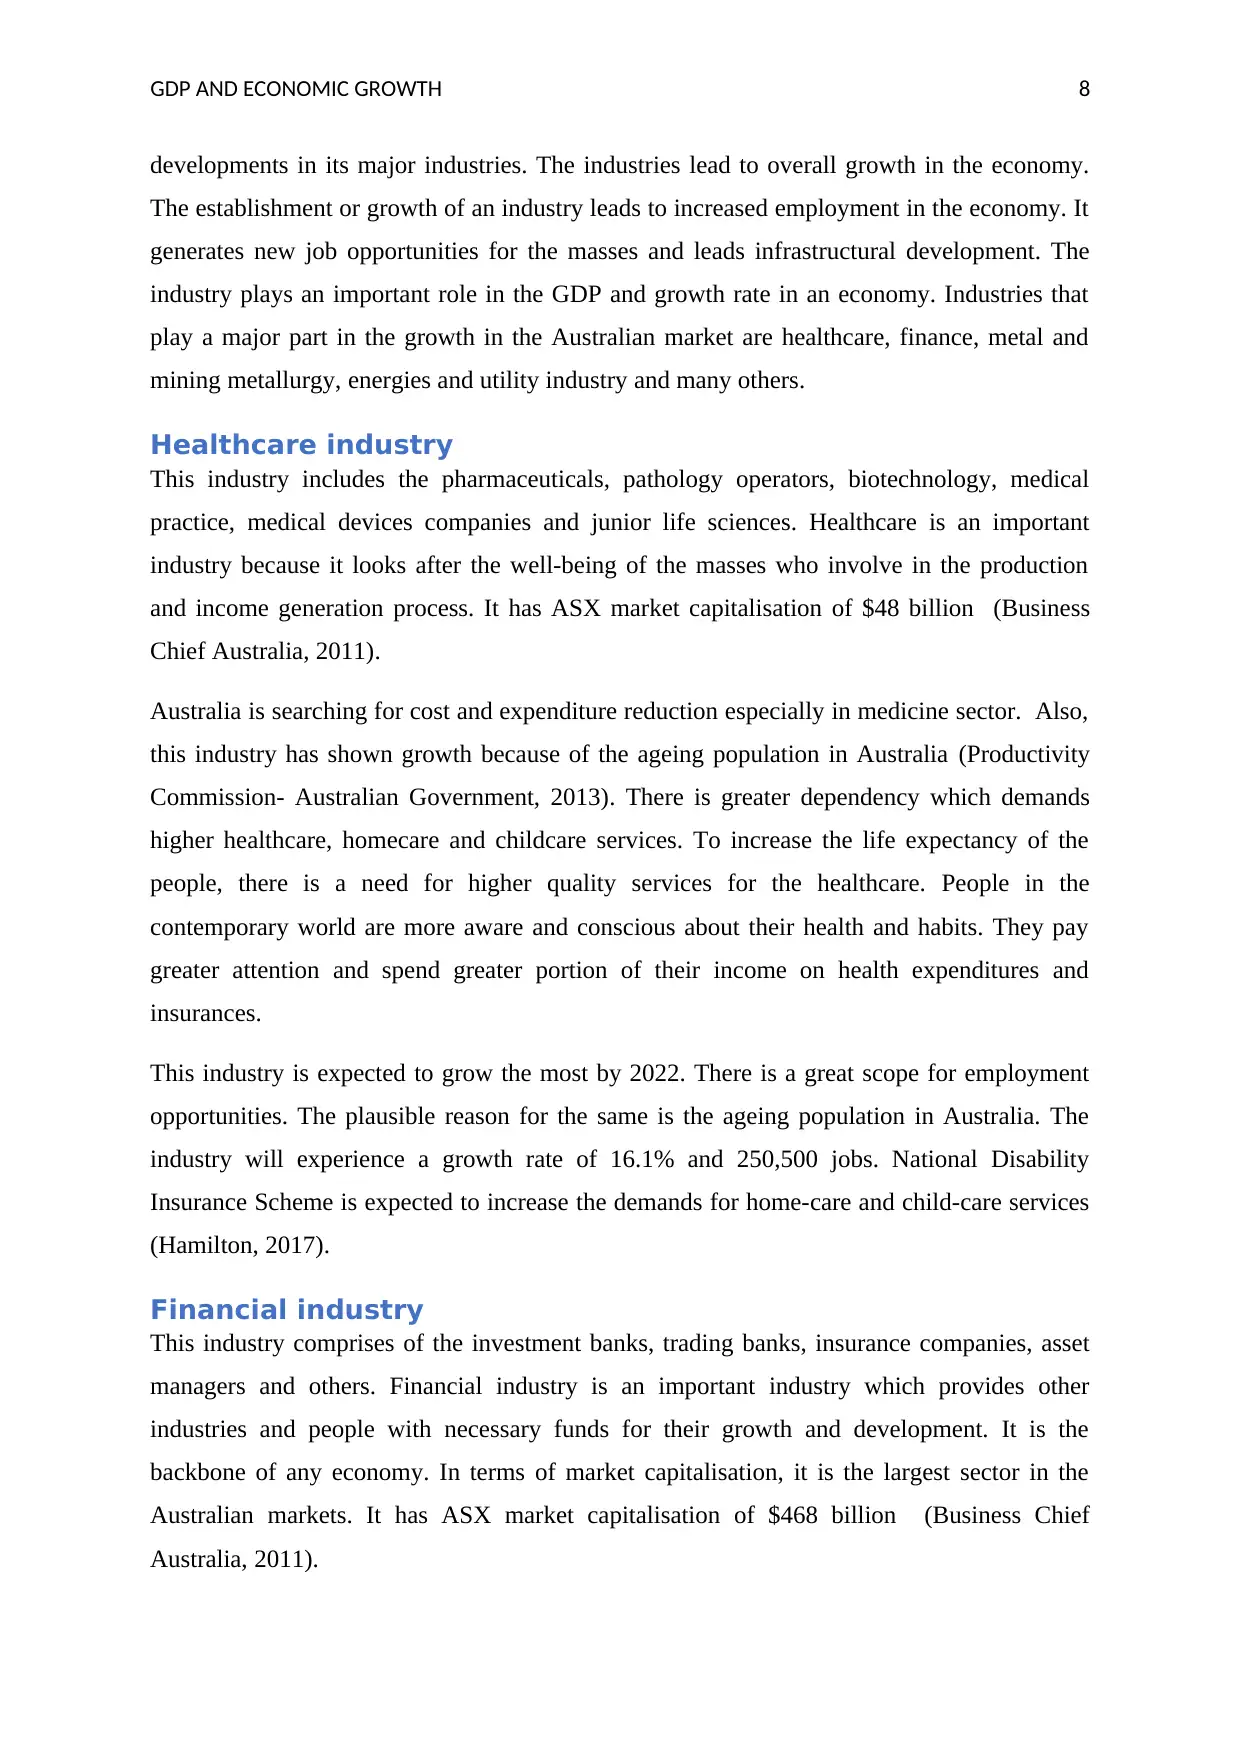
Healthcare industry
This industry includes the pharmaceuticals, pathology operators, biotechnology, medical
practice, medical devices companies and junior life sciences. Healthcare is an important
industry because it looks after the well-being of the masses who involve in the production
and income generation process. It has ASX market capitalisation of $48 billion (Business
Chief Australia, 2011).
Australia is searching for cost and expenditure reduction especially in medicine sector. Also,
this industry has shown growth because of the ageing population in Australia (Productivity
Commission- Australian Government, 2013). There is greater dependency which demands
higher healthcare, homecare and childcare services. To increase the life expectancy of the
people, there is a need for higher quality services for the healthcare. People in the
contemporary world are more aware and conscious about their health and habits. They pay
greater attention and spend greater portion of their income on health expenditures and
insurances.
This industry is expected to grow the most by 2022. There is a great scope for employment
opportunities. The plausible reason for the same is the ageing population in Australia. The
industry will experience a growth rate of 16.1% and 250,500 jobs. National Disability
Insurance Scheme is expected to increase the demands for home-care and child-care services
(Hamilton, 2017).
Financial industry
This industry comprises of the investment banks, trading banks, insurance companies, asset
managers and others. Financial industry is an important industry which provides other
industries and people with necessary funds for their growth and development. It is the
backbone of any economy. In terms of market capitalisation, it is the largest sector in the
Australian markets. It has ASX market capitalisation of $468 billion (Business Chief
Australia, 2011).
developments in its major industries. The industries lead to overall growth in the economy.
The establishment or growth of an industry leads to increased employment in the economy. It
generates new job opportunities for the masses and leads infrastructural development. The
industry plays an important role in the GDP and growth rate in an economy. Industries that
play a major part in the growth in the Australian market are healthcare, finance, metal and
mining metallurgy, energies and utility industry and many others.
Healthcare industry
This industry includes the pharmaceuticals, pathology operators, biotechnology, medical
practice, medical devices companies and junior life sciences. Healthcare is an important
industry because it looks after the well-being of the masses who involve in the production
and income generation process. It has ASX market capitalisation of $48 billion (Business
Chief Australia, 2011).
Australia is searching for cost and expenditure reduction especially in medicine sector. Also,
this industry has shown growth because of the ageing population in Australia (Productivity
Commission- Australian Government, 2013). There is greater dependency which demands
higher healthcare, homecare and childcare services. To increase the life expectancy of the
people, there is a need for higher quality services for the healthcare. People in the
contemporary world are more aware and conscious about their health and habits. They pay
greater attention and spend greater portion of their income on health expenditures and
insurances.
This industry is expected to grow the most by 2022. There is a great scope for employment
opportunities. The plausible reason for the same is the ageing population in Australia. The
industry will experience a growth rate of 16.1% and 250,500 jobs. National Disability
Insurance Scheme is expected to increase the demands for home-care and child-care services
(Hamilton, 2017).
Financial industry
This industry comprises of the investment banks, trading banks, insurance companies, asset
managers and others. Financial industry is an important industry which provides other
industries and people with necessary funds for their growth and development. It is the
backbone of any economy. In terms of market capitalisation, it is the largest sector in the
Australian markets. It has ASX market capitalisation of $468 billion (Business Chief
Australia, 2011).
⊘ This is a preview!⊘
Do you want full access?
Subscribe today to unlock all pages.
Trusted by 1+ million students worldwide
GDP AND ECONOMIC GROWTH 9
The firms in Australia are rearranging business models, rebuilding the disconnected customer
relationships and reconstructing workforce. Also, there has been a growth in the tourism
sector in Australia. It has led to increased demand for financial assets. These factors have
triggered the growth in the financial sector.
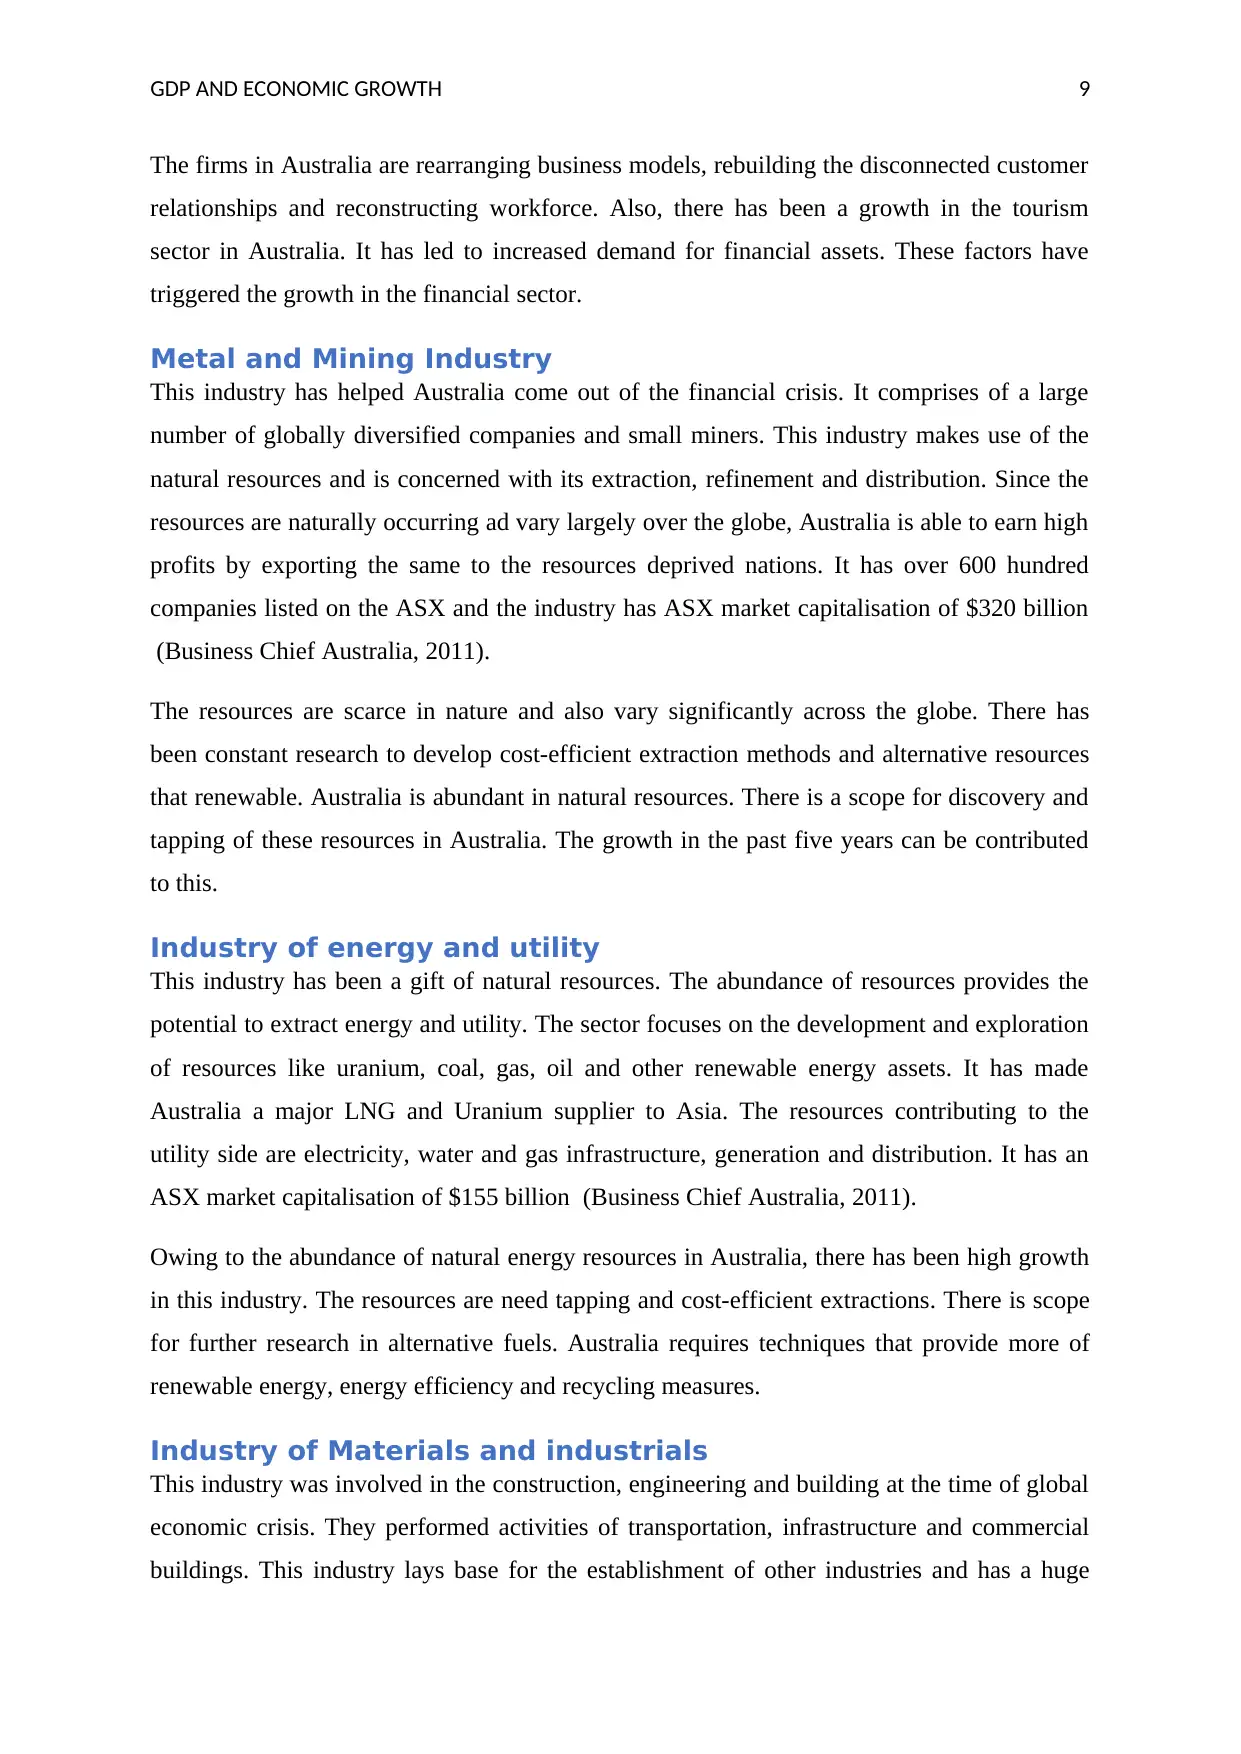
Metal and Mining Industry
This industry has helped Australia come out of the financial crisis. It comprises of a large
number of globally diversified companies and small miners. This industry makes use of the
natural resources and is concerned with its extraction, refinement and distribution. Since the
resources are naturally occurring ad vary largely over the globe, Australia is able to earn high
profits by exporting the same to the resources deprived nations. It has over 600 hundred
companies listed on the ASX and the industry has ASX market capitalisation of $320 billion
(Business Chief Australia, 2011).
The resources are scarce in nature and also vary significantly across the globe. There has
been constant research to develop cost-efficient extraction methods and alternative resources
that renewable. Australia is abundant in natural resources. There is a scope for discovery and
tapping of these resources in Australia. The growth in the past five years can be contributed
to this.
Industry of energy and utility
This industry has been a gift of natural resources. The abundance of resources provides the
potential to extract energy and utility. The sector focuses on the development and exploration
of resources like uranium, coal, gas, oil and other renewable energy assets. It has made
Australia a major LNG and Uranium supplier to Asia. The resources contributing to the
utility side are electricity, water and gas infrastructure, generation and distribution. It has an
ASX market capitalisation of $155 billion (Business Chief Australia, 2011).
Owing to the abundance of natural energy resources in Australia, there has been high growth
in this industry. The resources are need tapping and cost-efficient extractions. There is scope
for further research in alternative fuels. Australia requires techniques that provide more of
renewable energy, energy efficiency and recycling measures.
Industry of Materials and industrials
This industry was involved in the construction, engineering and building at the time of global
economic crisis. They performed activities of transportation, infrastructure and commercial
buildings. This industry lays base for the establishment of other industries and has a huge
The firms in Australia are rearranging business models, rebuilding the disconnected customer
relationships and reconstructing workforce. Also, there has been a growth in the tourism
sector in Australia. It has led to increased demand for financial assets. These factors have
triggered the growth in the financial sector.
Metal and Mining Industry
This industry has helped Australia come out of the financial crisis. It comprises of a large
number of globally diversified companies and small miners. This industry makes use of the
natural resources and is concerned with its extraction, refinement and distribution. Since the
resources are naturally occurring ad vary largely over the globe, Australia is able to earn high
profits by exporting the same to the resources deprived nations. It has over 600 hundred
companies listed on the ASX and the industry has ASX market capitalisation of $320 billion
(Business Chief Australia, 2011).
The resources are scarce in nature and also vary significantly across the globe. There has
been constant research to develop cost-efficient extraction methods and alternative resources
that renewable. Australia is abundant in natural resources. There is a scope for discovery and
tapping of these resources in Australia. The growth in the past five years can be contributed
to this.
Industry of energy and utility
This industry has been a gift of natural resources. The abundance of resources provides the
potential to extract energy and utility. The sector focuses on the development and exploration
of resources like uranium, coal, gas, oil and other renewable energy assets. It has made
Australia a major LNG and Uranium supplier to Asia. The resources contributing to the
utility side are electricity, water and gas infrastructure, generation and distribution. It has an
ASX market capitalisation of $155 billion (Business Chief Australia, 2011).
Owing to the abundance of natural energy resources in Australia, there has been high growth
in this industry. The resources are need tapping and cost-efficient extractions. There is scope
for further research in alternative fuels. Australia requires techniques that provide more of
renewable energy, energy efficiency and recycling measures.
Industry of Materials and industrials
This industry was involved in the construction, engineering and building at the time of global
economic crisis. They performed activities of transportation, infrastructure and commercial
buildings. This industry lays base for the establishment of other industries and has a huge
Paraphrase This Document
Need a fresh take? Get an instant paraphrase of this document with our AI Paraphraser
GDP AND ECONOMIC GROWTH 10
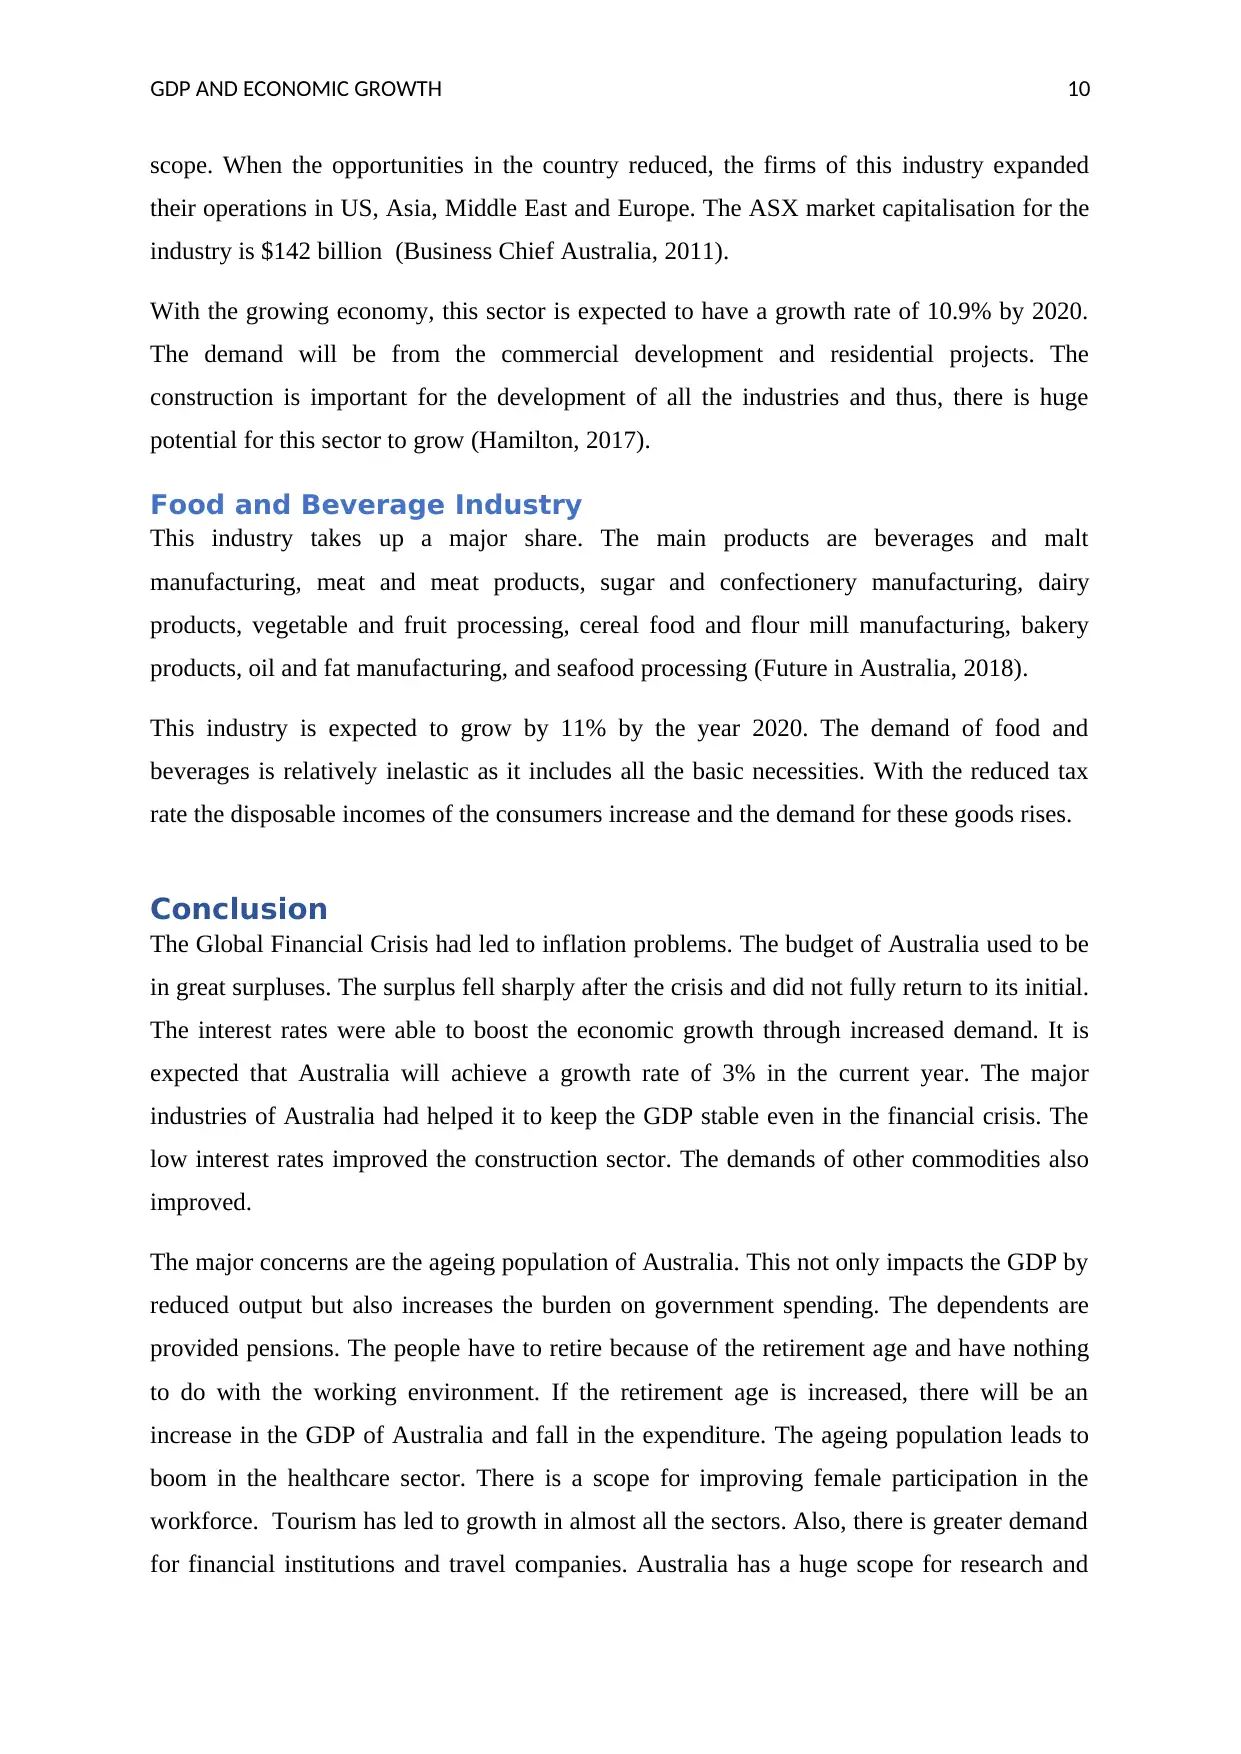
scope. When the opportunities in the country reduced, the firms of this industry expanded
their operations in US, Asia, Middle East and Europe. The ASX market capitalisation for the
industry is $142 billion (Business Chief Australia, 2011).
With the growing economy, this sector is expected to have a growth rate of 10.9% by 2020.
The demand will be from the commercial development and residential projects. The
construction is important for the development of all the industries and thus, there is huge
potential for this sector to grow (Hamilton, 2017).
Food and Beverage Industry
This industry takes up a major share. The main products are beverages and malt
manufacturing, meat and meat products, sugar and confectionery manufacturing, dairy
products, vegetable and fruit processing, cereal food and flour mill manufacturing, bakery
products, oil and fat manufacturing, and seafood processing (Future in Australia, 2018).
This industry is expected to grow by 11% by the year 2020. The demand of food and
beverages is relatively inelastic as it includes all the basic necessities. With the reduced tax
rate the disposable incomes of the consumers increase and the demand for these goods rises.
Conclusion
The Global Financial Crisis had led to inflation problems. The budget of Australia used to be
in great surpluses. The surplus fell sharply after the crisis and did not fully return to its initial.
The interest rates were able to boost the economic growth through increased demand. It is
expected that Australia will achieve a growth rate of 3% in the current year. The major
industries of Australia had helped it to keep the GDP stable even in the financial crisis. The
low interest rates improved the construction sector. The demands of other commodities also
improved.
The major concerns are the ageing population of Australia. This not only impacts the GDP by
reduced output but also increases the burden on government spending. The dependents are
provided pensions. The people have to retire because of the retirement age and have nothing
to do with the working environment. If the retirement age is increased, there will be an
increase in the GDP of Australia and fall in the expenditure. The ageing population leads to
boom in the healthcare sector. There is a scope for improving female participation in the
workforce. Tourism has led to growth in almost all the sectors. Also, there is greater demand
for financial institutions and travel companies. Australia has a huge scope for research and

GDP AND ECONOMIC GROWTH 11
development in its resources. The pact signed by Australia to increase the use of renewable
energy has reduced the burden on natural resources.
development in its resources. The pact signed by Australia to increase the use of renewable
energy has reduced the burden on natural resources.
⊘ This is a preview!⊘
Do you want full access?
Subscribe today to unlock all pages.
Trusted by 1+ million students worldwide
1 out of 14
Related Documents


Your All-in-One AI-Powered Toolkit for Academic Success.
+13062052269
info@desklib.com
Available 24*7 on WhatsApp / Email
![[object Object]](/_next/static/media/star-bottom.7253800d.svg)
Unlock your academic potential
Copyright © 2020–2026 A2Z Services. All Rights Reserved. Developed and managed by ZUCOL.