Statistical Analysis of House Rents in Australia: Trends and Insights
VerifiedAdded on 2023/06/12
|14
|2443
|131
Report
AI Summary
This report examines the household rent situation in Australian suburbs, focusing on individuals who rent apartments. Data was collected from a sample of 20 respondents using a questionnaire covering gender, education, marital status, occupation, income, family size, weekly rent, number of bedrooms, and bond amount. The analysis reveals that a significant portion of renters are students, service holders, or business people with larger families, often renting due to work or study commitments. Descriptive statistics show the average annual income of renters is $42,355.45, with an average weekly rent of $565 and a bond amount of $2196. Interval estimation at a 95% confidence level indicates that the true average income lies between $34,519.09 and $50,191.81, the average weekly rent is between $475.91 and $654.09, and the average bond amount is between $1,778.40 and $2,613.60. The study concludes that most renters in Australian suburbs are large families renting for work or study purposes, with collected data falling within the calculated confidence intervals.
Running Head: HOUSE RENTS IN AUSTRALIA
House Rents In Australia
Name of the Student
Name of the University
Student ID
House Rents In Australia
Name of the Student
Name of the University
Student ID
Paraphrase This Document
Need a fresh take? Get an instant paraphrase of this document with our AI Paraphraser
1HOUSE RENTS IN AUSTRALIA
Executive Summary
This research mainly deals with the household rent of the people renting apartments in
Australia. This renting culture is very common in Australian Suburbs. People rent apartments
mostly to stay close to their workplaces or places of education. It has been observed that
people with large families tend to rent apartments and also service holders and students are
more common in renting apartments. The information collected on the sample of 20
respondents have been found to be lying within the confidence intervals.
2HOUSE RENTS IN AUSTRALIA
Table of Contents
1.0 Introduction..........................................................................................................................3
2.0 Method of Data Collection...................................................................................................3
3.0 Summary of the Dataset.......................................................................................................4
4.0 Descriptive Data Analysis....................................................................................................7
5.0 Interval Estimation...............................................................................................................9
6.0 Conclusion and Recommendation......................................................................................10
References................................................................................................................................11
Appendix..................................................................................................................................12
⊘ This is a preview!⊘
Do you want full access?
Subscribe today to unlock all pages.
Trusted by 1+ million students worldwide
3HOUSE RENTS IN AUSTRALIA
1.0 Introduction
A lot of people in the Australian suburbs stay in rented houses (Ruming and Dowling
2017). There are various reasons behind this. Some of them might not be Australian citizens
or a citizen of that particular area, who have come for work or study purpose (Neutze 2016).
Another reason can be affordability (Willing and Pojani 2017). Not everybody can afford a
house in the country and thus they prefer to rent it. Otherwise, they might already have a
house in some other states and it would not be necessary to have another one near their
college or work place (Rosewall and Shoory 2017). Thus, renting has been very common in
Australia. Some prefer to rent houses and some others prefer to rent apartments (Hulse et al
2018).
This study mainly relates to the people who rent a house in the Australian suburbs.
Thus the targeted population is the people renting houses in the Australian Suburbs. This
research is mainly aimed towards finding the following research questions:
What is the most appropriate range within which the people prefer to tent a house?
That is the most significant range of income within which people prefer renting house
rather than buying one?
What is the bond amount that has to be paid while renting a house or an apartment?
In order to get answers to the research questions stated above, the following research
has been carried out. Appropriate statistical techniques will be applied in order to get the
necessary results.
2.0 Method of Data Collection
To conduct the study that has been described above, data will be necessary on the
people residing in rented houses in the suburbs of Australia. For the purpose of the collection
of the data, a questionnaire has been designed. The questionnaire has 10 questions in totality
Paraphrase This Document
Need a fresh take? Get an instant paraphrase of this document with our AI Paraphraser
4HOUSE RENTS IN AUSTRALIA
which will inform about the respondent’s gender, age, Highest level of education attained,
marital status, occupation, annual income, number of members in the family, weekly rent
paid, number of bedrooms in the rented apartment and the bond amount that has been paid at
the time of renting the apartment. All these details will be of help in answering the
aforementioned research questions.
From the listed questions that will be asked to the participants of the study, it can be
said that gender, highest level of education, marital status, occupation are all categorical
variables whereas, all the other variables such as, annual income, number of family members,
weekly rent paid, number of bedrooms and the bond amount are all numeric variables. The
questionnaire will be distributed to 20 people who rent a place in the Australian Suburbs. The
participants will be selected at random for the purpose of the study so that there are no biases
in the results obtained and can represent the whole population. There is some information
asked in the questionnaire to which the respondents might not be that comfortable to answer
for security issues. Thus, each of the selected respondents have been assured that all the
collected information will be highly secure and confidential and will not be shared with
anybody who are not involved in the study.
3.0 Summary of the Dataset
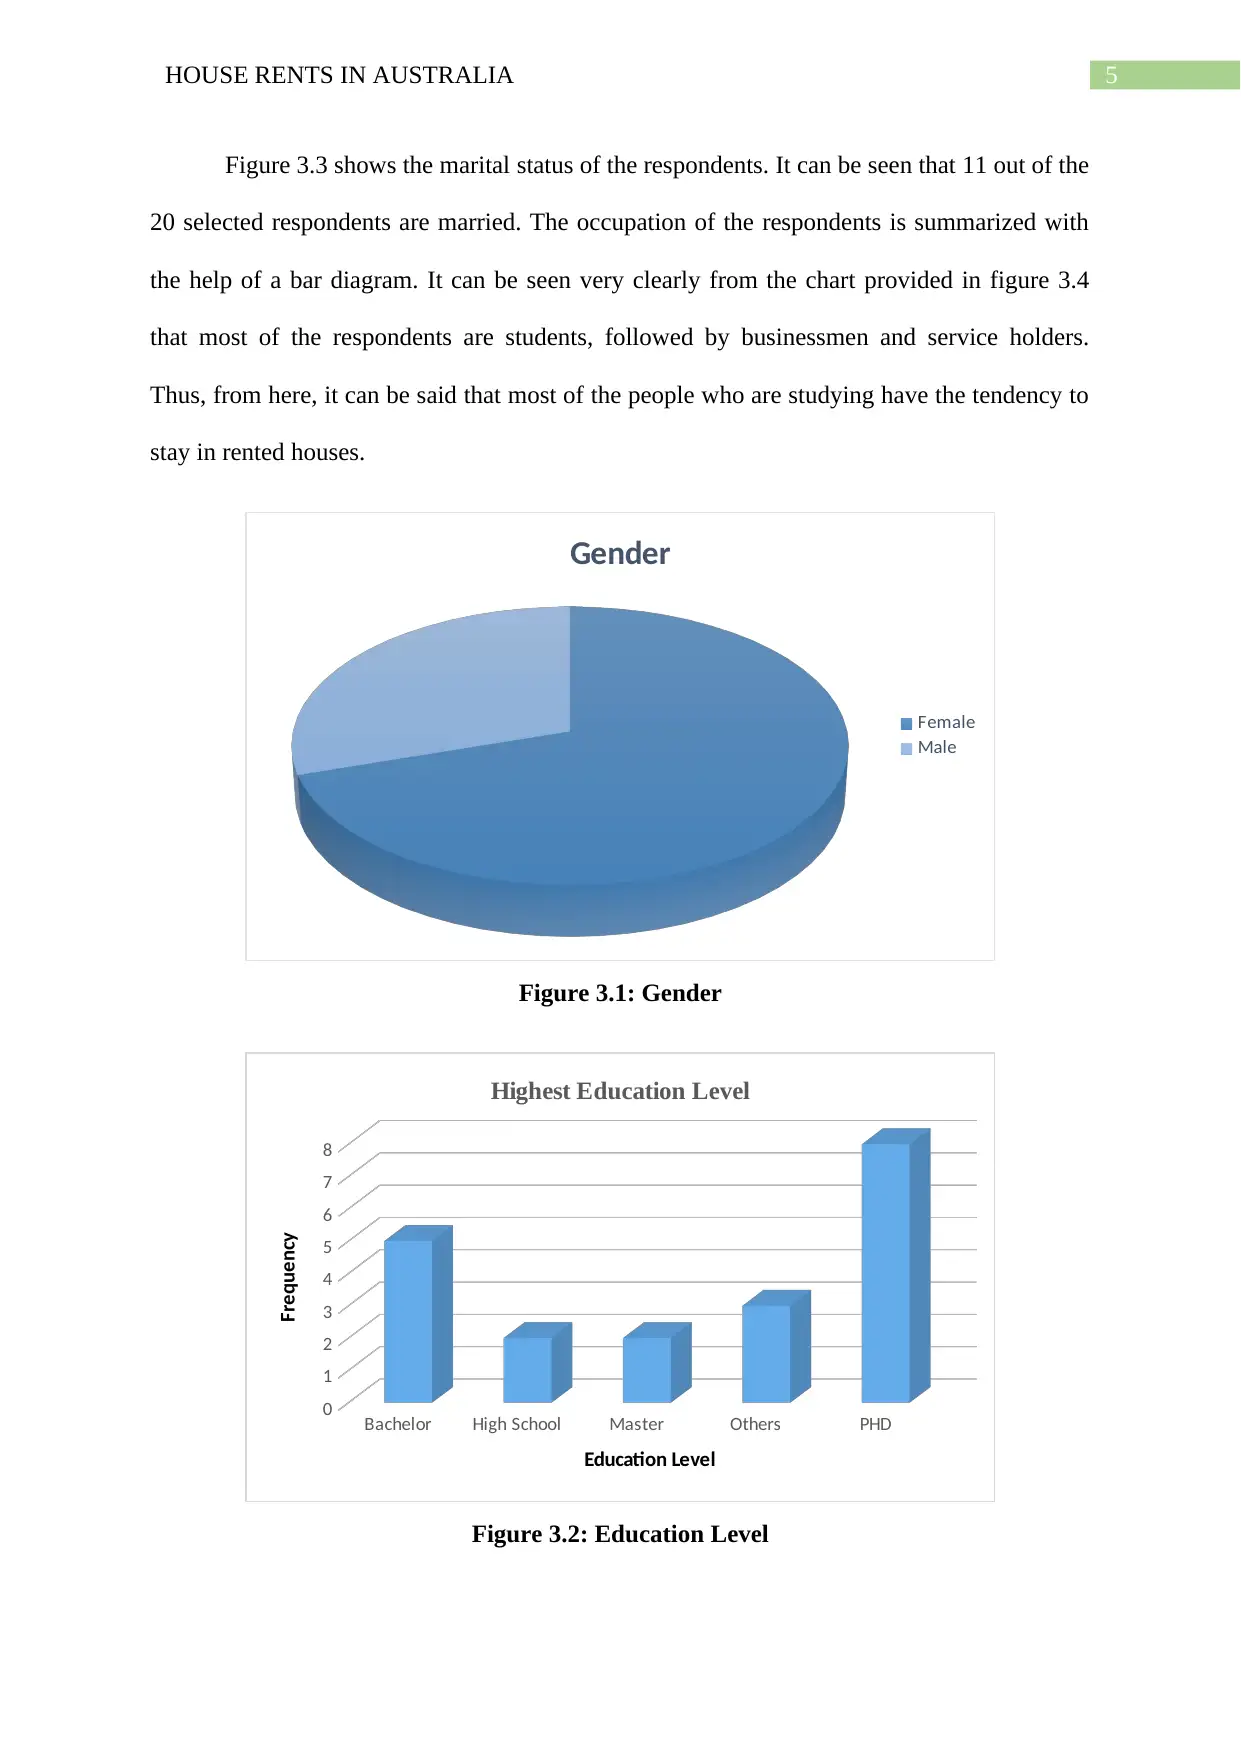
The summary of the dataset is presented in this section. It can be seen from the pie
chart given in figure 3.1, it can be seen clearly that out of the 20 respondents chosen, most of
them were females. There were 14 female members and 6 male members in the data.
Figure 3.2 shows the highest degree of education of the respondents. It can be seen
clearly from the figure that most of the respondents residing in rested houses in the Australian
suburbs have PHD as their highest degree of education. 8 People in the sample selected have
completed their PHD.
which will inform about the respondent’s gender, age, Highest level of education attained,
marital status, occupation, annual income, number of members in the family, weekly rent
paid, number of bedrooms in the rented apartment and the bond amount that has been paid at
the time of renting the apartment. All these details will be of help in answering the
aforementioned research questions.
From the listed questions that will be asked to the participants of the study, it can be
said that gender, highest level of education, marital status, occupation are all categorical
variables whereas, all the other variables such as, annual income, number of family members,
weekly rent paid, number of bedrooms and the bond amount are all numeric variables. The
questionnaire will be distributed to 20 people who rent a place in the Australian Suburbs. The
participants will be selected at random for the purpose of the study so that there are no biases
in the results obtained and can represent the whole population. There is some information
asked in the questionnaire to which the respondents might not be that comfortable to answer
for security issues. Thus, each of the selected respondents have been assured that all the
collected information will be highly secure and confidential and will not be shared with
anybody who are not involved in the study.
3.0 Summary of the Dataset
The summary of the dataset is presented in this section. It can be seen from the pie
chart given in figure 3.1, it can be seen clearly that out of the 20 respondents chosen, most of
them were females. There were 14 female members and 6 male members in the data.
Figure 3.2 shows the highest degree of education of the respondents. It can be seen
clearly from the figure that most of the respondents residing in rested houses in the Australian
suburbs have PHD as their highest degree of education. 8 People in the sample selected have
completed their PHD.
5HOUSE RENTS IN AUSTRALIA
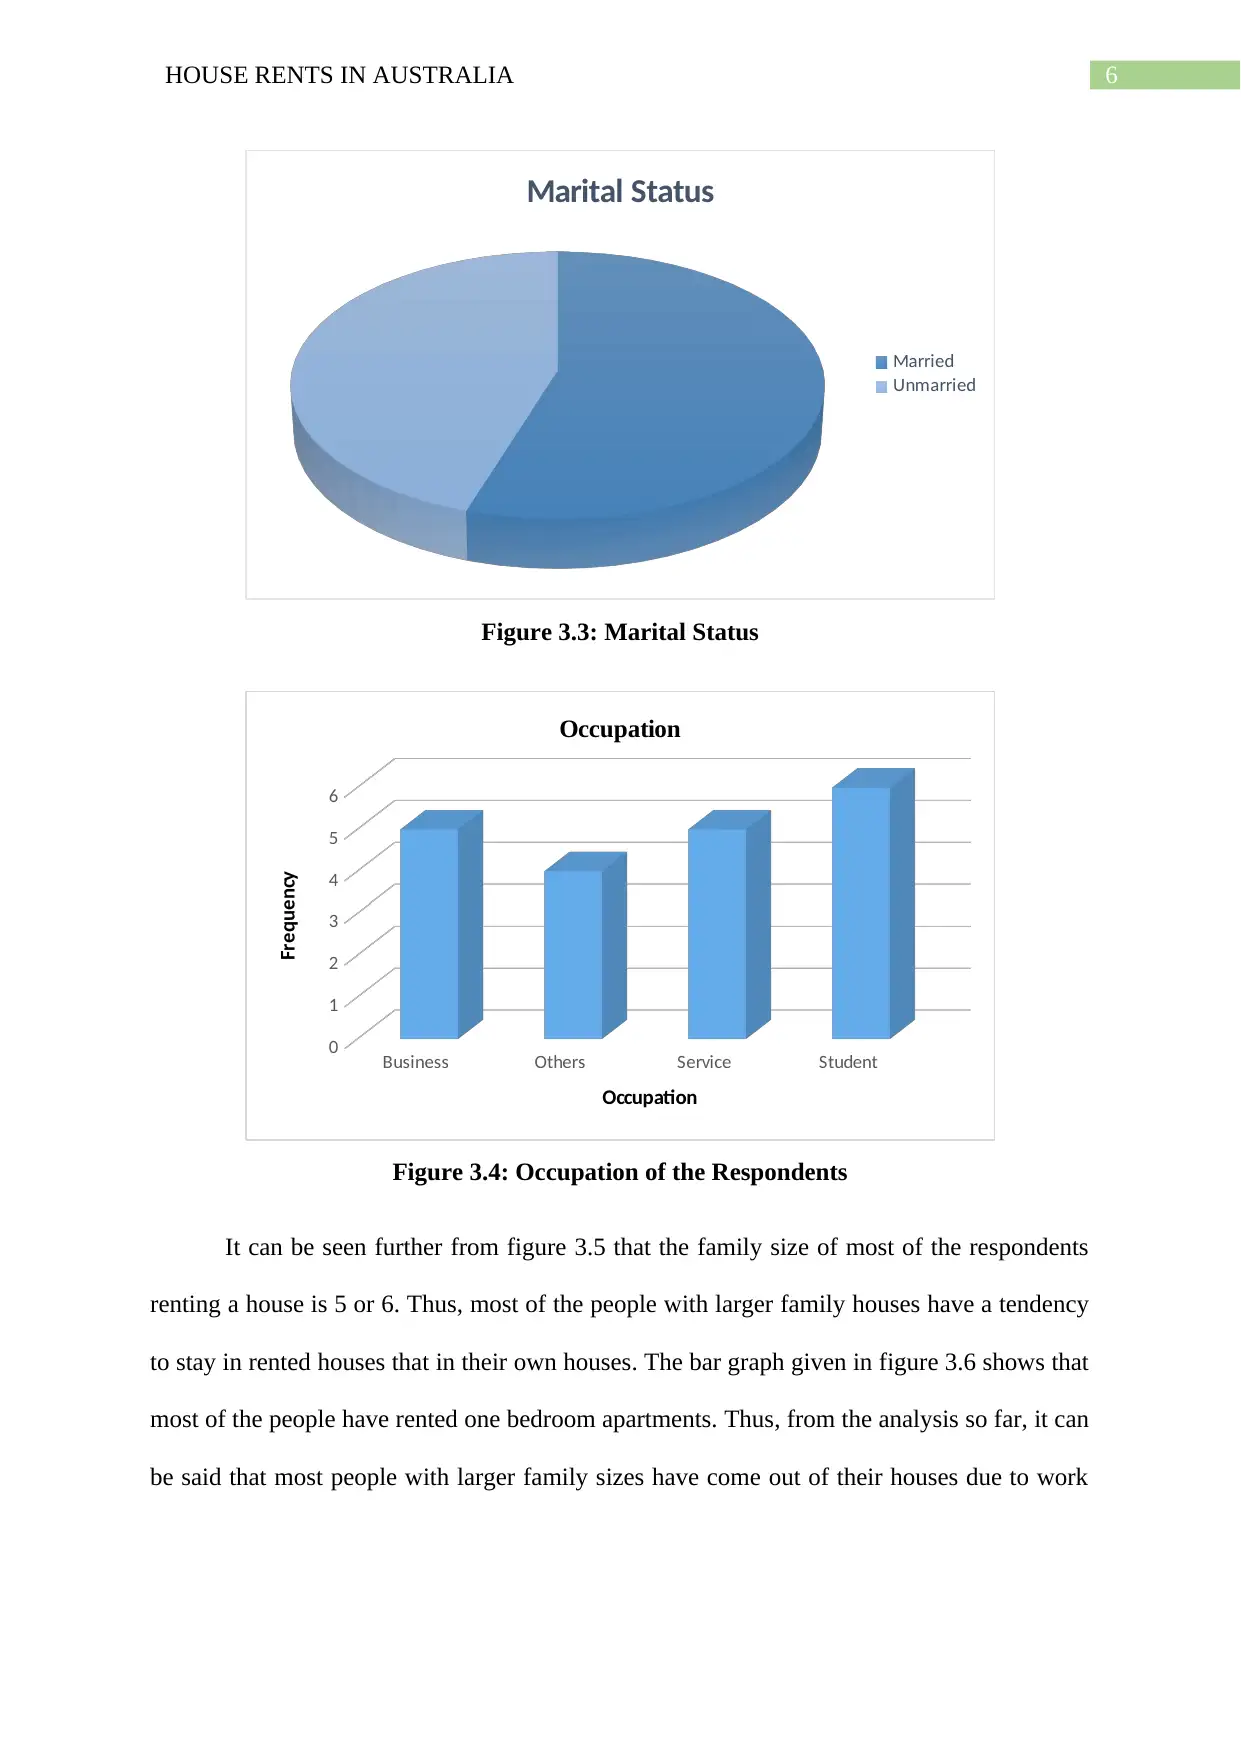
Figure 3.3 shows the marital status of the respondents. It can be seen that 11 out of the
20 selected respondents are married. The occupation of the respondents is summarized with
the help of a bar diagram. It can be seen very clearly from the chart provided in figure 3.4
that most of the respondents are students, followed by businessmen and service holders.
Thus, from here, it can be said that most of the people who are studying have the tendency to
stay in rented houses.
Gender
Female
Male
Figure 3.1: Gender
Bachelor High School Master Others PHD
0
1
2
3
4
5
6
7
8
Highest Education Level
Education Level
Frequency
Figure 3.2: Education Level
⊘ This is a preview!⊘
Do you want full access?
Subscribe today to unlock all pages.
Trusted by 1+ million students worldwide
6HOUSE RENTS IN AUSTRALIA
Marital Status
Married
Unmarried
Figure 3.3: Marital Status
Business Others Service Student
0
1
2
3
4
5
6
Occupation
Occupation
Frequency
Figure 3.4: Occupation of the Respondents
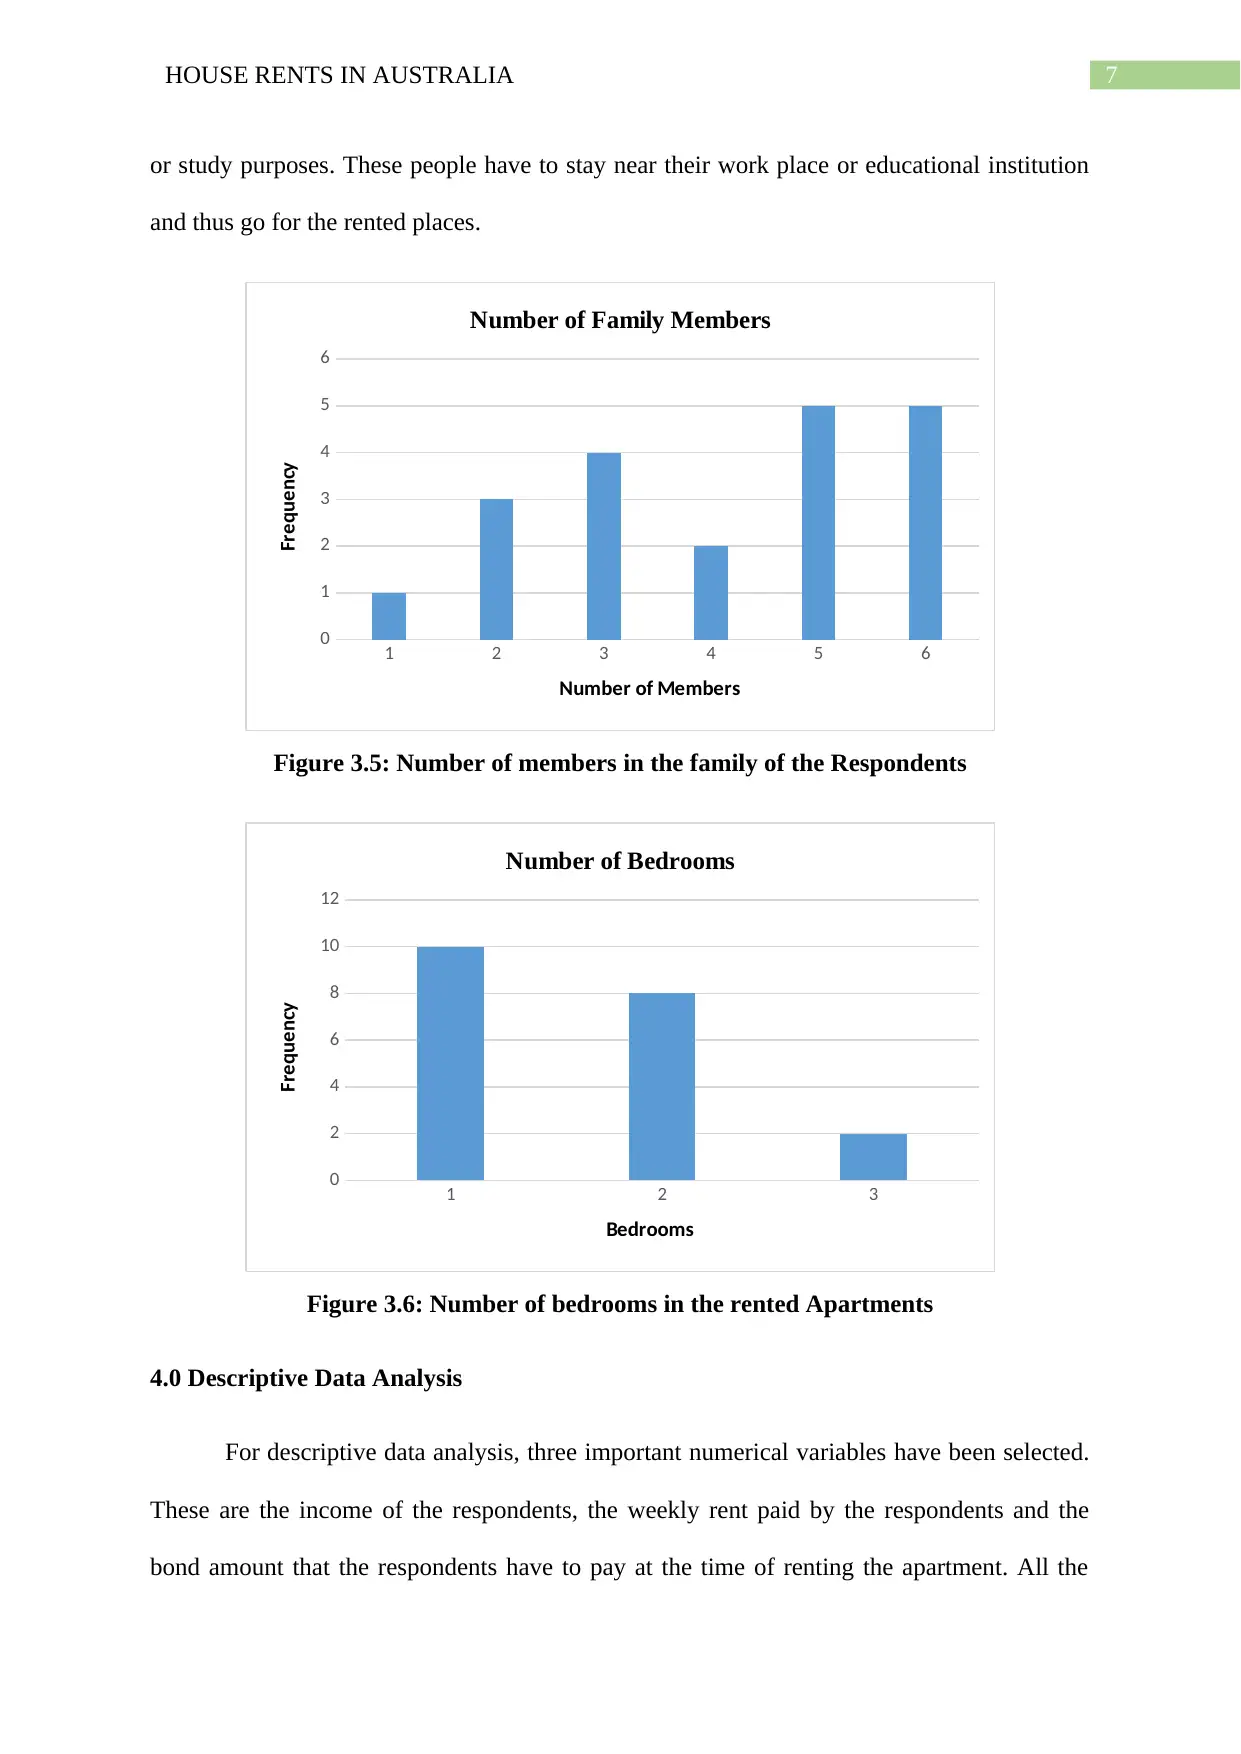
It can be seen further from figure 3.5 that the family size of most of the respondents
renting a house is 5 or 6. Thus, most of the people with larger family houses have a tendency
to stay in rented houses that in their own houses. The bar graph given in figure 3.6 shows that
most of the people have rented one bedroom apartments. Thus, from the analysis so far, it can
be said that most people with larger family sizes have come out of their houses due to work
Marital Status
Married
Unmarried
Figure 3.3: Marital Status
Business Others Service Student
0
1
2
3
4
5
6
Occupation
Occupation
Frequency
Figure 3.4: Occupation of the Respondents
It can be seen further from figure 3.5 that the family size of most of the respondents
renting a house is 5 or 6. Thus, most of the people with larger family houses have a tendency
to stay in rented houses that in their own houses. The bar graph given in figure 3.6 shows that
most of the people have rented one bedroom apartments. Thus, from the analysis so far, it can
be said that most people with larger family sizes have come out of their houses due to work
Paraphrase This Document
Need a fresh take? Get an instant paraphrase of this document with our AI Paraphraser
7HOUSE RENTS IN AUSTRALIA
or study purposes. These people have to stay near their work place or educational institution
and thus go for the rented places.
1 2 3 4 5 6
0
1
2
3
4
5
6
Number of Family Members
Number of Members
Frequency
Figure 3.5: Number of members in the family of the Respondents
1 2 3
0
2
4
6
8
10
12
Number of Bedrooms
Bedrooms
Frequency
Figure 3.6: Number of bedrooms in the rented Apartments
4.0 Descriptive Data Analysis
For descriptive data analysis, three important numerical variables have been selected.
These are the income of the respondents, the weekly rent paid by the respondents and the
bond amount that the respondents have to pay at the time of renting the apartment. All the
8HOUSE RENTS IN AUSTRALIA
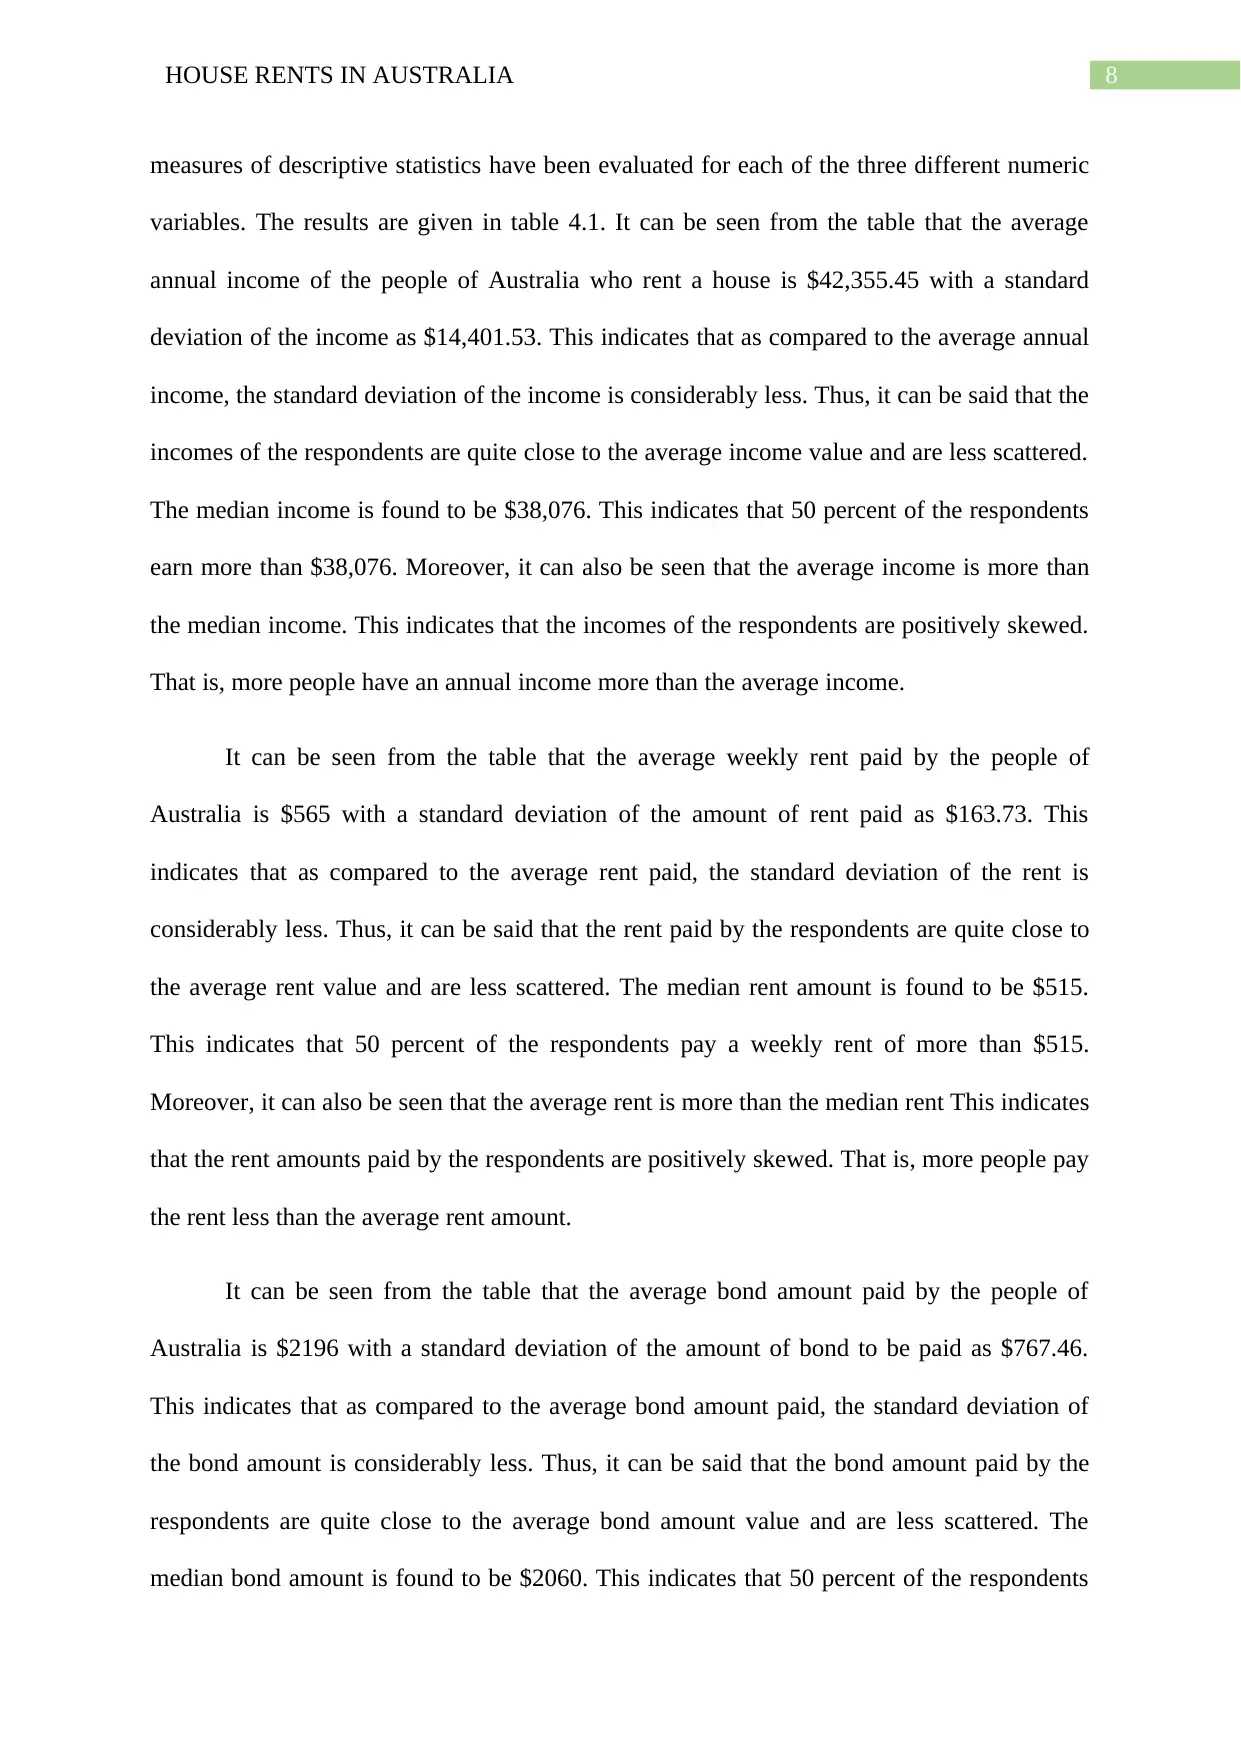
measures of descriptive statistics have been evaluated for each of the three different numeric
variables. The results are given in table 4.1. It can be seen from the table that the average
annual income of the people of Australia who rent a house is $42,355.45 with a standard
deviation of the income as $14,401.53. This indicates that as compared to the average annual
income, the standard deviation of the income is considerably less. Thus, it can be said that the
incomes of the respondents are quite close to the average income value and are less scattered.
The median income is found to be $38,076. This indicates that 50 percent of the respondents
earn more than $38,076. Moreover, it can also be seen that the average income is more than
the median income. This indicates that the incomes of the respondents are positively skewed.
That is, more people have an annual income more than the average income.
It can be seen from the table that the average weekly rent paid by the people of
Australia is $565 with a standard deviation of the amount of rent paid as $163.73. This
indicates that as compared to the average rent paid, the standard deviation of the rent is
considerably less. Thus, it can be said that the rent paid by the respondents are quite close to
the average rent value and are less scattered. The median rent amount is found to be $515.
This indicates that 50 percent of the respondents pay a weekly rent of more than $515.
Moreover, it can also be seen that the average rent is more than the median rent This indicates
that the rent amounts paid by the respondents are positively skewed. That is, more people pay
the rent less than the average rent amount.
It can be seen from the table that the average bond amount paid by the people of
Australia is $2196 with a standard deviation of the amount of bond to be paid as $767.46.
This indicates that as compared to the average bond amount paid, the standard deviation of
the bond amount is considerably less. Thus, it can be said that the bond amount paid by the
respondents are quite close to the average bond amount value and are less scattered. The
median bond amount is found to be $2060. This indicates that 50 percent of the respondents
⊘ This is a preview!⊘
Do you want full access?
Subscribe today to unlock all pages.
Trusted by 1+ million students worldwide
9HOUSE RENTS IN AUSTRALIA
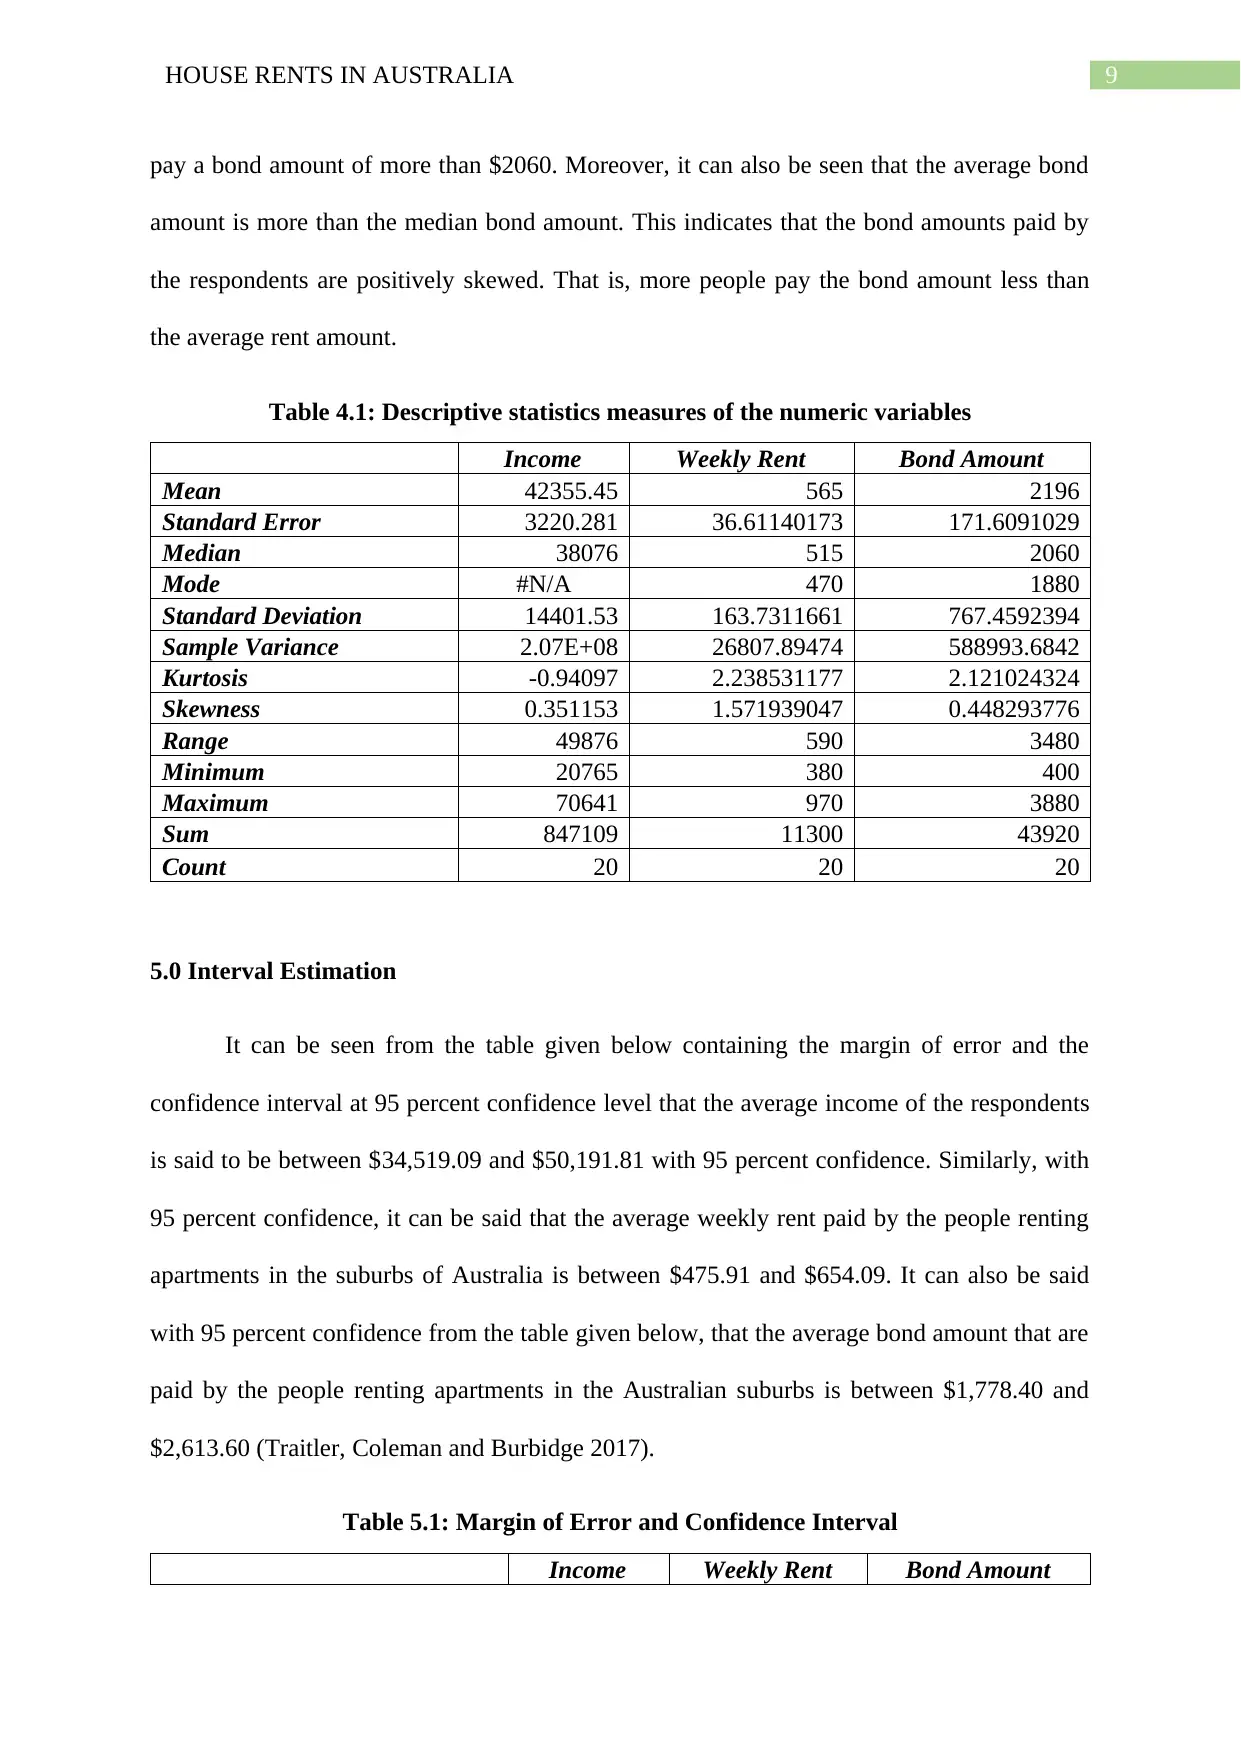
pay a bond amount of more than $2060. Moreover, it can also be seen that the average bond
amount is more than the median bond amount. This indicates that the bond amounts paid by
the respondents are positively skewed. That is, more people pay the bond amount less than
the average rent amount.
Table 4.1: Descriptive statistics measures of the numeric variables
Income Weekly Rent Bond Amount
Mean 42355.45 565 2196
Standard Error 3220.281 36.61140173 171.6091029
Median 38076 515 2060
Mode #N/A 470 1880
Standard Deviation 14401.53 163.7311661 767.4592394
Sample Variance 2.07E+08 26807.89474 588993.6842
Kurtosis -0.94097 2.238531177 2.121024324
Skewness 0.351153 1.571939047 0.448293776
Range 49876 590 3480
Minimum 20765 380 400
Maximum 70641 970 3880
Sum 847109 11300 43920
Count 20 20 20
5.0 Interval Estimation
It can be seen from the table given below containing the margin of error and the
confidence interval at 95 percent confidence level that the average income of the respondents
is said to be between $34,519.09 and $50,191.81 with 95 percent confidence. Similarly, with
95 percent confidence, it can be said that the average weekly rent paid by the people renting
apartments in the suburbs of Australia is between $475.91 and $654.09. It can also be said
with 95 percent confidence from the table given below, that the average bond amount that are
paid by the people renting apartments in the Australian suburbs is between $1,778.40 and
$2,613.60 (Traitler, Coleman and Burbidge 2017).
Table 5.1: Margin of Error and Confidence Interval
Income Weekly Rent Bond Amount
Paraphrase This Document
Need a fresh take? Get an instant paraphrase of this document with our AI Paraphraser
10HOUSE RENTS IN AUSTRALIA
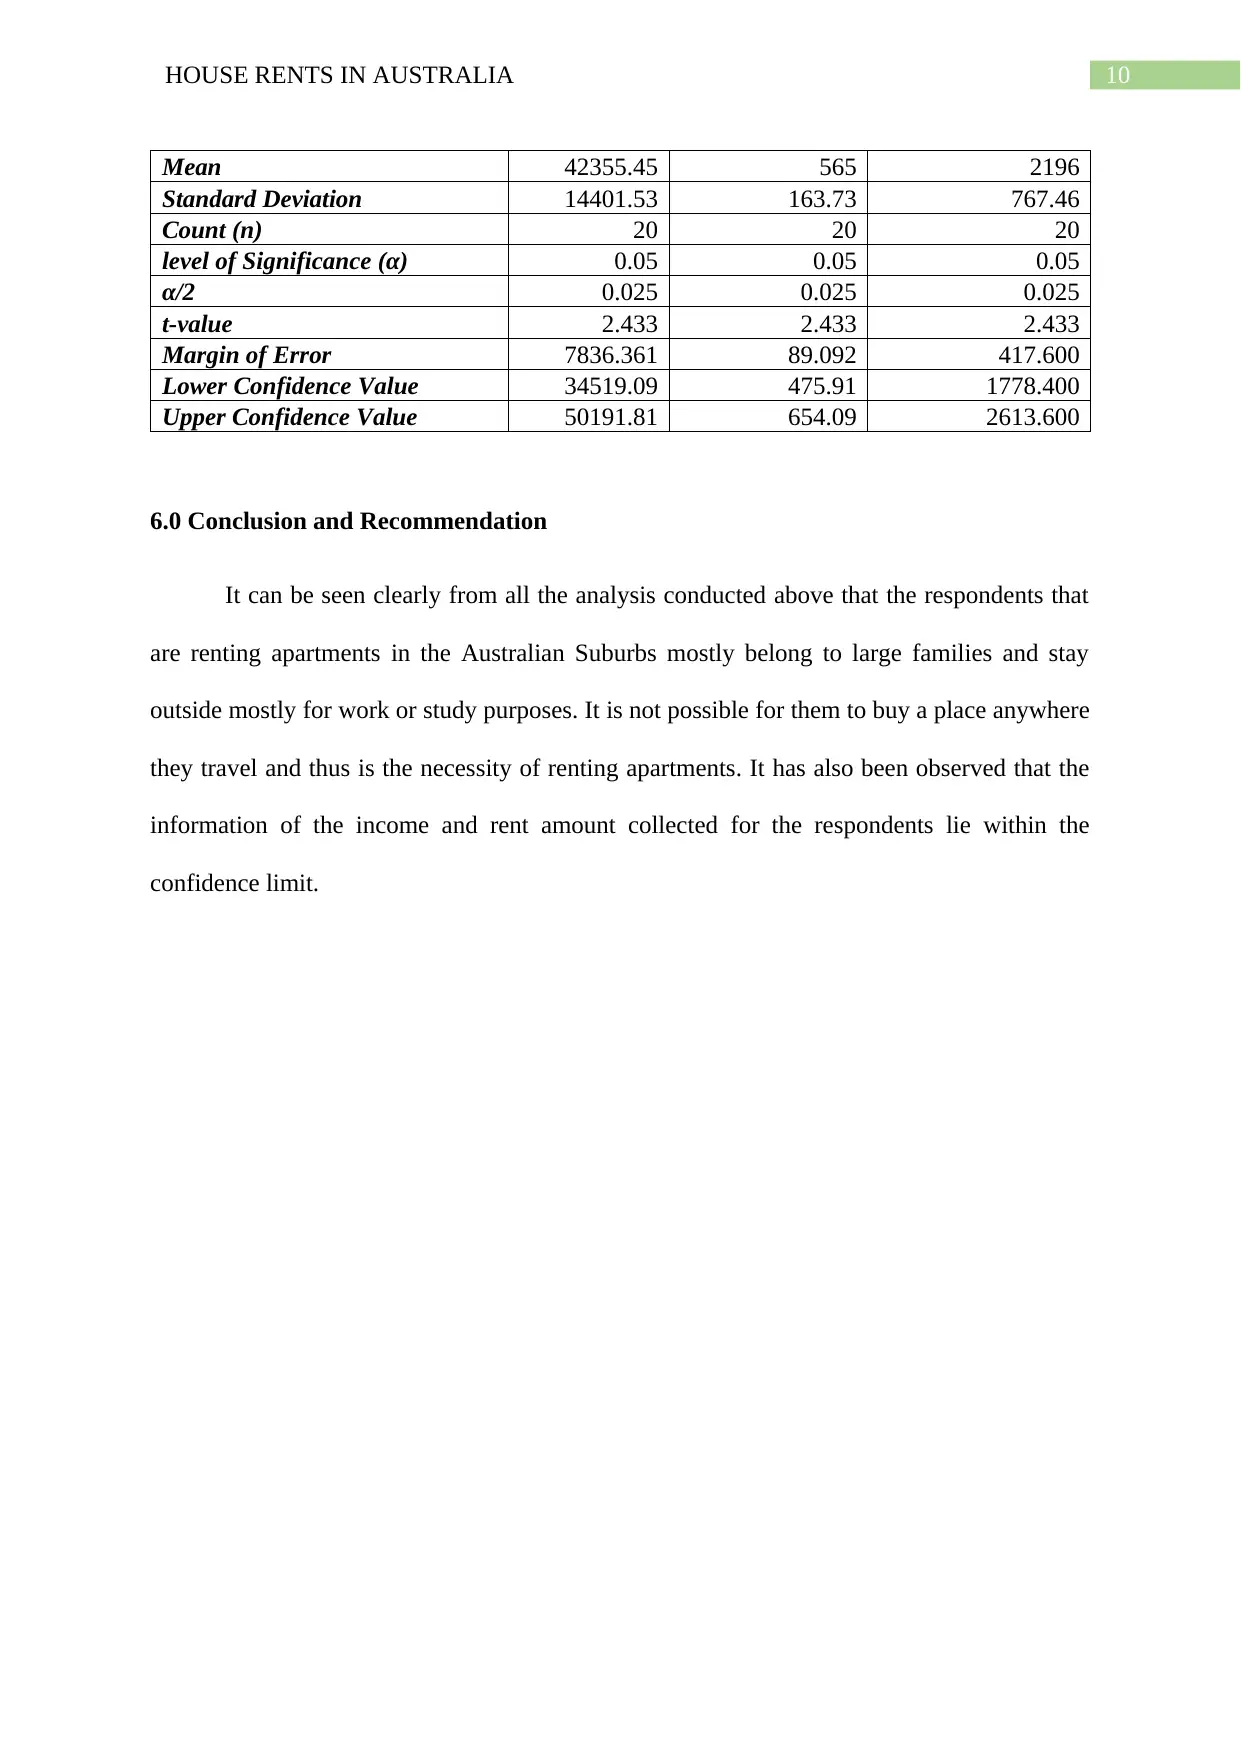
Mean 42355.45 565 2196
Standard Deviation 14401.53 163.73 767.46
Count (n) 20 20 20
level of Significance (α) 0.05 0.05 0.05
α/2 0.025 0.025 0.025
t-value 2.433 2.433 2.433
Margin of Error 7836.361 89.092 417.600
Lower Confidence Value 34519.09 475.91 1778.400
Upper Confidence Value 50191.81 654.09 2613.600
6.0 Conclusion and Recommendation
It can be seen clearly from all the analysis conducted above that the respondents that
are renting apartments in the Australian Suburbs mostly belong to large families and stay
outside mostly for work or study purposes. It is not possible for them to buy a place anywhere
they travel and thus is the necessity of renting apartments. It has also been observed that the
information of the income and rent amount collected for the respondents lie within the
confidence limit.
11HOUSE RENTS IN AUSTRALIA
References
Ruming, K. and Dowling, R., 2017. PhD students’ housing experiences in suburban Sydney,
Australia. Journal of Housing and the Built Environment, 32(4), pp.805-825.
Neutze, M., 2016. The suburban apartment boom: case study of a land use problem.
Routledge.
Willing, R. and Pojani, D., 2017. Is the suburban dream still alive in Australia? Evidence
from Brisbane. Australian Planner, 54(2), pp.67-79.
Rosewall, T. and Shoory, M., 2017. Houses and Apartments in Australia. RBA Bulletin, June,
pp.1-11.
Hulse, K., Martin, C., James, A. and Stone, W., 2018. Private rental in transition: institutional
change, technology and innovation in Australia.
Traitler, H., Coleman, B. and Burbidge, A., 2017. Testing the hypotheses. Food Industry
R&D: A New Approach, pp.227-247.
⊘ This is a preview!⊘
Do you want full access?
Subscribe today to unlock all pages.
Trusted by 1+ million students worldwide
1 out of 14
Related Documents


Your All-in-One AI-Powered Toolkit for Academic Success.
+13062052269
info@desklib.com
Available 24*7 on WhatsApp / Email
![[object Object]](/_next/static/media/star-bottom.7253800d.svg)
Unlock your academic potential
Copyright © 2020–2026 A2Z Services. All Rights Reserved. Developed and managed by ZUCOL.