Comparative Analysis: Wheat Quality in Australia and India Report
VerifiedAdded on 2023/06/13
|15
|3064
|244
Report
AI Summary
This report provides a comparative analysis of wheat quality in Australia and India, employing Total Quality Management (TQM) tools to evaluate the data. It begins with an introduction to TQM and its relevance to the study, outlining the project's objectives to analyze wheat quality, develop a comprehensive report, and accumulate secondary data for effective analysis. Research questions focus on determining and comparing the quality quotients of wheat crops in both countries. The methodology involves qualitative data analysis, utilizing tools such as flowcharts, histograms, Pareto charts, cause-and-effect diagrams, and the Taguchi method. Project milestones and schedules are detailed, including tasks from project initiation to report submission. The report aims to provide insights into the factors influencing wheat quality in both regions, contributing to a better understanding of agricultural practices and standards.
Running head: FINAL PROJECT REPORT
Final Project Report: Comparing the wheat quality grown in Australia
and India
Name of the Student:
Student ID:
Name of the University:
Author’s note:
Final Project Report: Comparing the wheat quality grown in Australia
and India
Name of the Student:
Student ID:
Name of the University:
Author’s note:
Paraphrase This Document
Need a fresh take? Get an instant paraphrase of this document with our AI Paraphraser
1FINAL PROJECT REPORT
Table of Contents
Introduction......................................................................................................................................2
Project Brief.....................................................................................................................................2
Project Objectives............................................................................................................................3
Research Questions..........................................................................................................................3
Literature Review............................................................................................................................4
Methodology....................................................................................................................................4
Types of TQM tools for project.......................................................................................................5
Project Milestones...........................................................................................................................6
Project Schedule..............................................................................................................................6
Gantt chart of the Project.................................................................................................................8
Responsibility of each team member...............................................................................................9
Conclusion.......................................................................................................................................9
Bibliography..................................................................................................................................11
2FINAL PROJECT REPORT
Introduction
The study of TQM or total quality management is based on the alignment of the activities
and formation of the operations listing the management of the operations (Dale 2015). The use of
TQM would help in easing the formation of the effective operation development. The alignment
of the operations would also help in forming the study of the wheat quality of two countries
(Australia and India). The TQM study would be helpful for using accumulated data and applying
flowcharts, histograms, Pareto charts, cause and effect diagrams, and Taguchi method for
developing the final summary.
The following assignment would be developed for forming the analysis of the successive
development of the effective system operations. The topic is helpful for the alignment of the data
and forming the use of TQM methods for drawing a conclusion of the selected topic. Moreover,
the alignment of the effective analysis methods would ensure that the deployment of the
operations would support the management of the project summary.
Project Brief
The topic deals with the usage of the secondary data collected on the topic of quality of
wheat produced in Australia and India. The successive development of the improved data
analysis would also help in forming the alignment of the operations. The formation of the general
study would be helpful for the management of the improved functional development that is
capable for the alignment of the study development.
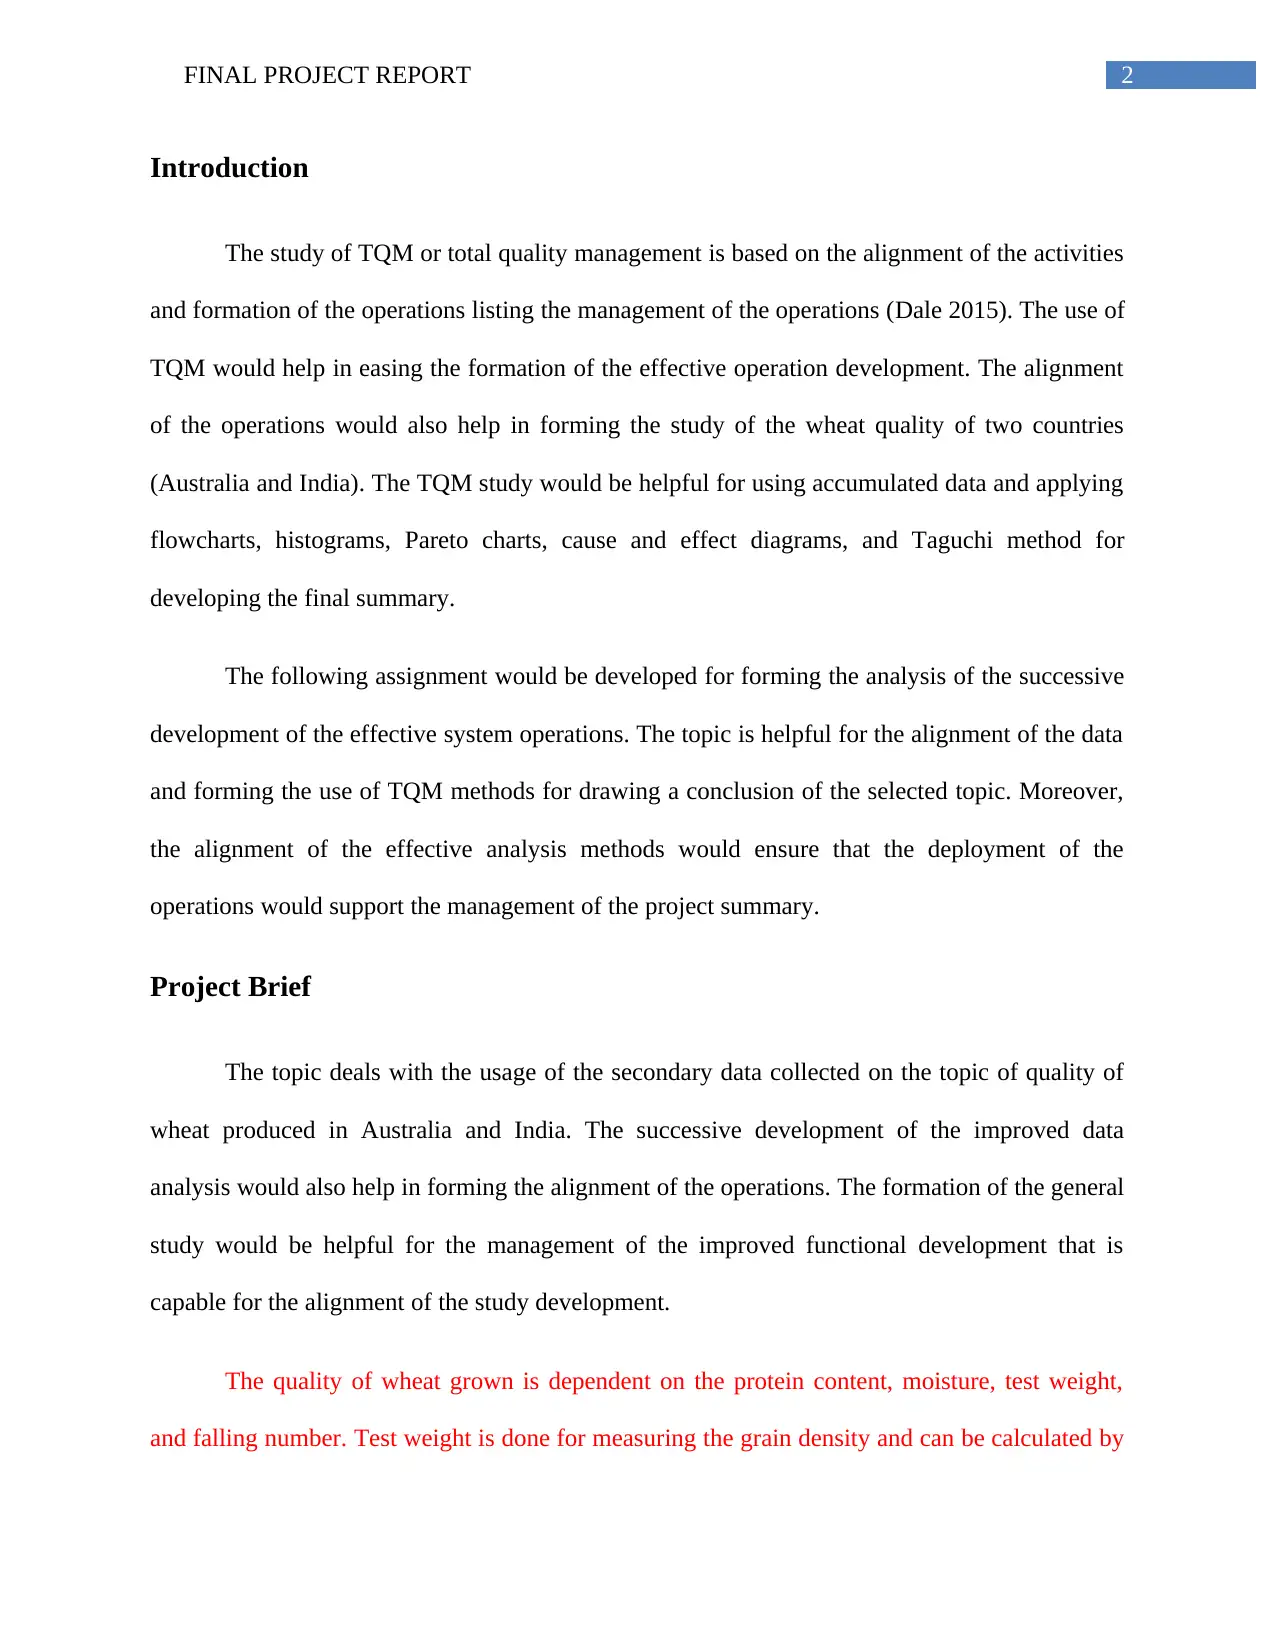
The quality of wheat grown is dependent on the protein content, moisture, test weight,
and falling number. Test weight is done for measuring the grain density and can be calculated by
Introduction
The study of TQM or total quality management is based on the alignment of the activities
and formation of the operations listing the management of the operations (Dale 2015). The use of
TQM would help in easing the formation of the effective operation development. The alignment
of the operations would also help in forming the study of the wheat quality of two countries
(Australia and India). The TQM study would be helpful for using accumulated data and applying
flowcharts, histograms, Pareto charts, cause and effect diagrams, and Taguchi method for
developing the final summary.
The following assignment would be developed for forming the analysis of the successive
development of the effective system operations. The topic is helpful for the alignment of the data
and forming the use of TQM methods for drawing a conclusion of the selected topic. Moreover,
the alignment of the effective analysis methods would ensure that the deployment of the
operations would support the management of the project summary.
Project Brief
The topic deals with the usage of the secondary data collected on the topic of quality of
wheat produced in Australia and India. The successive development of the improved data
analysis would also help in forming the alignment of the operations. The formation of the general
study would be helpful for the management of the improved functional development that is
capable for the alignment of the study development.
The quality of wheat grown is dependent on the protein content, moisture, test weight,
and falling number. Test weight is done for measuring the grain density and can be calculated by
⊘ This is a preview!⊘
Do you want full access?
Subscribe today to unlock all pages.
Trusted by 1+ million students worldwide
3FINAL PROJECT REPORT
the use of Schopper Chondrometer in terms of kg/hL. The moisture is the approximation of the
water content in the wheat by the use of the calculation of weight loss by heating the sample till
140 degree Celsius. The protein content in the wheat grain is calculated by using Dumas
(Combustion) method or Kjeldahl method. The falling number is the measure of weather damage
to the wheat in terms of sprouting.
The quality of wheat grown is Australia ahs to meet the standards set by the Australian
Panel for Wheat Quality. The wheat classification in Australia is done based on the specific
geographical zones of Northern classification zone, including Queensland and Northern NSW,
South-Eastern classification zone – Southern NSW, Southern classification zone, including
Victoria and South Australia, and Western classification zone – Western Australia (Zones 2018).
The various classes of wheat grown in Australia are Australian Hard (AH), Australian Premium
White (APW), Australian Standard White (ASW), Australian Premium Durum (ADR),
Australian Soft (ASFT), Australian Standard Noodle Wheat (ANW), and Australian Feed
(FEED) (Classes 2018). On the other hand the quality of wheat grown in India can be classified
into the following table,
the use of Schopper Chondrometer in terms of kg/hL. The moisture is the approximation of the
water content in the wheat by the use of the calculation of weight loss by heating the sample till
140 degree Celsius. The protein content in the wheat grain is calculated by using Dumas
(Combustion) method or Kjeldahl method. The falling number is the measure of weather damage
to the wheat in terms of sprouting.
The quality of wheat grown is Australia ahs to meet the standards set by the Australian
Panel for Wheat Quality. The wheat classification in Australia is done based on the specific
geographical zones of Northern classification zone, including Queensland and Northern NSW,
South-Eastern classification zone – Southern NSW, Southern classification zone, including
Victoria and South Australia, and Western classification zone – Western Australia (Zones 2018).
The various classes of wheat grown in Australia are Australian Hard (AH), Australian Premium
White (APW), Australian Standard White (ASW), Australian Premium Durum (ADR),
Australian Soft (ASFT), Australian Standard Noodle Wheat (ANW), and Australian Feed
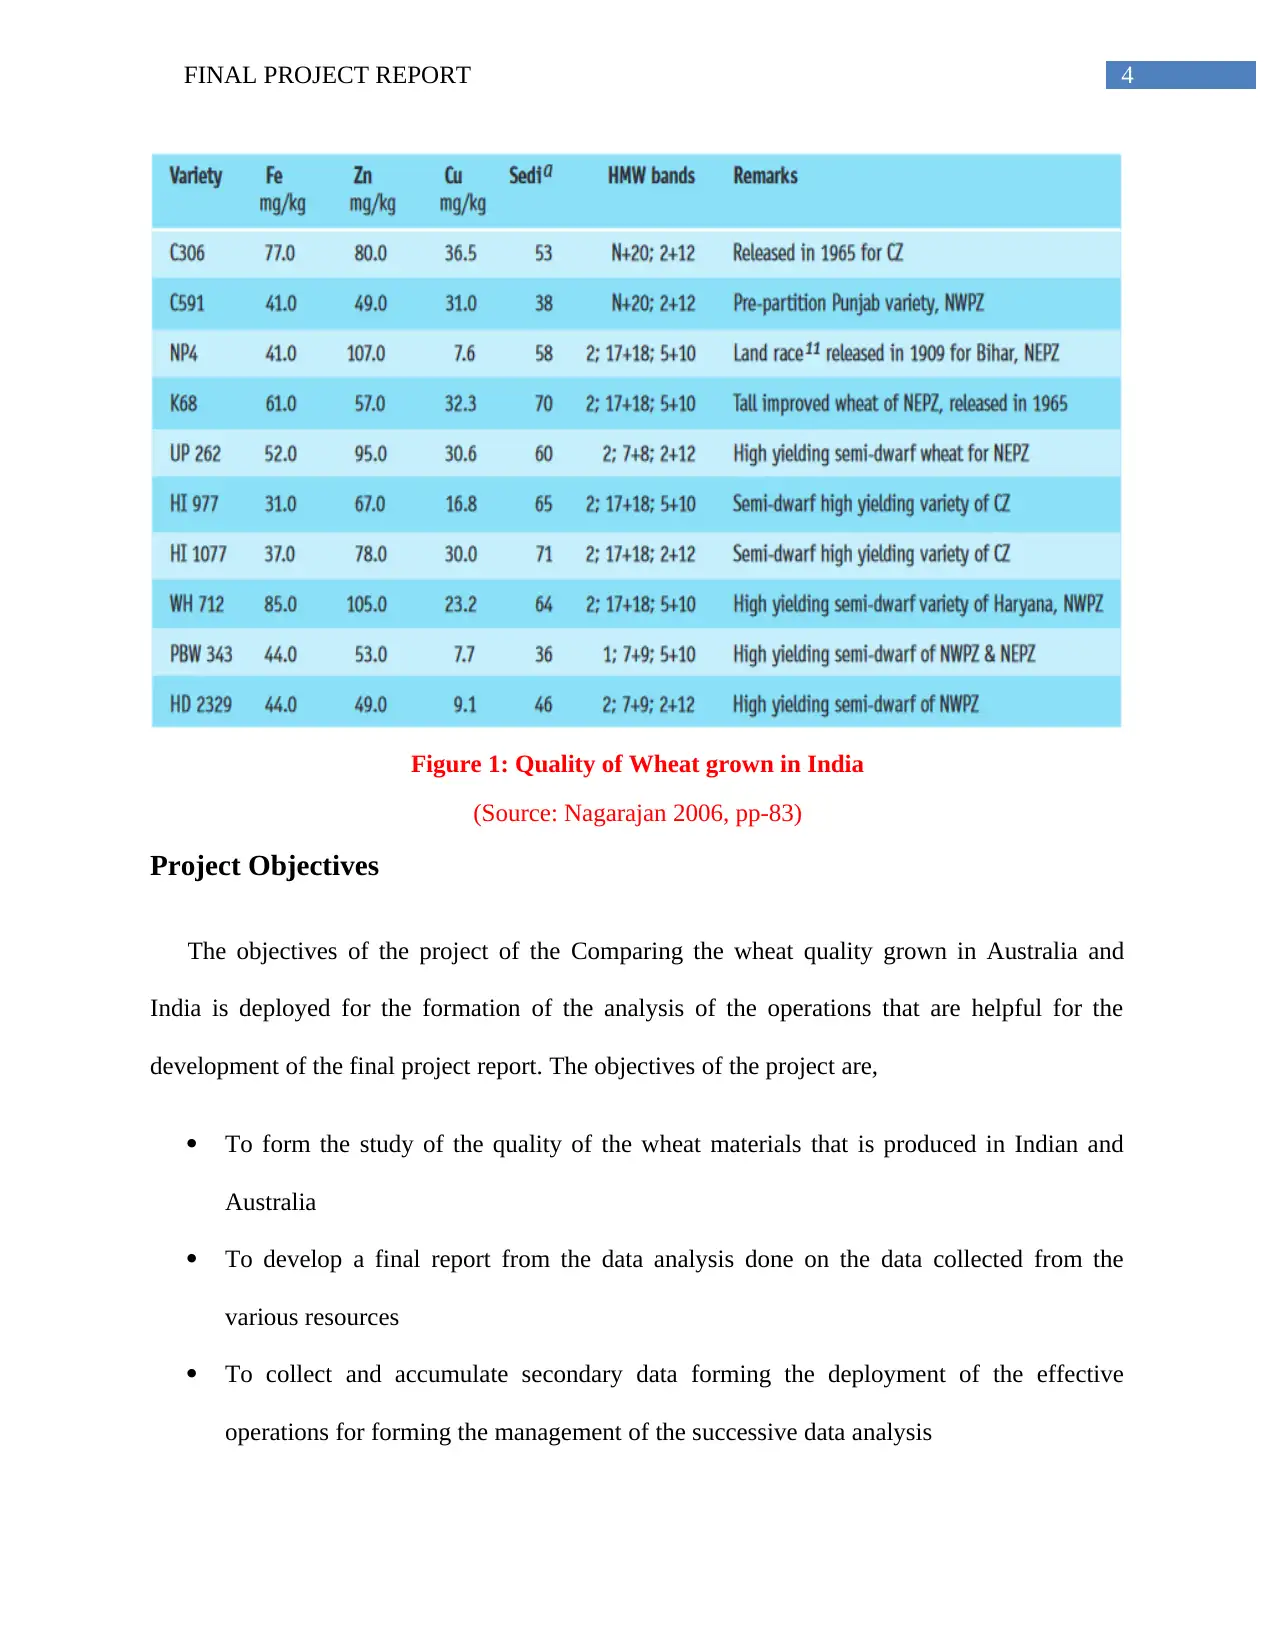
(FEED) (Classes 2018). On the other hand the quality of wheat grown in India can be classified
into the following table,
Paraphrase This Document
Need a fresh take? Get an instant paraphrase of this document with our AI Paraphraser
4FINAL PROJECT REPORT
Figure 1: Quality of Wheat grown in India
(Source: Nagarajan 2006, pp-83)
Project Objectives
The objectives of the project of the Comparing the wheat quality grown in Australia and
India is deployed for the formation of the analysis of the operations that are helpful for the
development of the final project report. The objectives of the project are,
To form the study of the quality of the wheat materials that is produced in Indian and
Australia
To develop a final report from the data analysis done on the data collected from the
various resources
To collect and accumulate secondary data forming the deployment of the effective
operations for forming the management of the successive data analysis
5FINAL PROJECT REPORT
Research Questions
The following are the research questions for the study of the project of comparing the wheat
quality grown in Australia and India,
a. What is the quality quotient for the wheat crops grown in Australia?
b. What is the quality quotient for the wheat crops grown in India?
c. On comparison of the two quality quotients which one is better?
Literature Review
According to Sallis (2014), the quality analysis is one of the most crucial factors for the
formation of the final project deliverable. The quality analysis is based on various factors such as
the alignment of the improved operations and product services. According to Ross (2017), the
study of various literatures would help in easing the data collection for the topic. The
implementation of the operations would also serve the major role for the alignment of the final
project deliverable. The quality analysis is developed based on the formation of the factors
favoring the inclination of the operations (Goetsch and Davis 2014). The wheat quality would be
based on the alignment of the successive methodologies producing the final report development.
The alignment of the operations would be helpful for forming the management of the successive
development. The wheat quality is analyzed for the alignment of the operations. The inclination
of the operations would also help in easing the formation of the successful deployment of the
activities (Oakland 2014). The utilization of the activities would be based on the alignment of the
operations favoring the deployment of the operations.
⊘ This is a preview!⊘
Do you want full access?
Subscribe today to unlock all pages.
Trusted by 1+ million students worldwide
6FINAL PROJECT REPORT
Methodology
The use of qualitative analysis would be based on the deployment of the activities
favoring the formation of the utilization of the formation. The inclination of the successive
development would also help in accumulation of the data favoring the study. The use of
qualitative data analysis would be aligned for the formation of the operations. The qualitative
data analysis would be aligned for the deployment of the activities favoring the formation of the
operations.
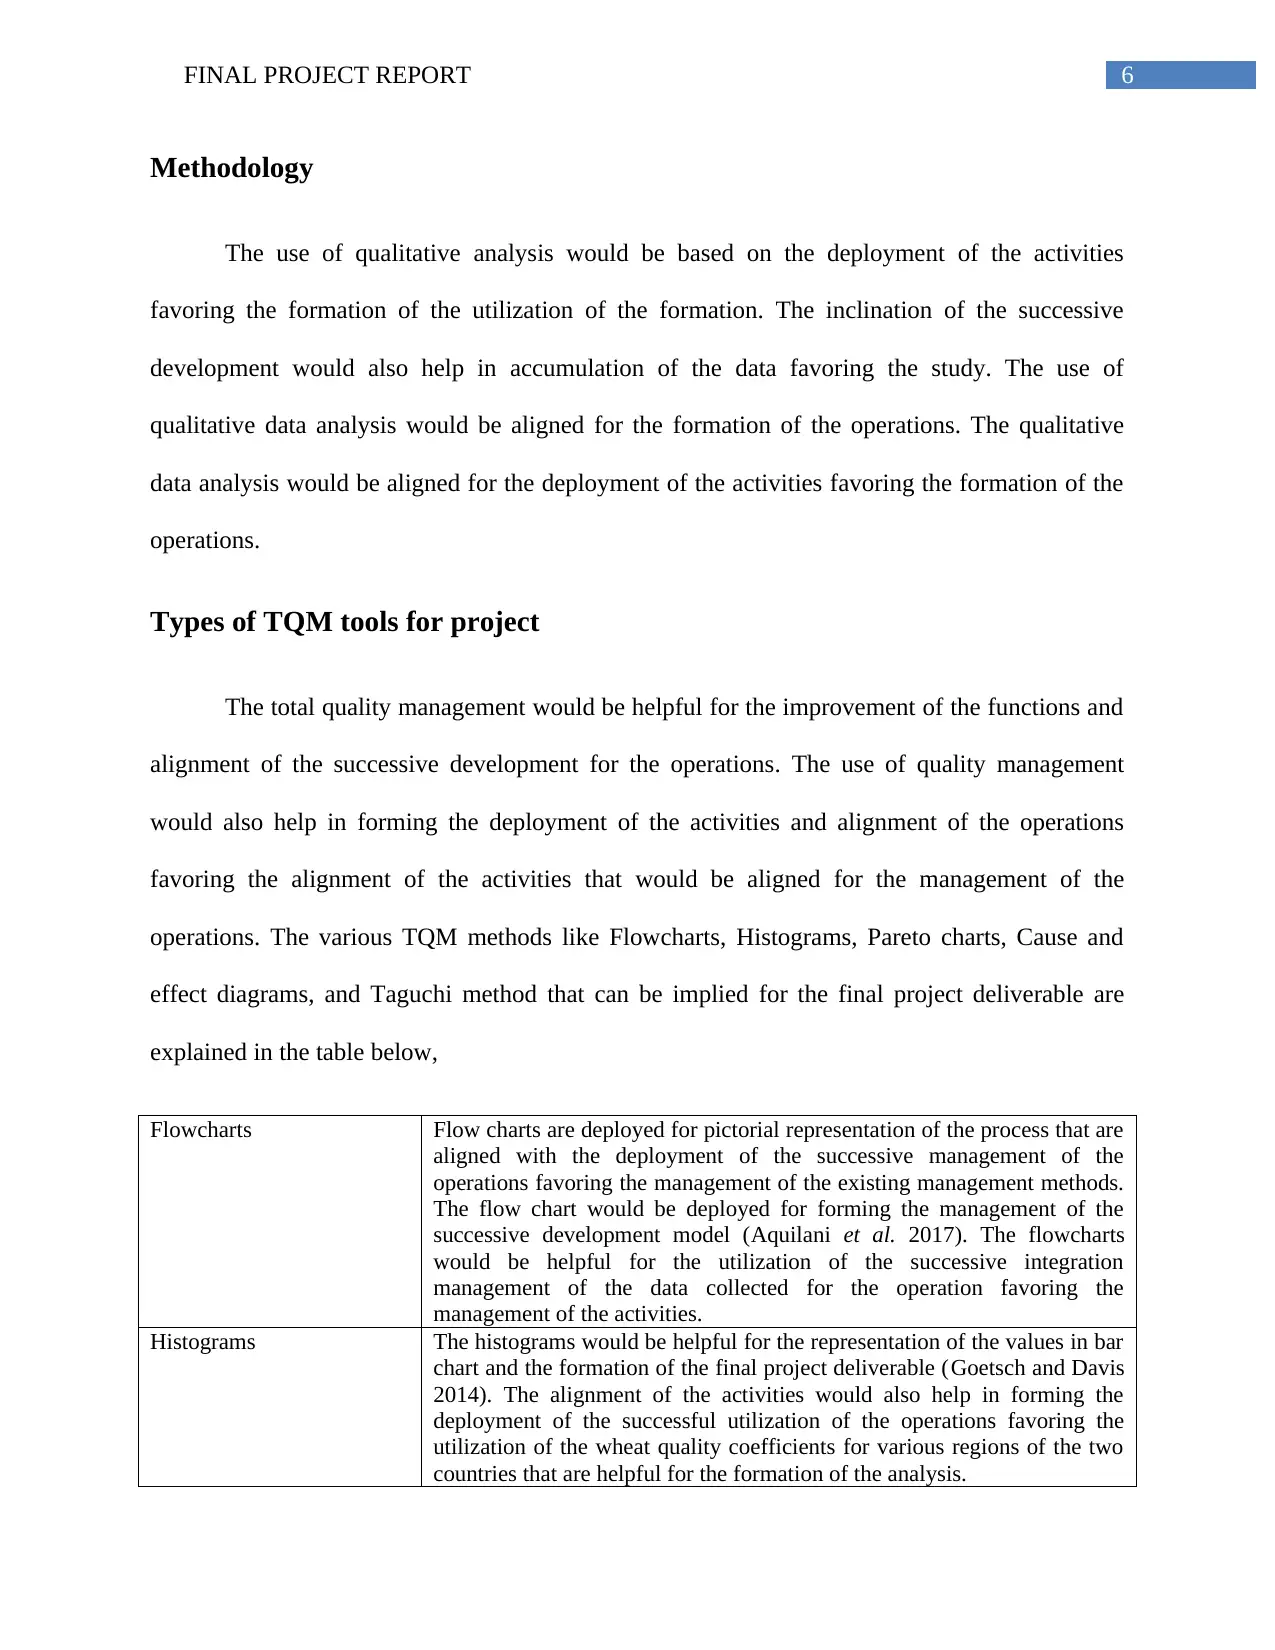
Types of TQM tools for project
The total quality management would be helpful for the improvement of the functions and
alignment of the successive development for the operations. The use of quality management
would also help in forming the deployment of the activities and alignment of the operations
favoring the alignment of the activities that would be aligned for the management of the
operations. The various TQM methods like Flowcharts, Histograms, Pareto charts, Cause and
effect diagrams, and Taguchi method that can be implied for the final project deliverable are
explained in the table below,
Flowcharts Flow charts are deployed for pictorial representation of the process that are
aligned with the deployment of the successive management of the
operations favoring the management of the existing management methods.
The flow chart would be deployed for forming the management of the
successive development model (Aquilani et al. 2017). The flowcharts
would be helpful for the utilization of the successive integration
management of the data collected for the operation favoring the
management of the activities.
Histograms The histograms would be helpful for the representation of the values in bar
chart and the formation of the final project deliverable (Goetsch and Davis
2014). The alignment of the activities would also help in forming the
deployment of the successful utilization of the operations favoring the
utilization of the wheat quality coefficients for various regions of the two
countries that are helpful for the formation of the analysis.
Methodology
The use of qualitative analysis would be based on the deployment of the activities
favoring the formation of the utilization of the formation. The inclination of the successive
development would also help in accumulation of the data favoring the study. The use of
qualitative data analysis would be aligned for the formation of the operations. The qualitative
data analysis would be aligned for the deployment of the activities favoring the formation of the
operations.
Types of TQM tools for project
The total quality management would be helpful for the improvement of the functions and
alignment of the successive development for the operations. The use of quality management
would also help in forming the deployment of the activities and alignment of the operations
favoring the alignment of the activities that would be aligned for the management of the
operations. The various TQM methods like Flowcharts, Histograms, Pareto charts, Cause and
effect diagrams, and Taguchi method that can be implied for the final project deliverable are
explained in the table below,
Flowcharts Flow charts are deployed for pictorial representation of the process that are
aligned with the deployment of the successive management of the
operations favoring the management of the existing management methods.
The flow chart would be deployed for forming the management of the
successive development model (Aquilani et al. 2017). The flowcharts
would be helpful for the utilization of the successive integration
management of the data collected for the operation favoring the
management of the activities.
Histograms The histograms would be helpful for the representation of the values in bar
chart and the formation of the final project deliverable (Goetsch and Davis
2014). The alignment of the activities would also help in forming the
deployment of the successful utilization of the operations favoring the
utilization of the wheat quality coefficients for various regions of the two
countries that are helpful for the formation of the analysis.
Paraphrase This Document
Need a fresh take? Get an instant paraphrase of this document with our AI Paraphraser
7FINAL PROJECT REPORT
Pareto Chart Pareto chart is developed considering the utilization of the data value and it
would also help in forming the analysis of the frequency data favorable for
the alignment of the improved operations. The Pareto chart would be
helpful for the formation of the improved functional development
(Oakland 2014). The bars of the chart would represent the frequency of the
values of wheat quality and the alignment of the successive deployment of
the analysis.
Cause and effect diagram The cause and effect diagram is formed for the alignment of the successive
development of the operations (Sallis 2014). The cause and effect diagram
is also known as fishbone diagram and it would provide the analysis of all
the factors of the causes impacting the project development. The fishbone
diagram would provide an analysis of the data collected for the utilization
of the data analysis.
Taguchi Method Taguchi Method is helpful for considering the statistical values of the data
and it would also help in forming the utilization of the data collected for
the project of comparing the wheat quality grown in Australia and India
and forming proper development of the activities.
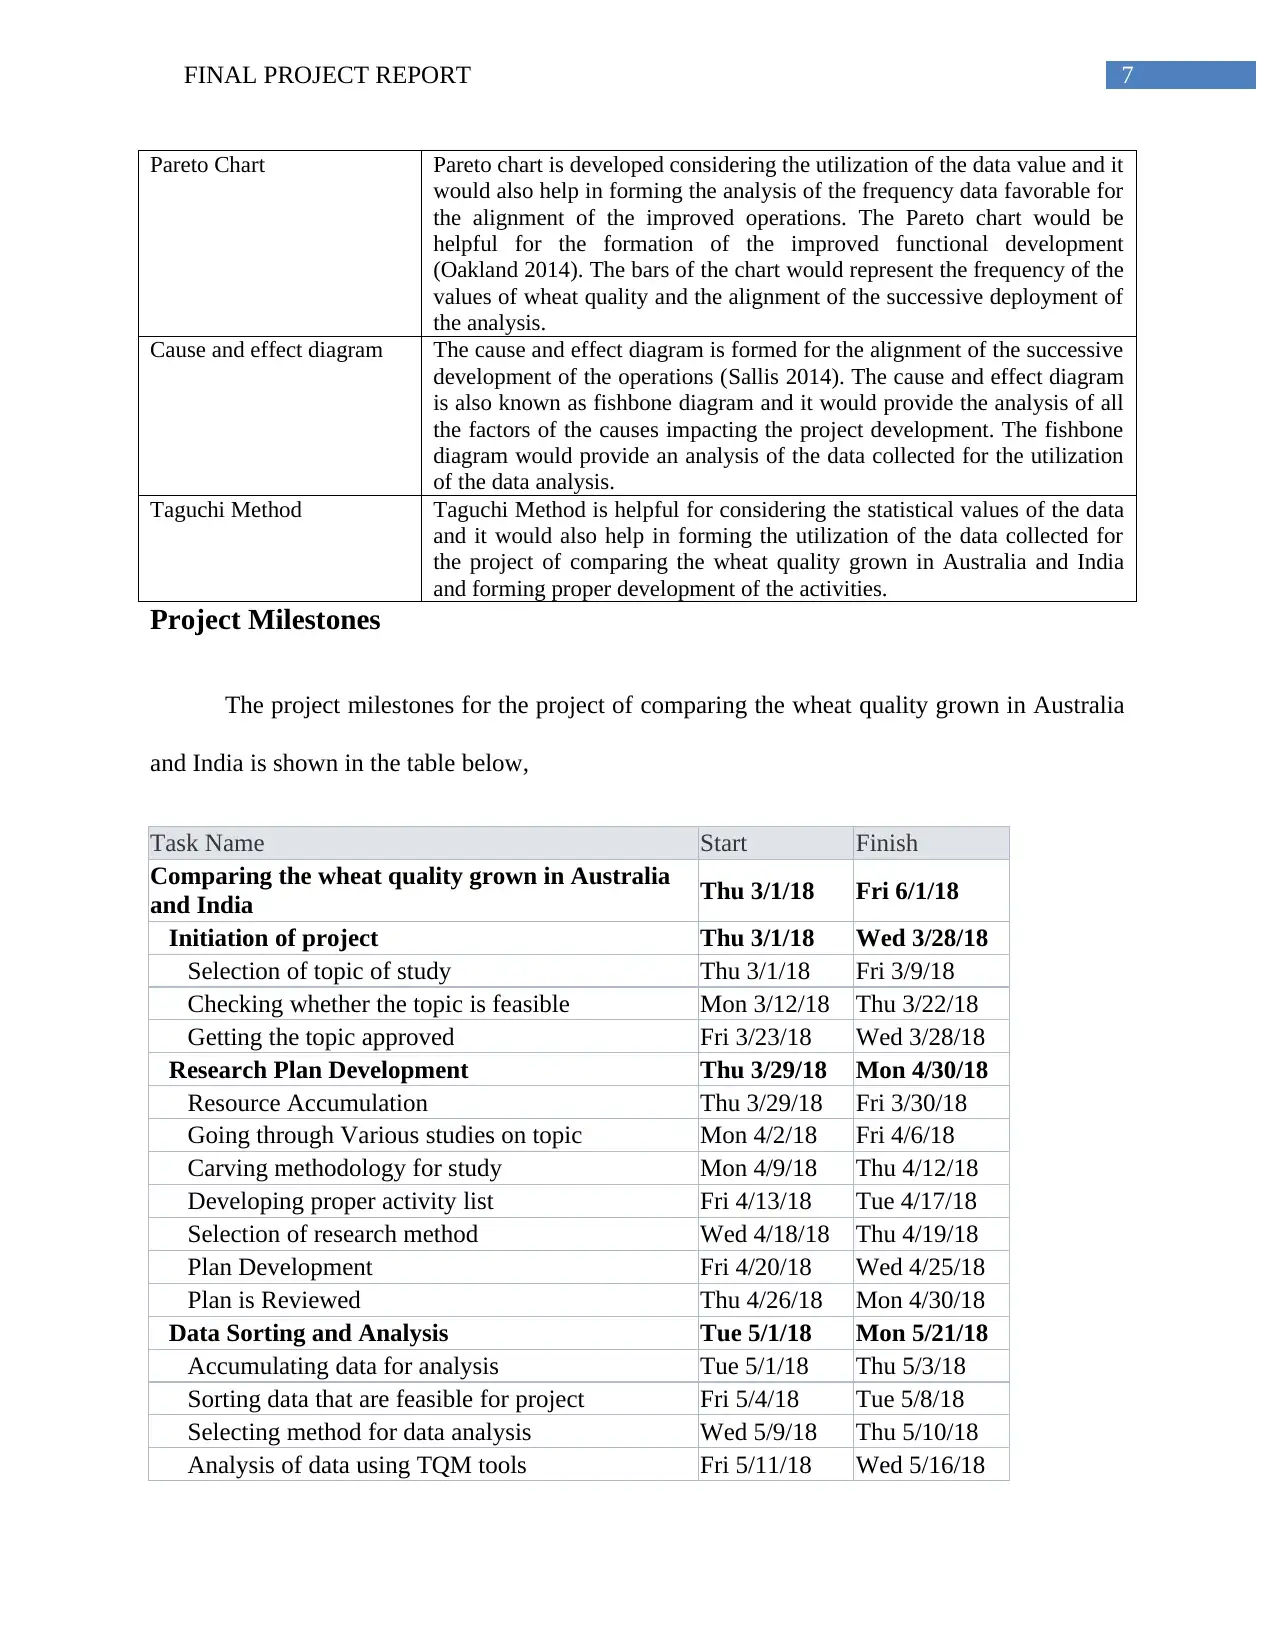
Project Milestones
The project milestones for the project of comparing the wheat quality grown in Australia
and India is shown in the table below,
Task Name Start Finish
Comparing the wheat quality grown in Australia
and India Thu 3/1/18 Fri 6/1/18
Initiation of project Thu 3/1/18 Wed 3/28/18
Selection of topic of study Thu 3/1/18 Fri 3/9/18
Checking whether the topic is feasible Mon 3/12/18 Thu 3/22/18
Getting the topic approved Fri 3/23/18 Wed 3/28/18
Research Plan Development Thu 3/29/18 Mon 4/30/18
Resource Accumulation Thu 3/29/18 Fri 3/30/18
Going through Various studies on topic Mon 4/2/18 Fri 4/6/18
Carving methodology for study Mon 4/9/18 Thu 4/12/18
Developing proper activity list Fri 4/13/18 Tue 4/17/18
Selection of research method Wed 4/18/18 Thu 4/19/18
Plan Development Fri 4/20/18 Wed 4/25/18
Plan is Reviewed Thu 4/26/18 Mon 4/30/18
Data Sorting and Analysis Tue 5/1/18 Mon 5/21/18
Accumulating data for analysis Tue 5/1/18 Thu 5/3/18
Sorting data that are feasible for project Fri 5/4/18 Tue 5/8/18
Selecting method for data analysis Wed 5/9/18 Thu 5/10/18
Analysis of data using TQM tools Fri 5/11/18 Wed 5/16/18
Pareto Chart Pareto chart is developed considering the utilization of the data value and it
would also help in forming the analysis of the frequency data favorable for
the alignment of the improved operations. The Pareto chart would be
helpful for the formation of the improved functional development
(Oakland 2014). The bars of the chart would represent the frequency of the
values of wheat quality and the alignment of the successive deployment of
the analysis.
Cause and effect diagram The cause and effect diagram is formed for the alignment of the successive
development of the operations (Sallis 2014). The cause and effect diagram
is also known as fishbone diagram and it would provide the analysis of all
the factors of the causes impacting the project development. The fishbone
diagram would provide an analysis of the data collected for the utilization
of the data analysis.
Taguchi Method Taguchi Method is helpful for considering the statistical values of the data
and it would also help in forming the utilization of the data collected for
the project of comparing the wheat quality grown in Australia and India
and forming proper development of the activities.
Project Milestones
The project milestones for the project of comparing the wheat quality grown in Australia
and India is shown in the table below,
Task Name Start Finish
Comparing the wheat quality grown in Australia
and India Thu 3/1/18 Fri 6/1/18
Initiation of project Thu 3/1/18 Wed 3/28/18
Selection of topic of study Thu 3/1/18 Fri 3/9/18
Checking whether the topic is feasible Mon 3/12/18 Thu 3/22/18
Getting the topic approved Fri 3/23/18 Wed 3/28/18
Research Plan Development Thu 3/29/18 Mon 4/30/18
Resource Accumulation Thu 3/29/18 Fri 3/30/18
Going through Various studies on topic Mon 4/2/18 Fri 4/6/18
Carving methodology for study Mon 4/9/18 Thu 4/12/18
Developing proper activity list Fri 4/13/18 Tue 4/17/18
Selection of research method Wed 4/18/18 Thu 4/19/18
Plan Development Fri 4/20/18 Wed 4/25/18
Plan is Reviewed Thu 4/26/18 Mon 4/30/18
Data Sorting and Analysis Tue 5/1/18 Mon 5/21/18
Accumulating data for analysis Tue 5/1/18 Thu 5/3/18
Sorting data that are feasible for project Fri 5/4/18 Tue 5/8/18
Selecting method for data analysis Wed 5/9/18 Thu 5/10/18
Analysis of data using TQM tools Fri 5/11/18 Wed 5/16/18
8FINAL PROJECT REPORT
Developing final data analysis outcome Thu 5/17/18 Mon 5/21/18
Report Documentation Tue 5/22/18 Fri 6/1/18
Development of final reports Tue 5/22/18 Wed 5/23/18
Summary of the analysis Thu 5/24/18 Fri 5/25/18
Developing Conclusion of the study Mon 5/28/18 Wed 5/30/18
Project Report is submitted Thu 5/31/18 Thu 5/31/18
Project is Closed Fri 6/1/18 Fri 6/1/18
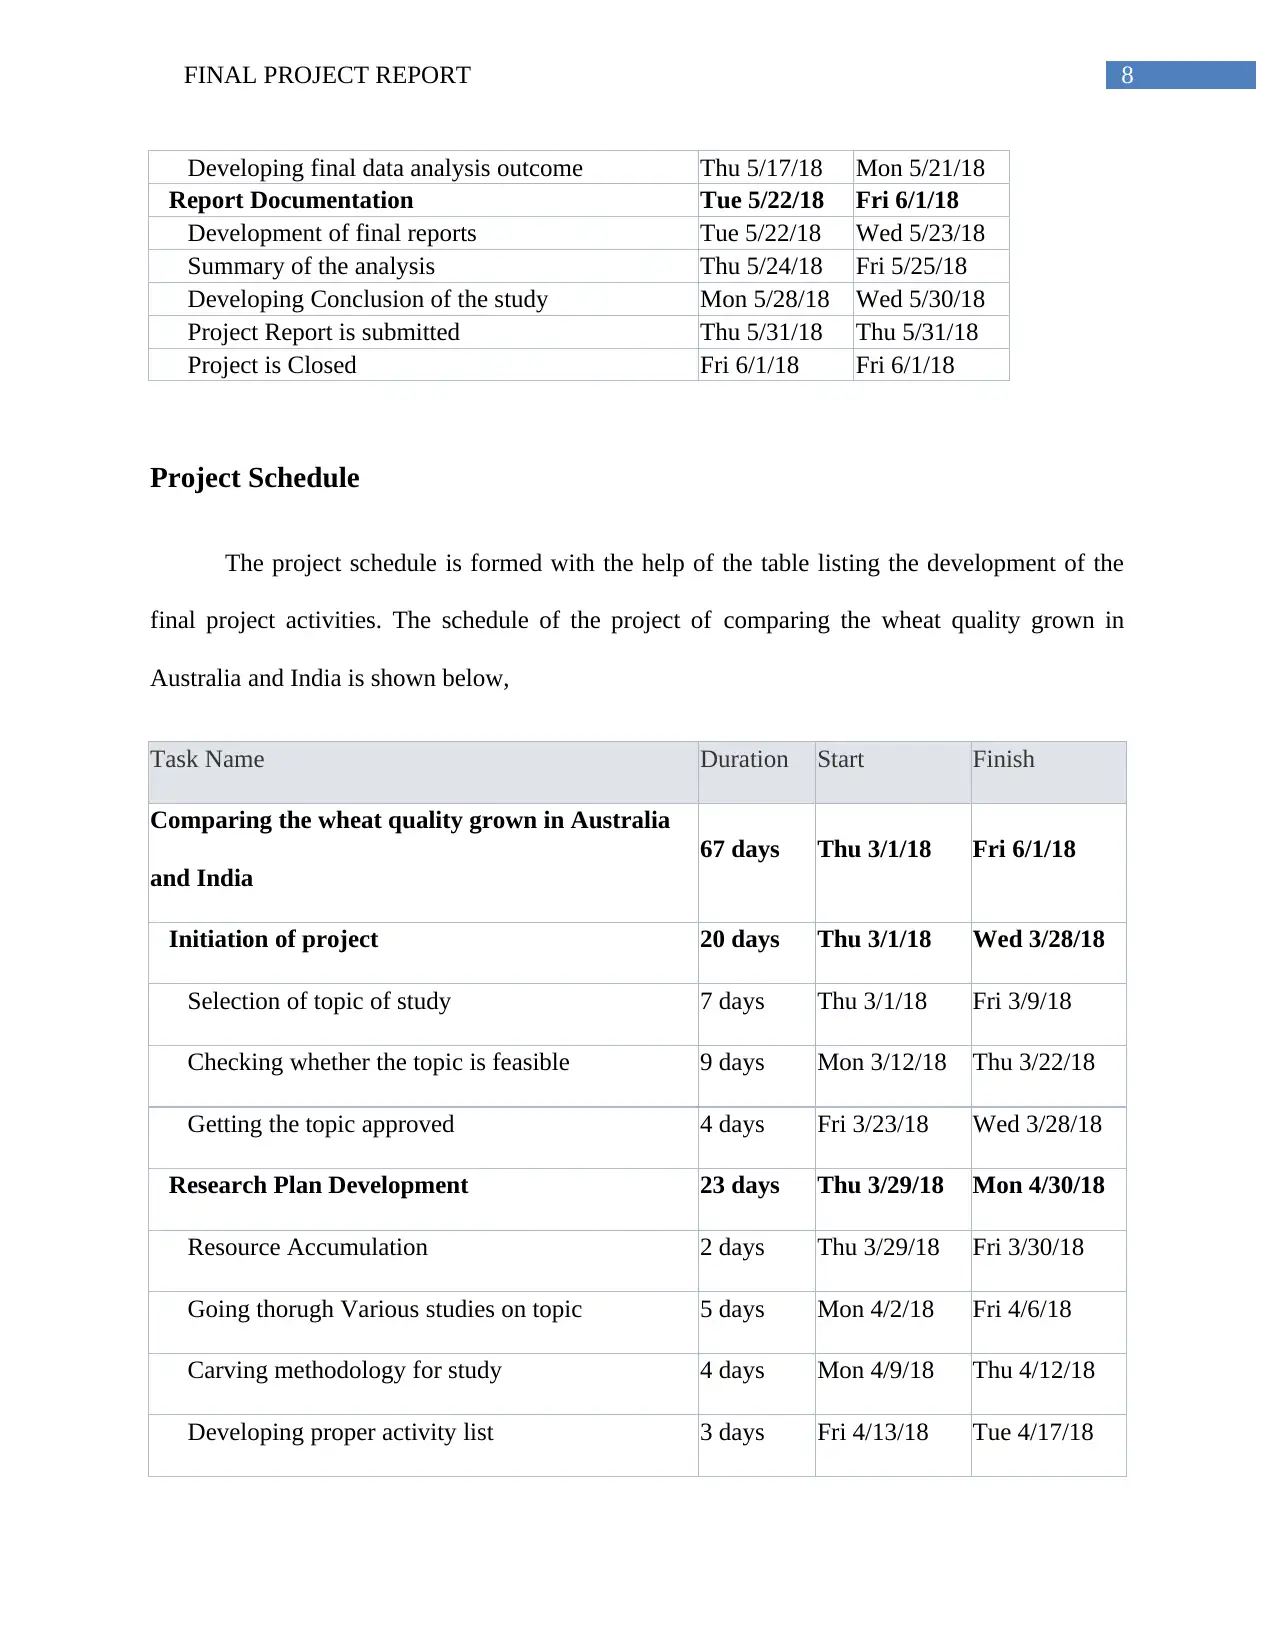
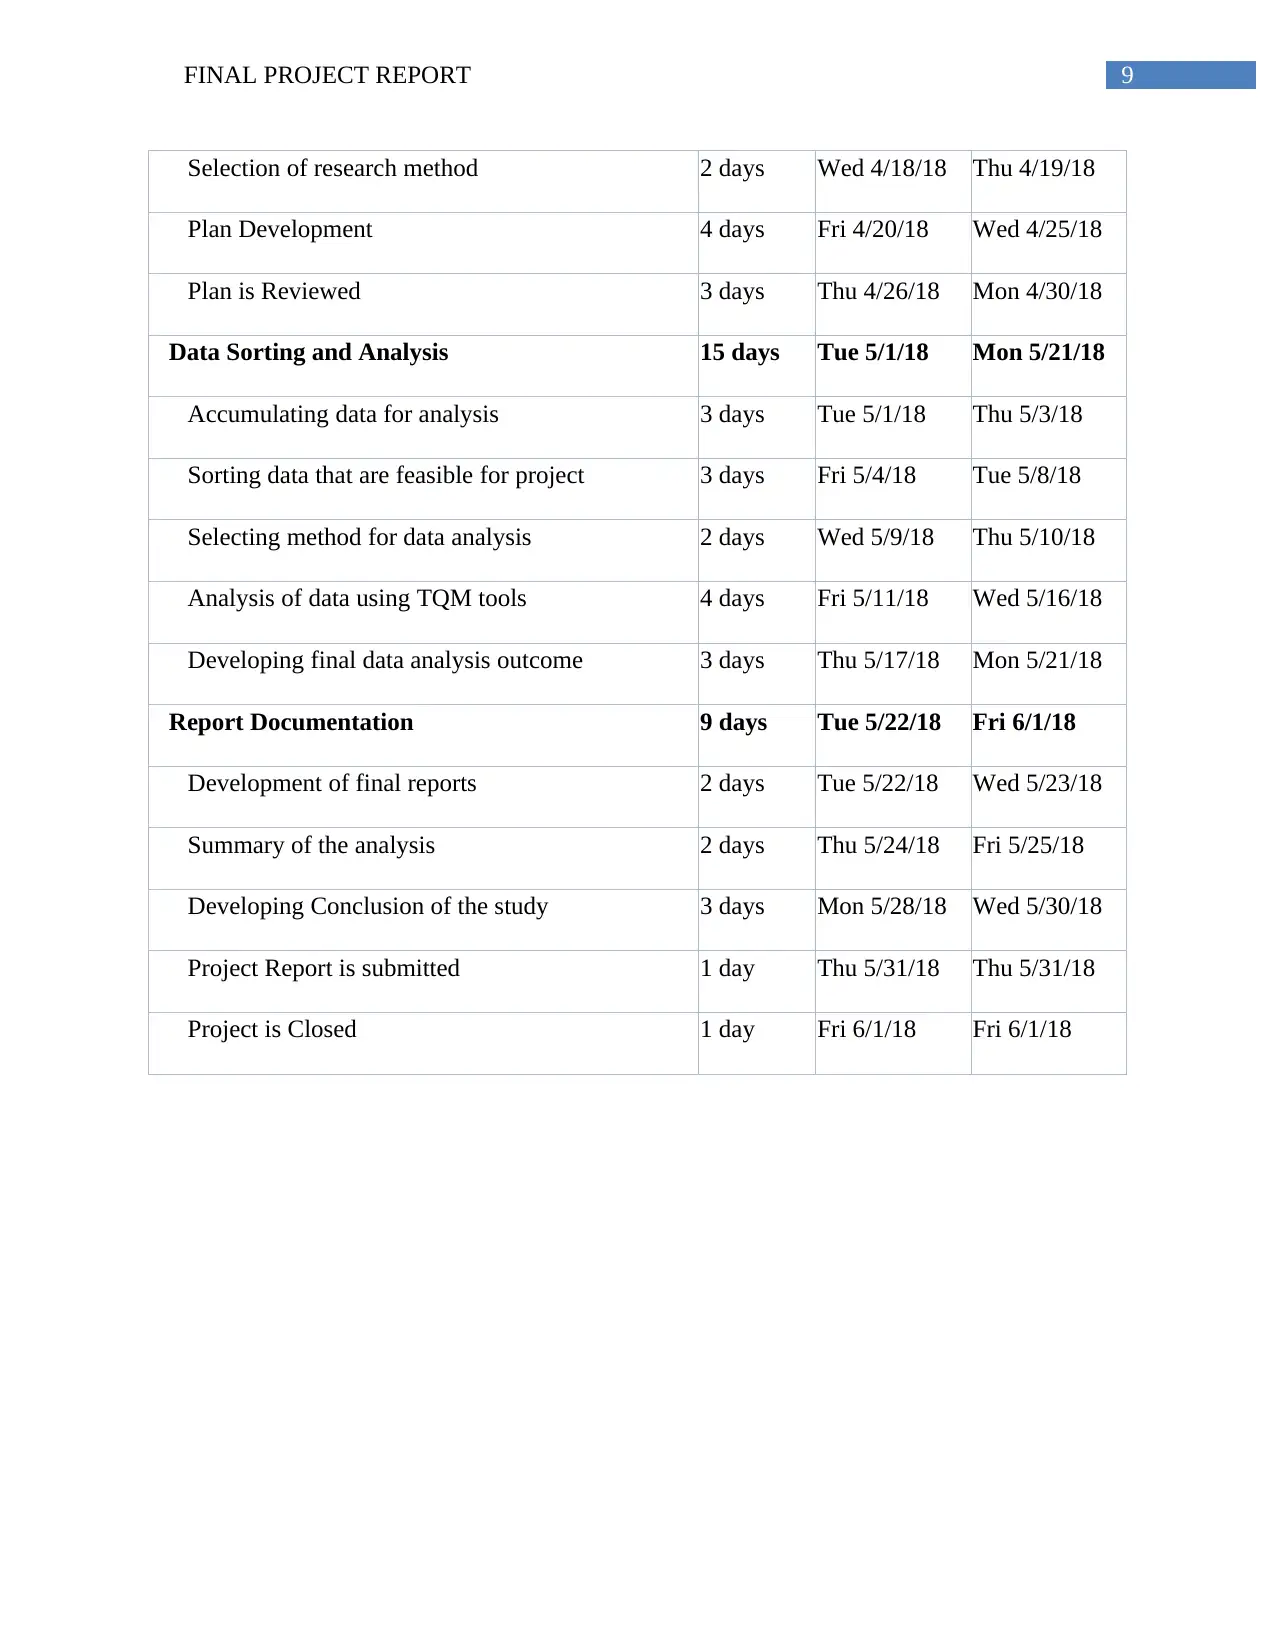
Project Schedule
The project schedule is formed with the help of the table listing the development of the
final project activities. The schedule of the project of comparing the wheat quality grown in
Australia and India is shown below,
Task Name Duration Start Finish
Comparing the wheat quality grown in Australia
and India
67 days Thu 3/1/18 Fri 6/1/18
Initiation of project 20 days Thu 3/1/18 Wed 3/28/18
Selection of topic of study 7 days Thu 3/1/18 Fri 3/9/18
Checking whether the topic is feasible 9 days Mon 3/12/18 Thu 3/22/18
Getting the topic approved 4 days Fri 3/23/18 Wed 3/28/18
Research Plan Development 23 days Thu 3/29/18 Mon 4/30/18
Resource Accumulation 2 days Thu 3/29/18 Fri 3/30/18
Going thorugh Various studies on topic 5 days Mon 4/2/18 Fri 4/6/18
Carving methodology for study 4 days Mon 4/9/18 Thu 4/12/18
Developing proper activity list 3 days Fri 4/13/18 Tue 4/17/18
Developing final data analysis outcome Thu 5/17/18 Mon 5/21/18
Report Documentation Tue 5/22/18 Fri 6/1/18
Development of final reports Tue 5/22/18 Wed 5/23/18
Summary of the analysis Thu 5/24/18 Fri 5/25/18
Developing Conclusion of the study Mon 5/28/18 Wed 5/30/18
Project Report is submitted Thu 5/31/18 Thu 5/31/18
Project is Closed Fri 6/1/18 Fri 6/1/18
Project Schedule
The project schedule is formed with the help of the table listing the development of the
final project activities. The schedule of the project of comparing the wheat quality grown in
Australia and India is shown below,
Task Name Duration Start Finish
Comparing the wheat quality grown in Australia
and India
67 days Thu 3/1/18 Fri 6/1/18
Initiation of project 20 days Thu 3/1/18 Wed 3/28/18
Selection of topic of study 7 days Thu 3/1/18 Fri 3/9/18
Checking whether the topic is feasible 9 days Mon 3/12/18 Thu 3/22/18
Getting the topic approved 4 days Fri 3/23/18 Wed 3/28/18
Research Plan Development 23 days Thu 3/29/18 Mon 4/30/18
Resource Accumulation 2 days Thu 3/29/18 Fri 3/30/18
Going thorugh Various studies on topic 5 days Mon 4/2/18 Fri 4/6/18
Carving methodology for study 4 days Mon 4/9/18 Thu 4/12/18
Developing proper activity list 3 days Fri 4/13/18 Tue 4/17/18
⊘ This is a preview!⊘
Do you want full access?
Subscribe today to unlock all pages.
Trusted by 1+ million students worldwide
9FINAL PROJECT REPORT
Selection of research method 2 days Wed 4/18/18 Thu 4/19/18
Plan Development 4 days Fri 4/20/18 Wed 4/25/18
Plan is Reviewed 3 days Thu 4/26/18 Mon 4/30/18
Data Sorting and Analysis 15 days Tue 5/1/18 Mon 5/21/18
Accumulating data for analysis 3 days Tue 5/1/18 Thu 5/3/18
Sorting data that are feasible for project 3 days Fri 5/4/18 Tue 5/8/18
Selecting method for data analysis 2 days Wed 5/9/18 Thu 5/10/18
Analysis of data using TQM tools 4 days Fri 5/11/18 Wed 5/16/18
Developing final data analysis outcome 3 days Thu 5/17/18 Mon 5/21/18
Report Documentation 9 days Tue 5/22/18 Fri 6/1/18
Development of final reports 2 days Tue 5/22/18 Wed 5/23/18
Summary of the analysis 2 days Thu 5/24/18 Fri 5/25/18
Developing Conclusion of the study 3 days Mon 5/28/18 Wed 5/30/18
Project Report is submitted 1 day Thu 5/31/18 Thu 5/31/18
Project is Closed 1 day Fri 6/1/18 Fri 6/1/18
Paraphrase This Document
Need a fresh take? Get an instant paraphrase of this document with our AI Paraphraser
10FINAL PROJECT REPORT
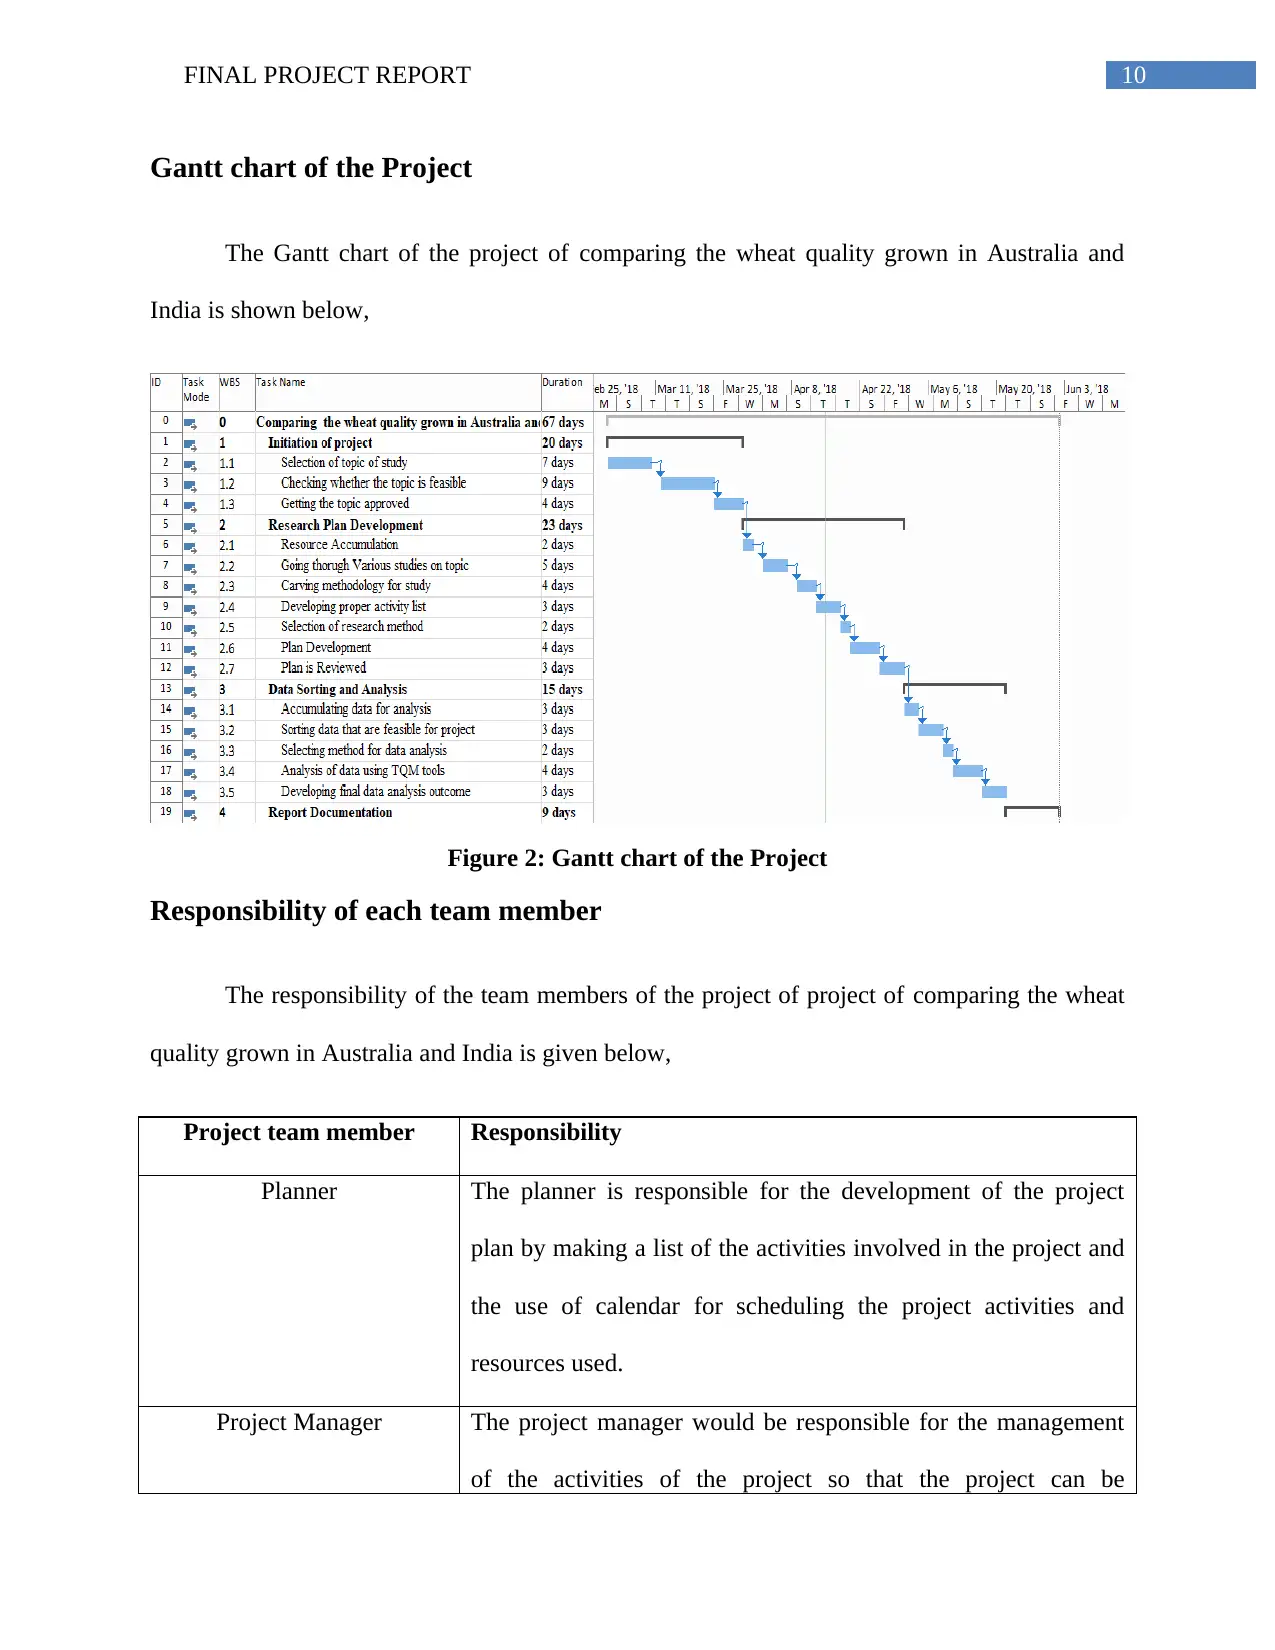
Gantt chart of the Project
The Gantt chart of the project of comparing the wheat quality grown in Australia and
India is shown below,
Figure 2: Gantt chart of the Project
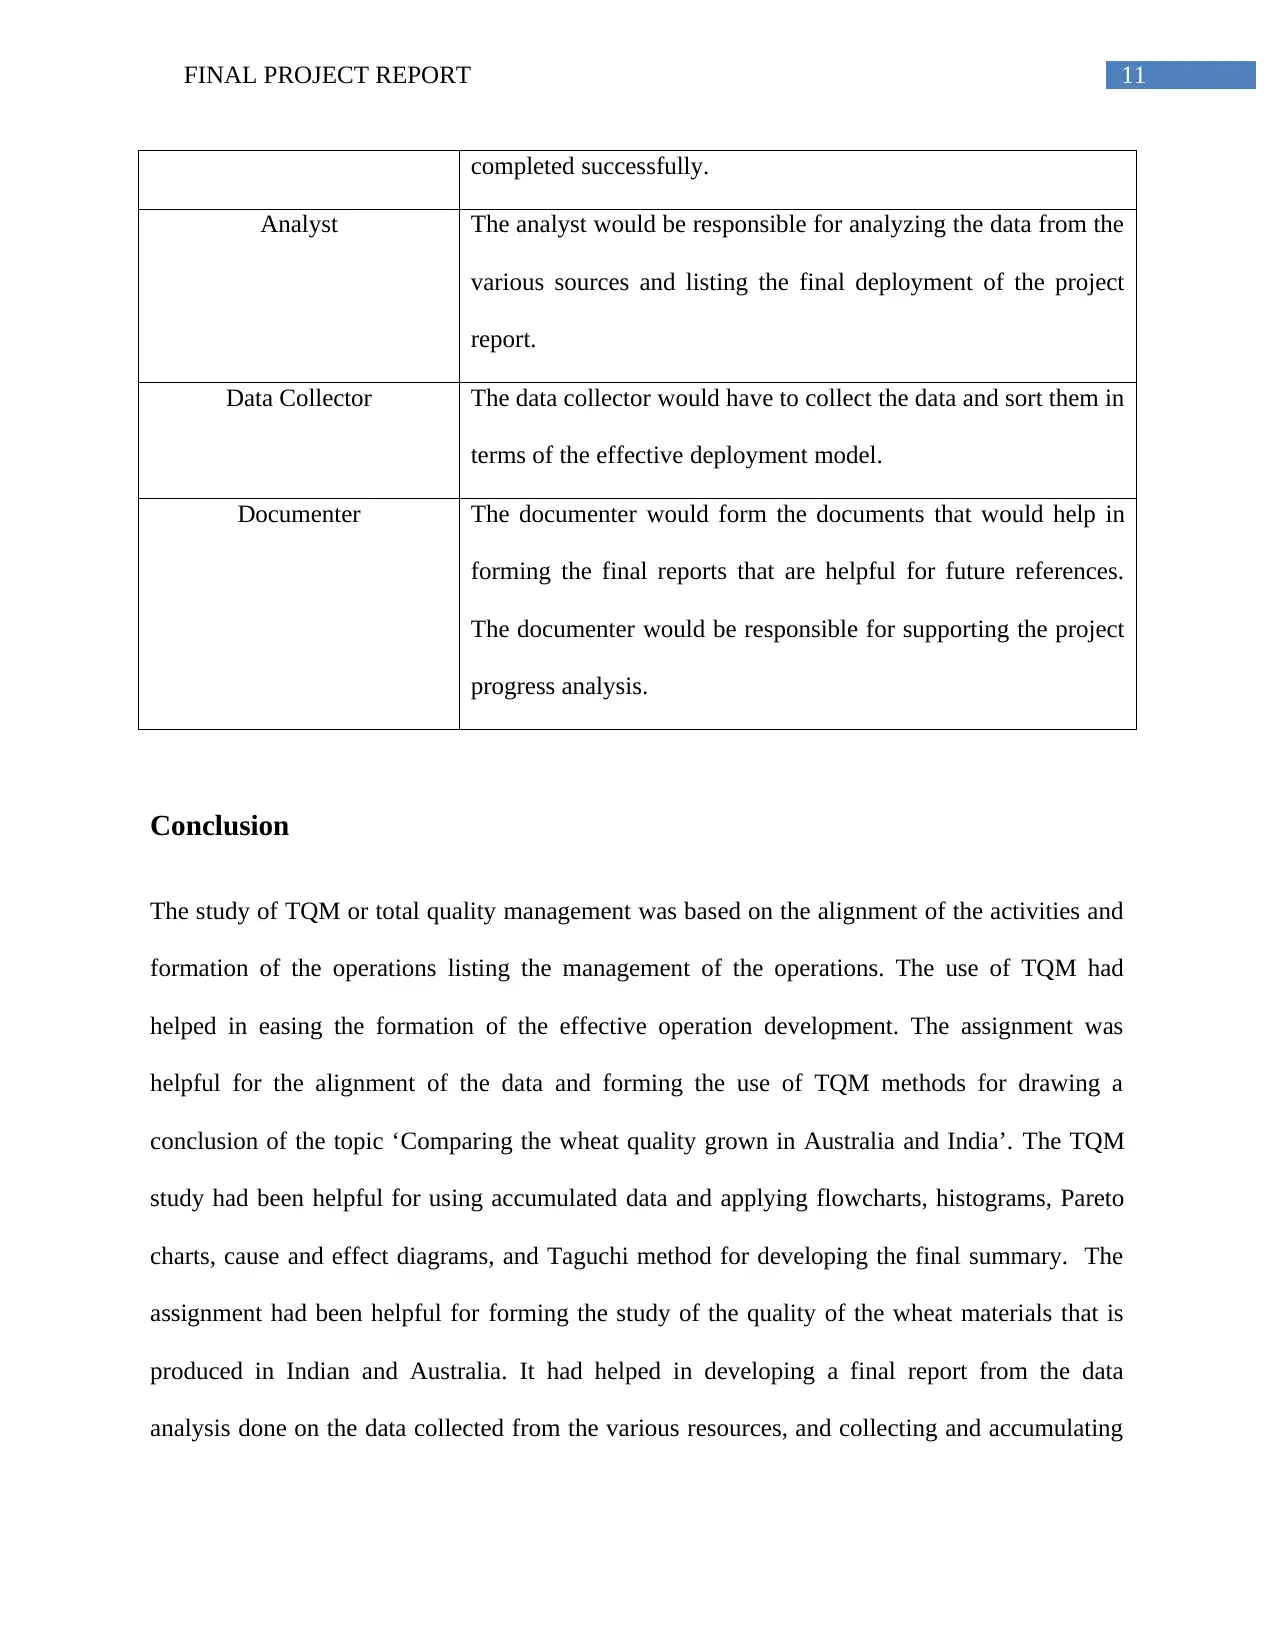
Responsibility of each team member
The responsibility of the team members of the project of project of comparing the wheat
quality grown in Australia and India is given below,
Project team member Responsibility
Planner The planner is responsible for the development of the project
plan by making a list of the activities involved in the project and
the use of calendar for scheduling the project activities and
resources used.
Project Manager The project manager would be responsible for the management
of the activities of the project so that the project can be
Gantt chart of the Project
The Gantt chart of the project of comparing the wheat quality grown in Australia and
India is shown below,
Figure 2: Gantt chart of the Project
Responsibility of each team member
The responsibility of the team members of the project of project of comparing the wheat
quality grown in Australia and India is given below,
Project team member Responsibility
Planner The planner is responsible for the development of the project
plan by making a list of the activities involved in the project and
the use of calendar for scheduling the project activities and
resources used.
Project Manager The project manager would be responsible for the management
of the activities of the project so that the project can be
11FINAL PROJECT REPORT
completed successfully.
Analyst The analyst would be responsible for analyzing the data from the
various sources and listing the final deployment of the project
report.
Data Collector The data collector would have to collect the data and sort them in
terms of the effective deployment model.
Documenter The documenter would form the documents that would help in
forming the final reports that are helpful for future references.
The documenter would be responsible for supporting the project
progress analysis.
Conclusion
The study of TQM or total quality management was based on the alignment of the activities and
formation of the operations listing the management of the operations. The use of TQM had
helped in easing the formation of the effective operation development. The assignment was
helpful for the alignment of the data and forming the use of TQM methods for drawing a
conclusion of the topic ‘Comparing the wheat quality grown in Australia and India’. The TQM
study had been helpful for using accumulated data and applying flowcharts, histograms, Pareto
charts, cause and effect diagrams, and Taguchi method for developing the final summary. The
assignment had been helpful for forming the study of the quality of the wheat materials that is
produced in Indian and Australia. It had helped in developing a final report from the data
analysis done on the data collected from the various resources, and collecting and accumulating
⊘ This is a preview!⊘
Do you want full access?
Subscribe today to unlock all pages.
Trusted by 1+ million students worldwide
1 out of 15
Your All-in-One AI-Powered Toolkit for Academic Success.
+13062052269
info@desklib.com
Available 24*7 on WhatsApp / Email
![[object Object]](/_next/static/media/star-bottom.7253800d.svg)
Unlock your academic potential
Copyright © 2020–2026 A2Z Services. All Rights Reserved. Developed and managed by ZUCOL.