Economics Assignment: Analyzing Macroeconomic Indicators in Australia
VerifiedAdded on 2021/05/31
|11
|1583
|23
Homework Assignment
AI Summary
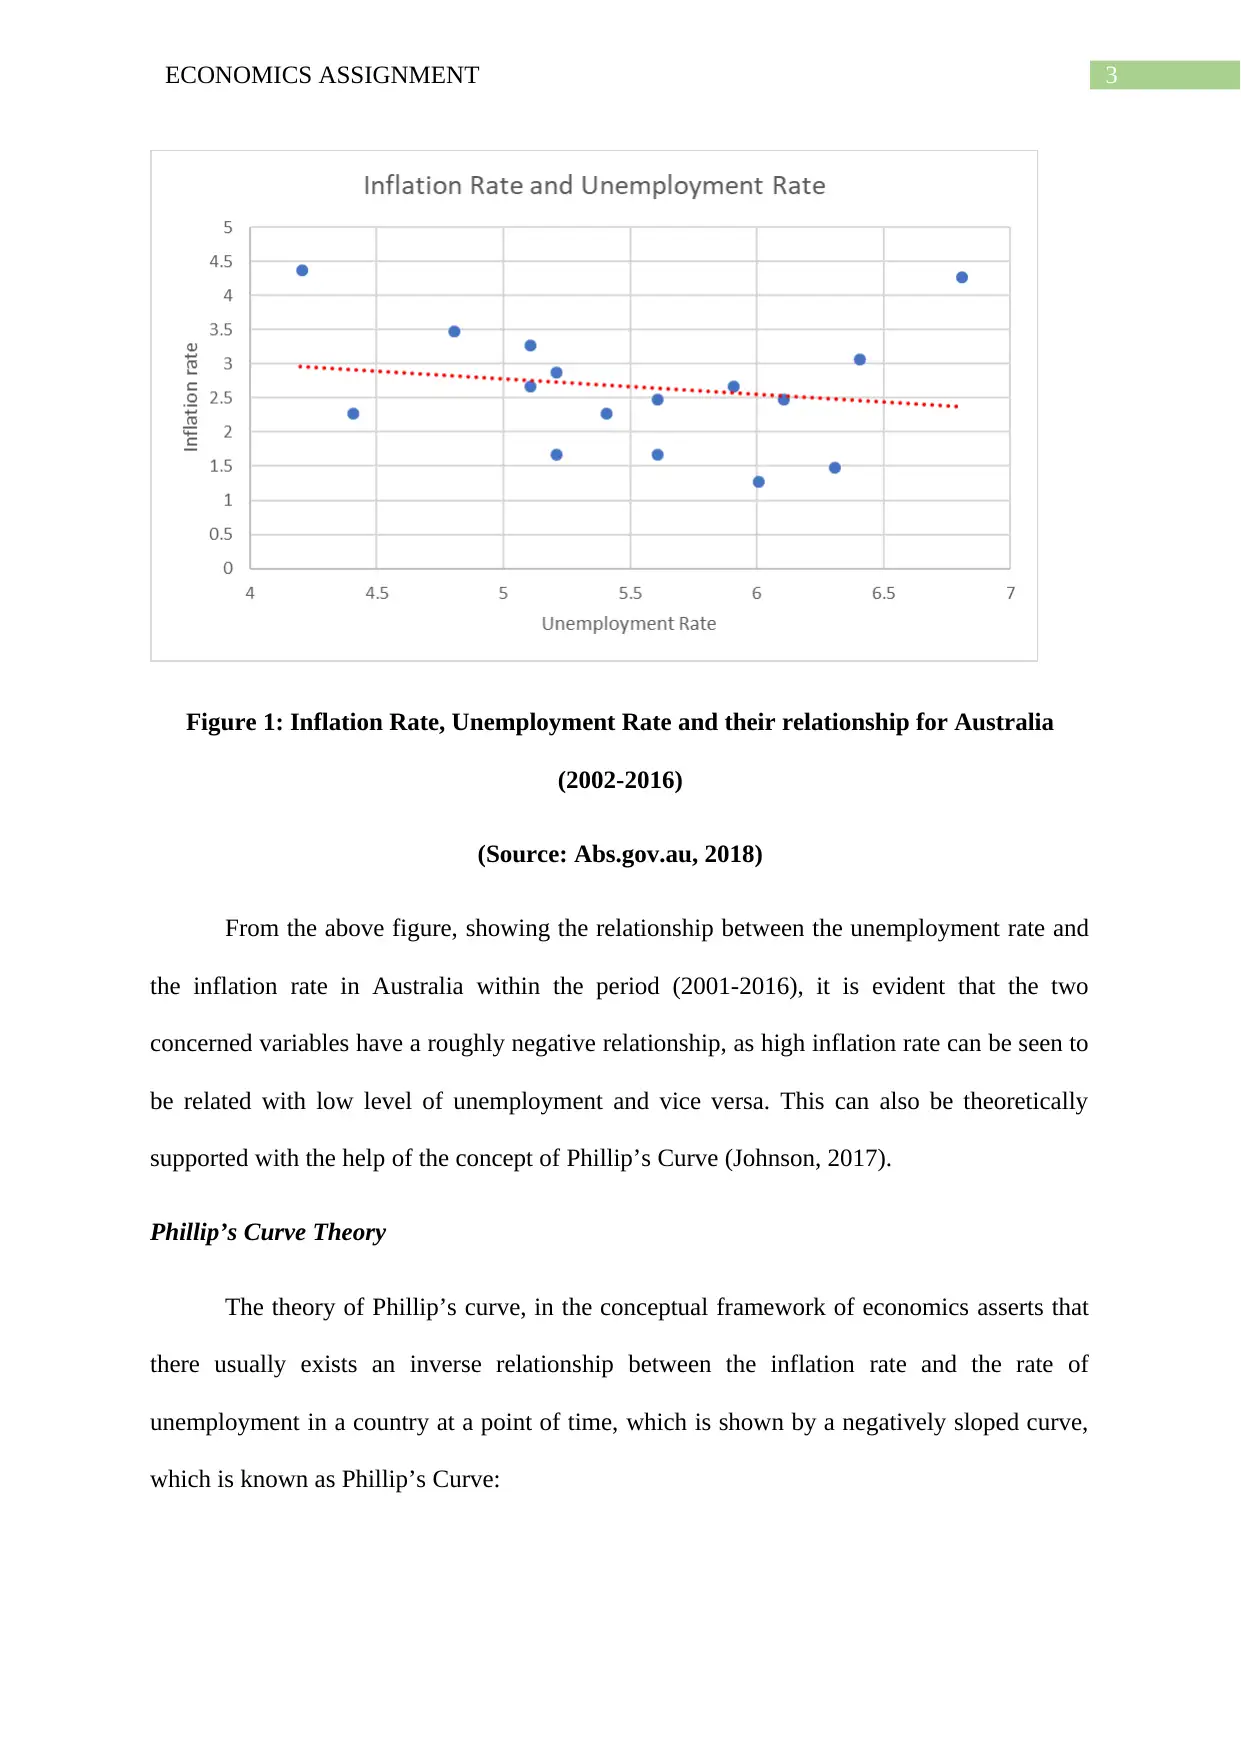
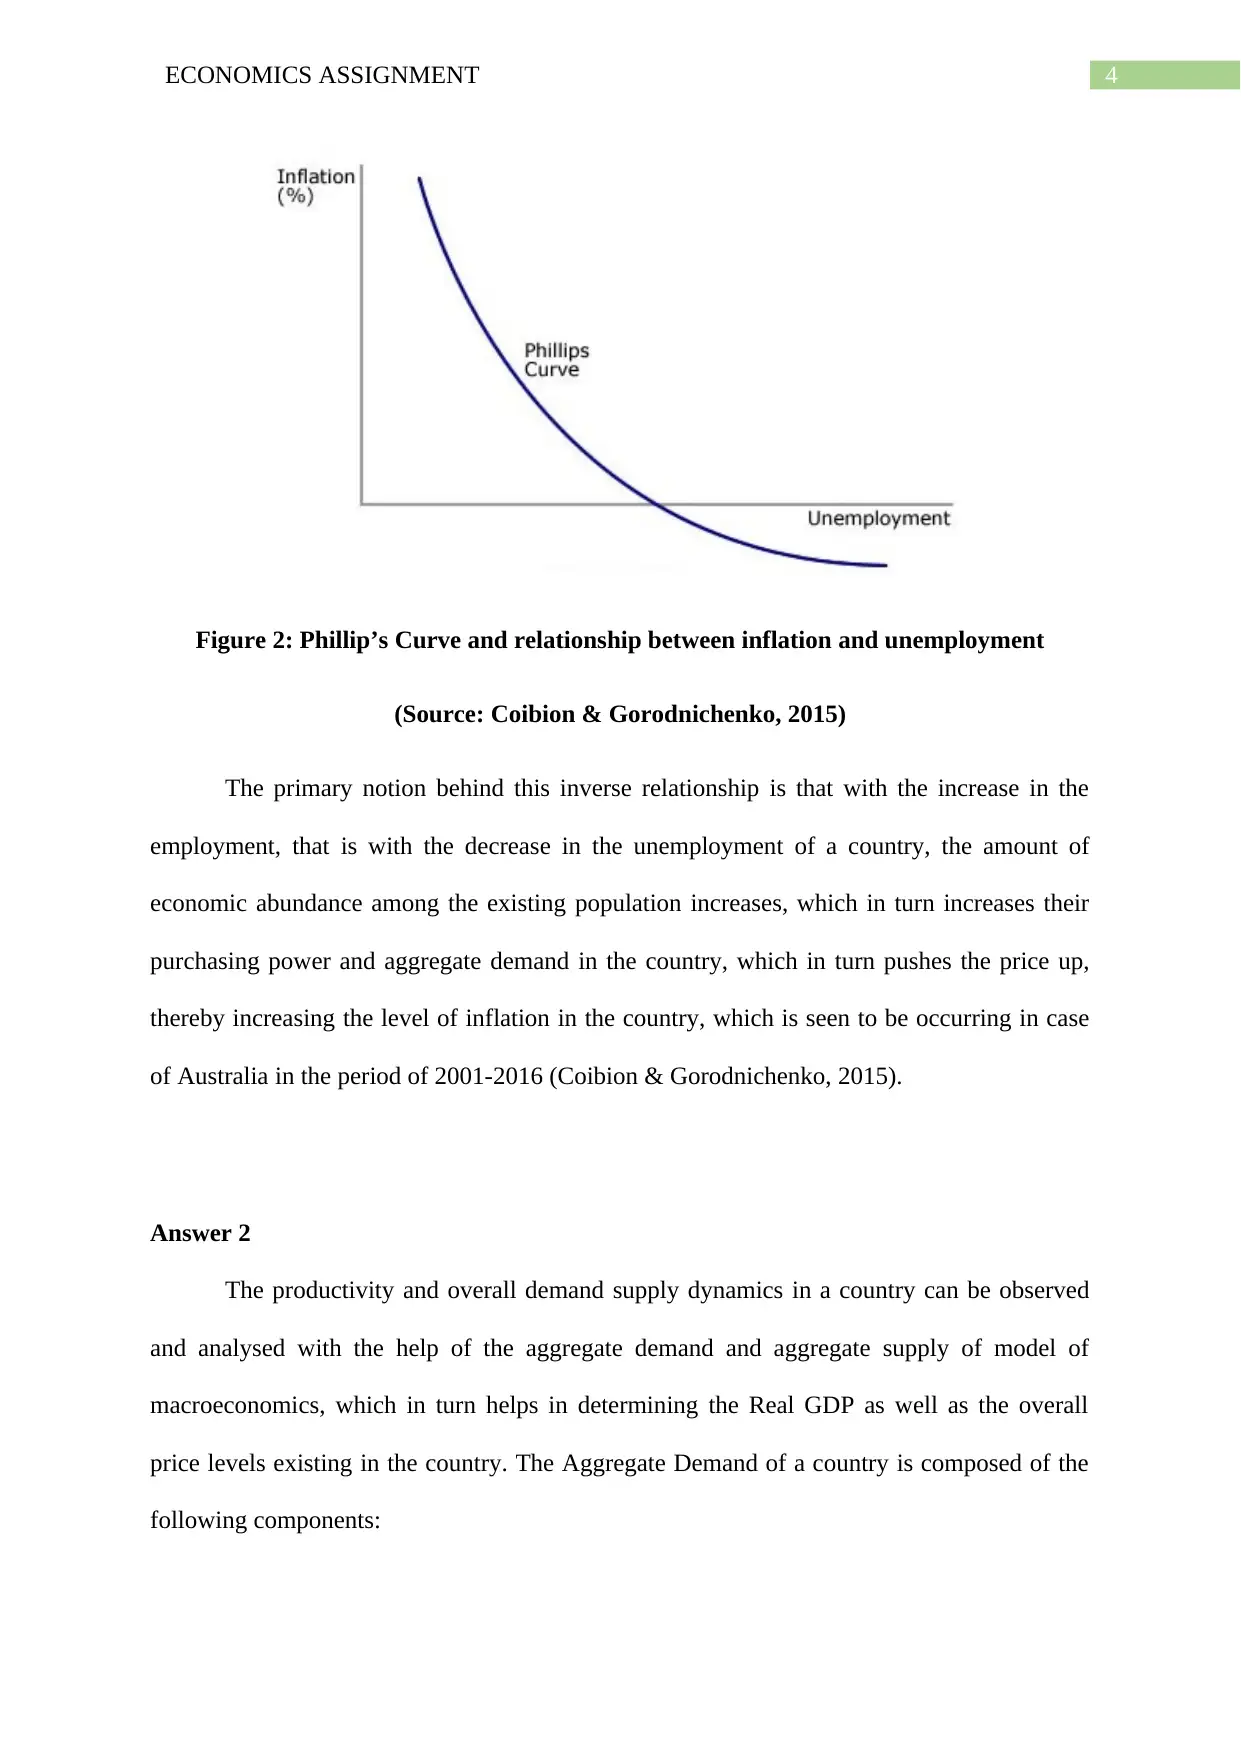
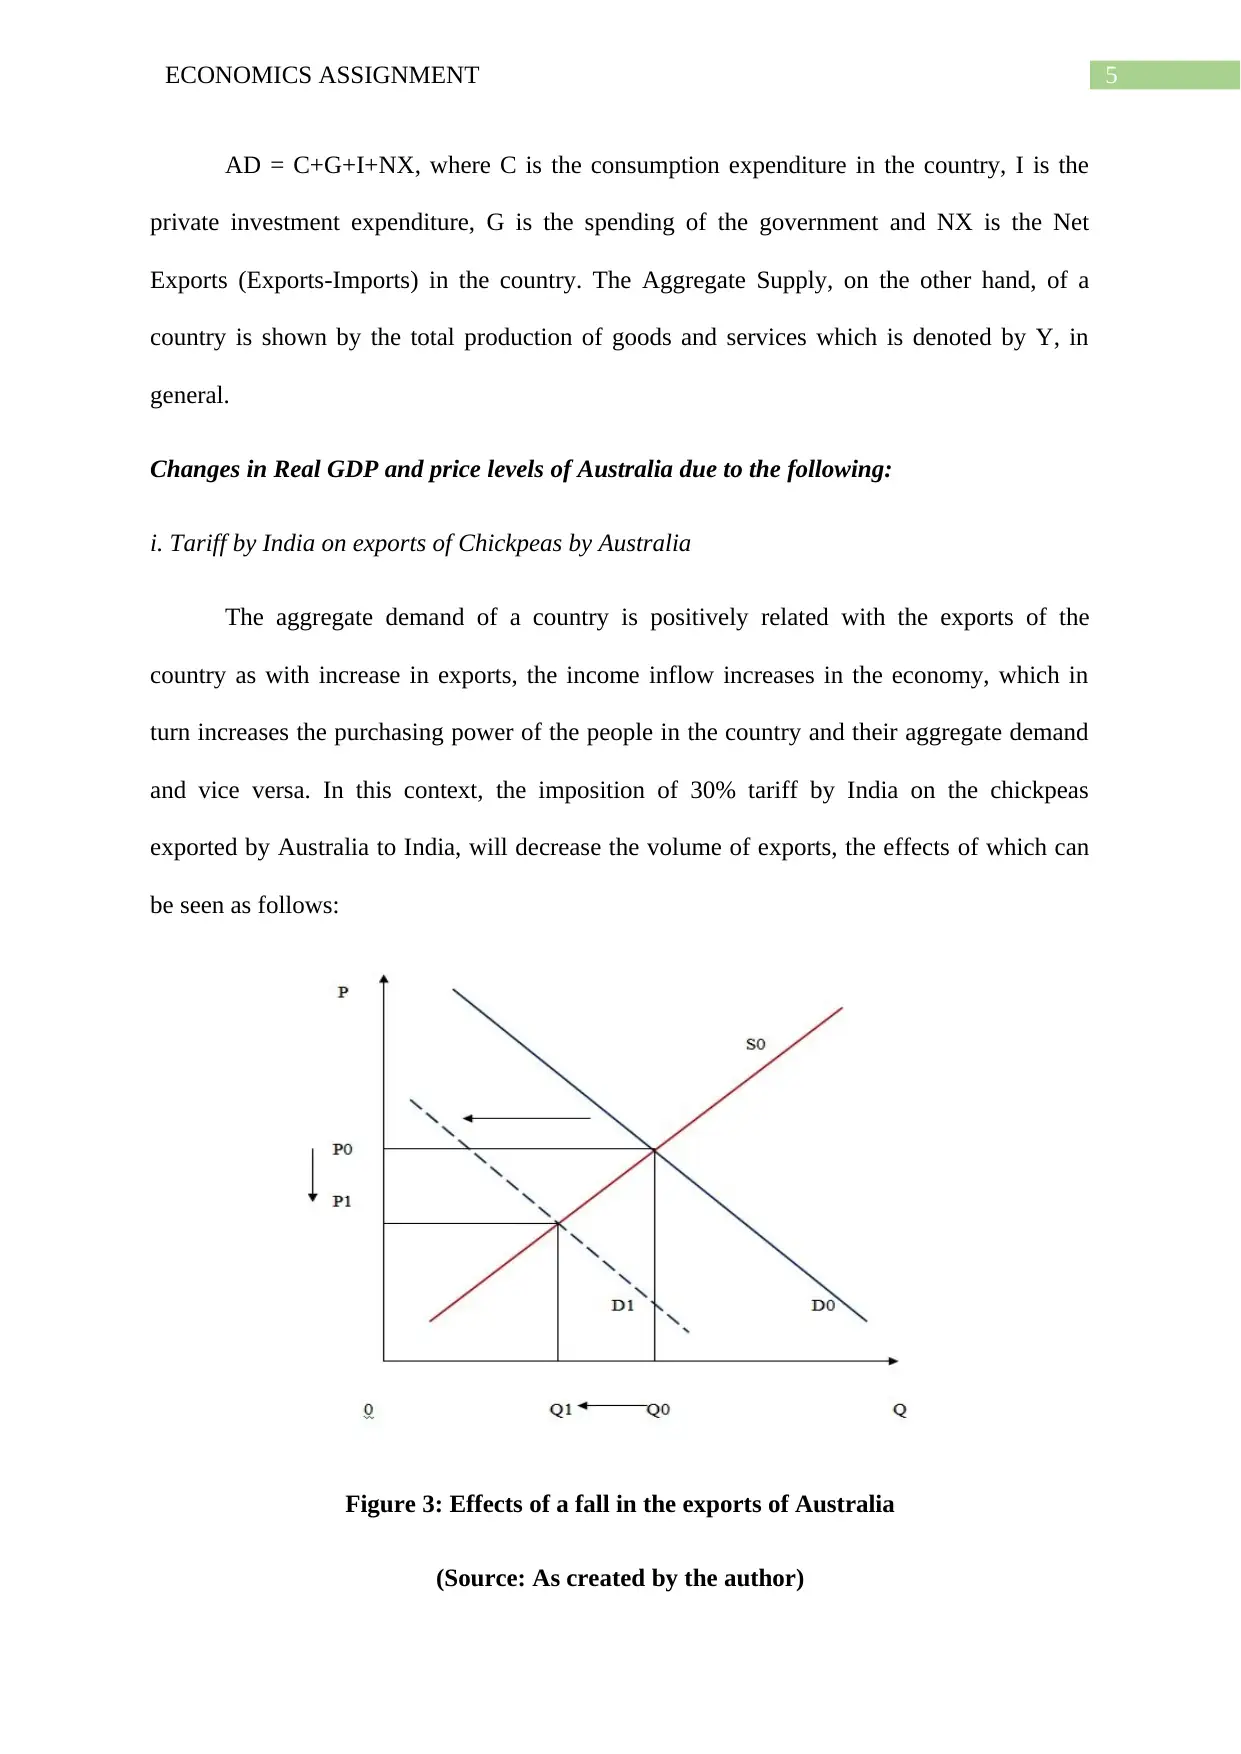
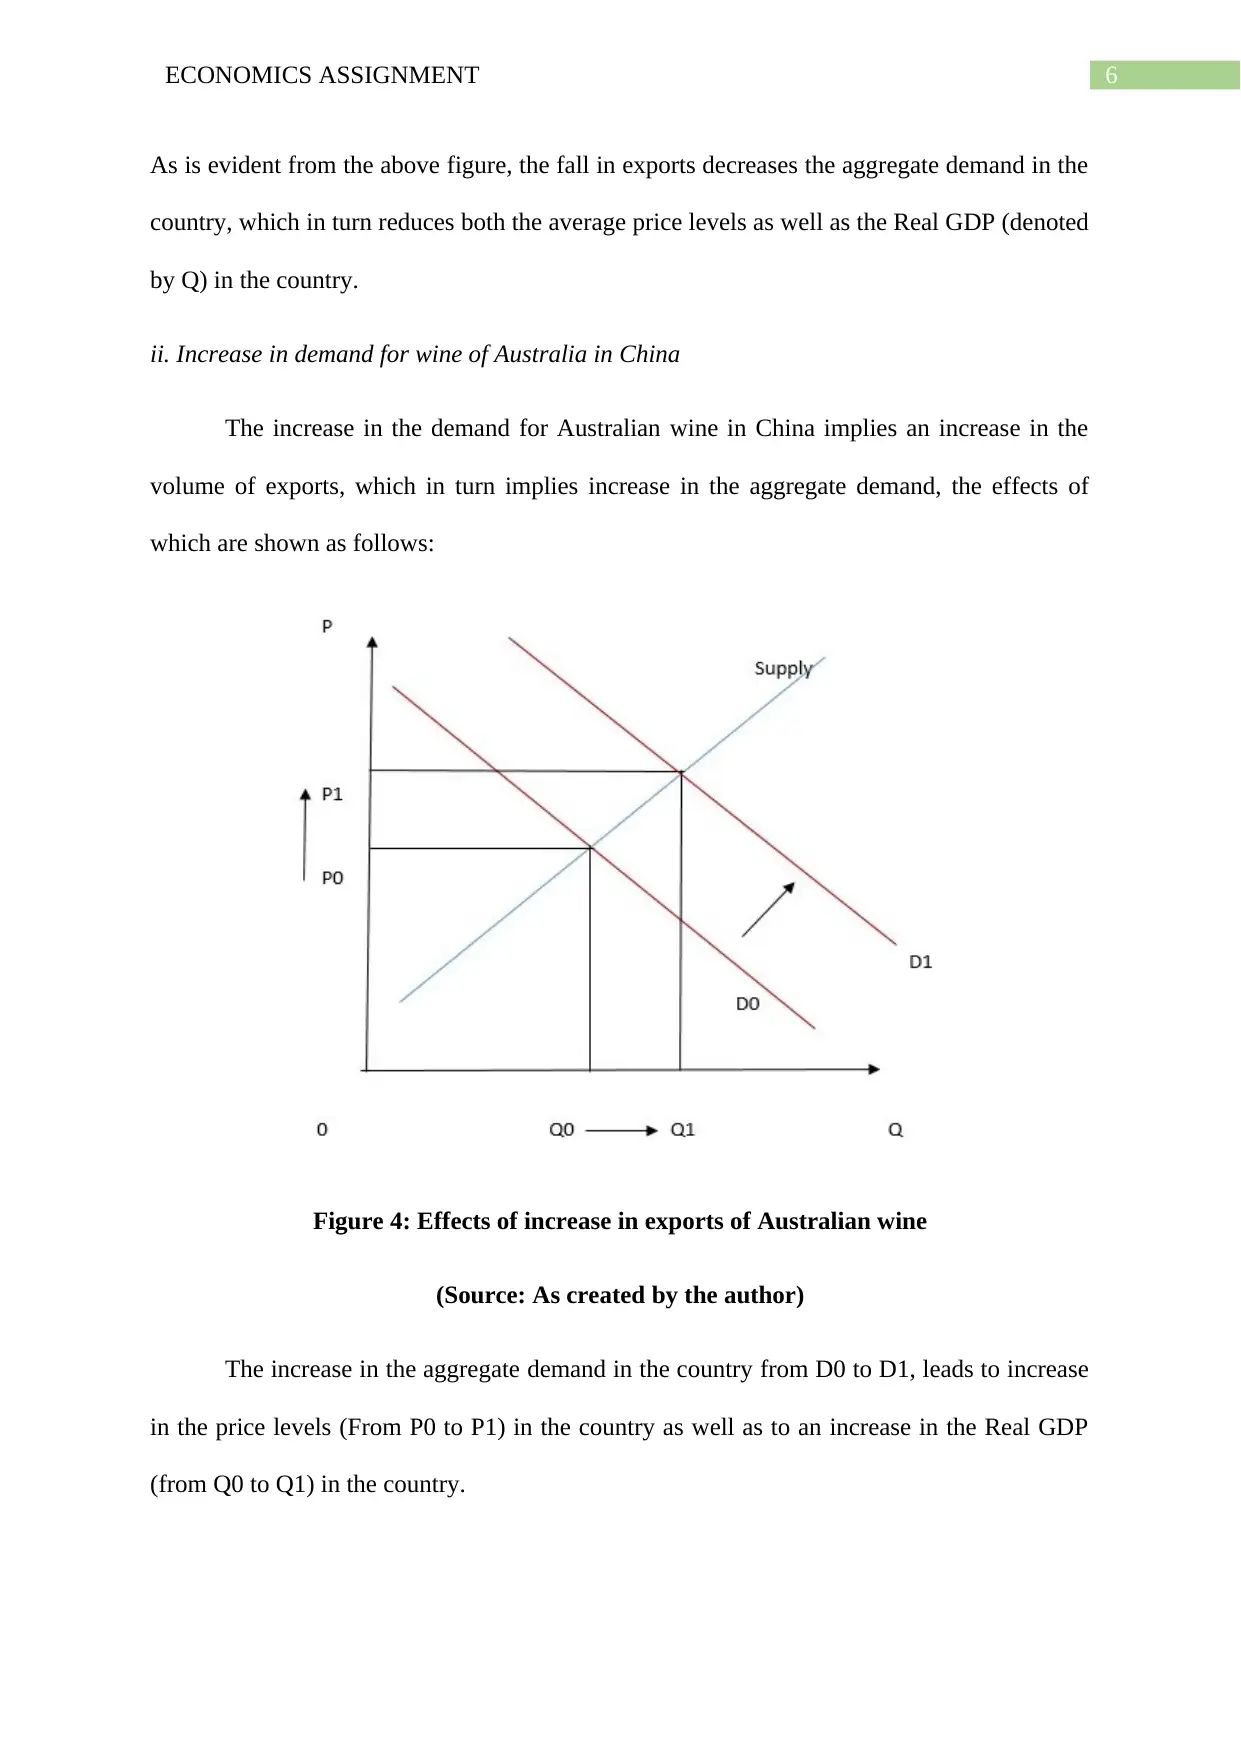
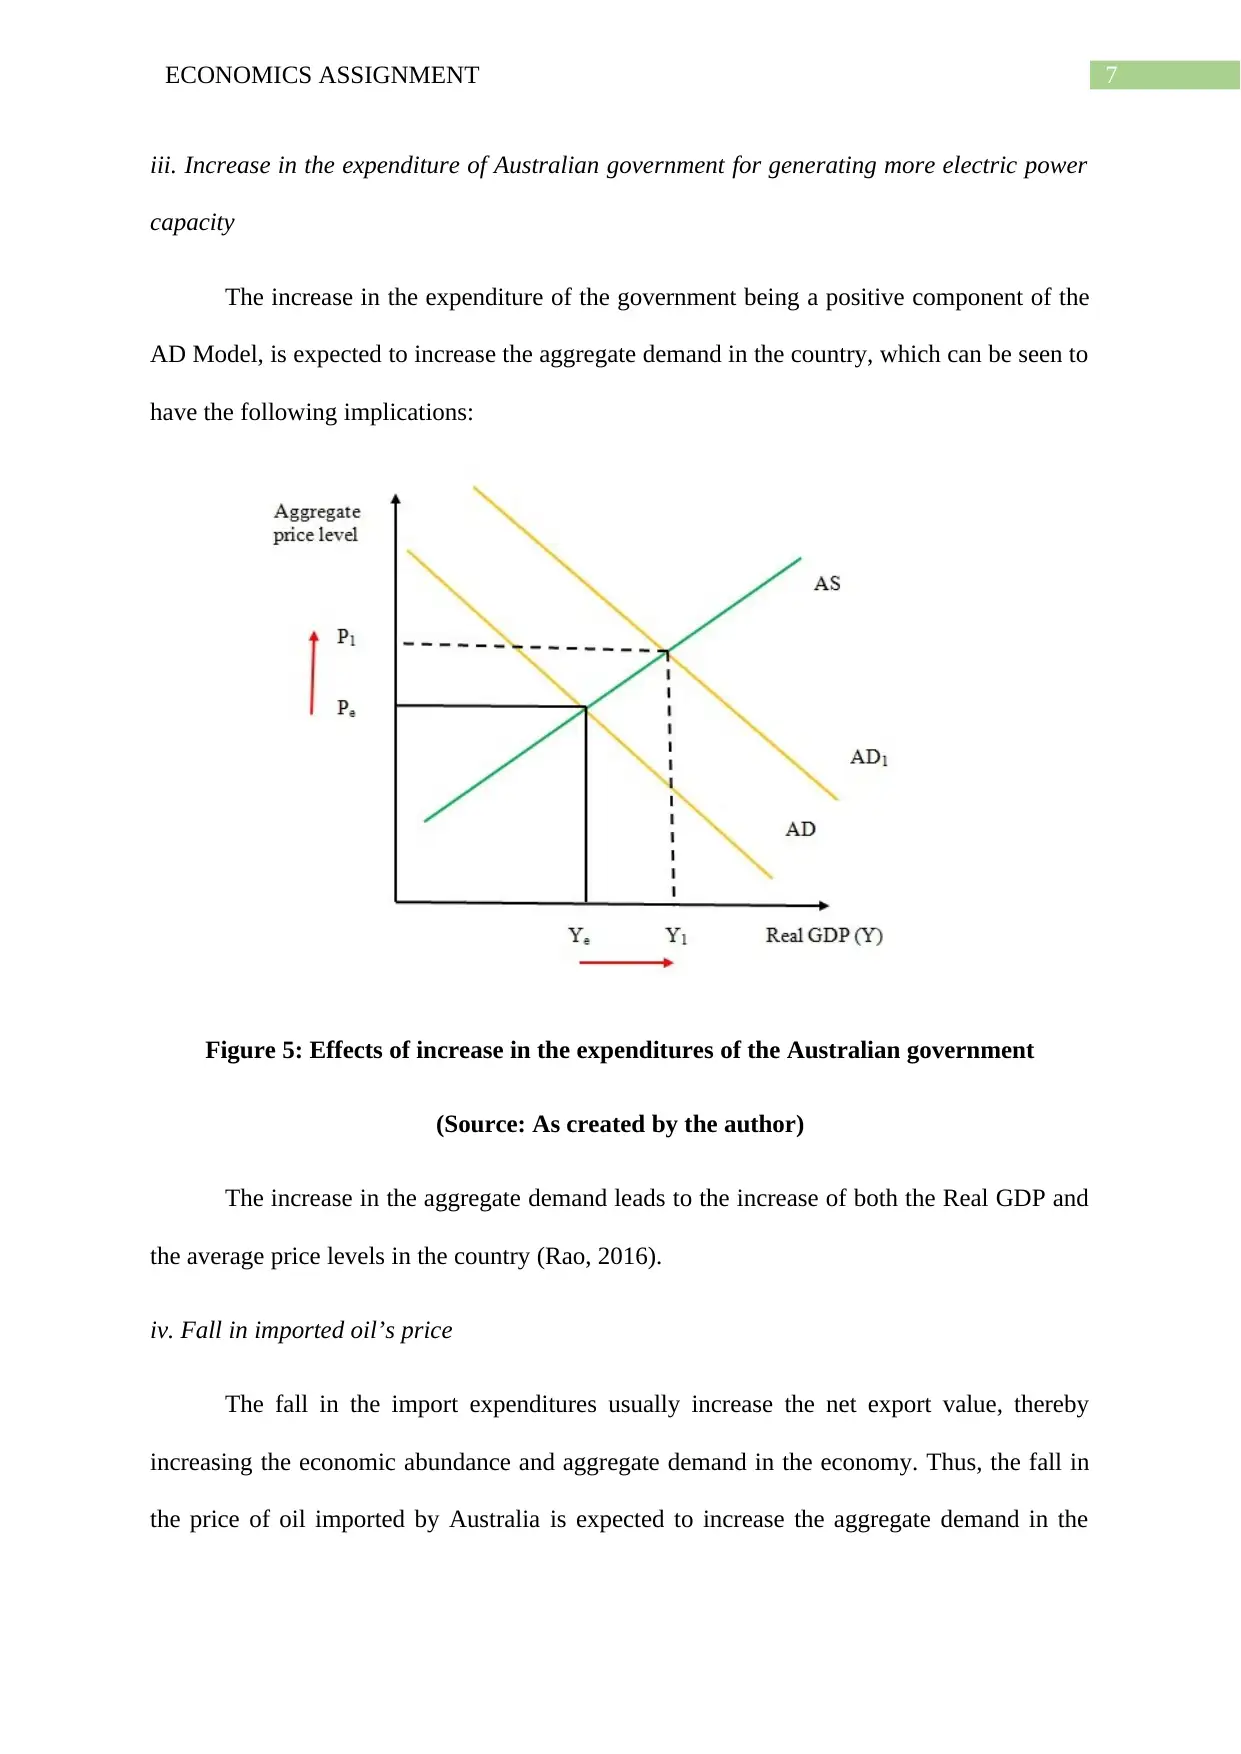
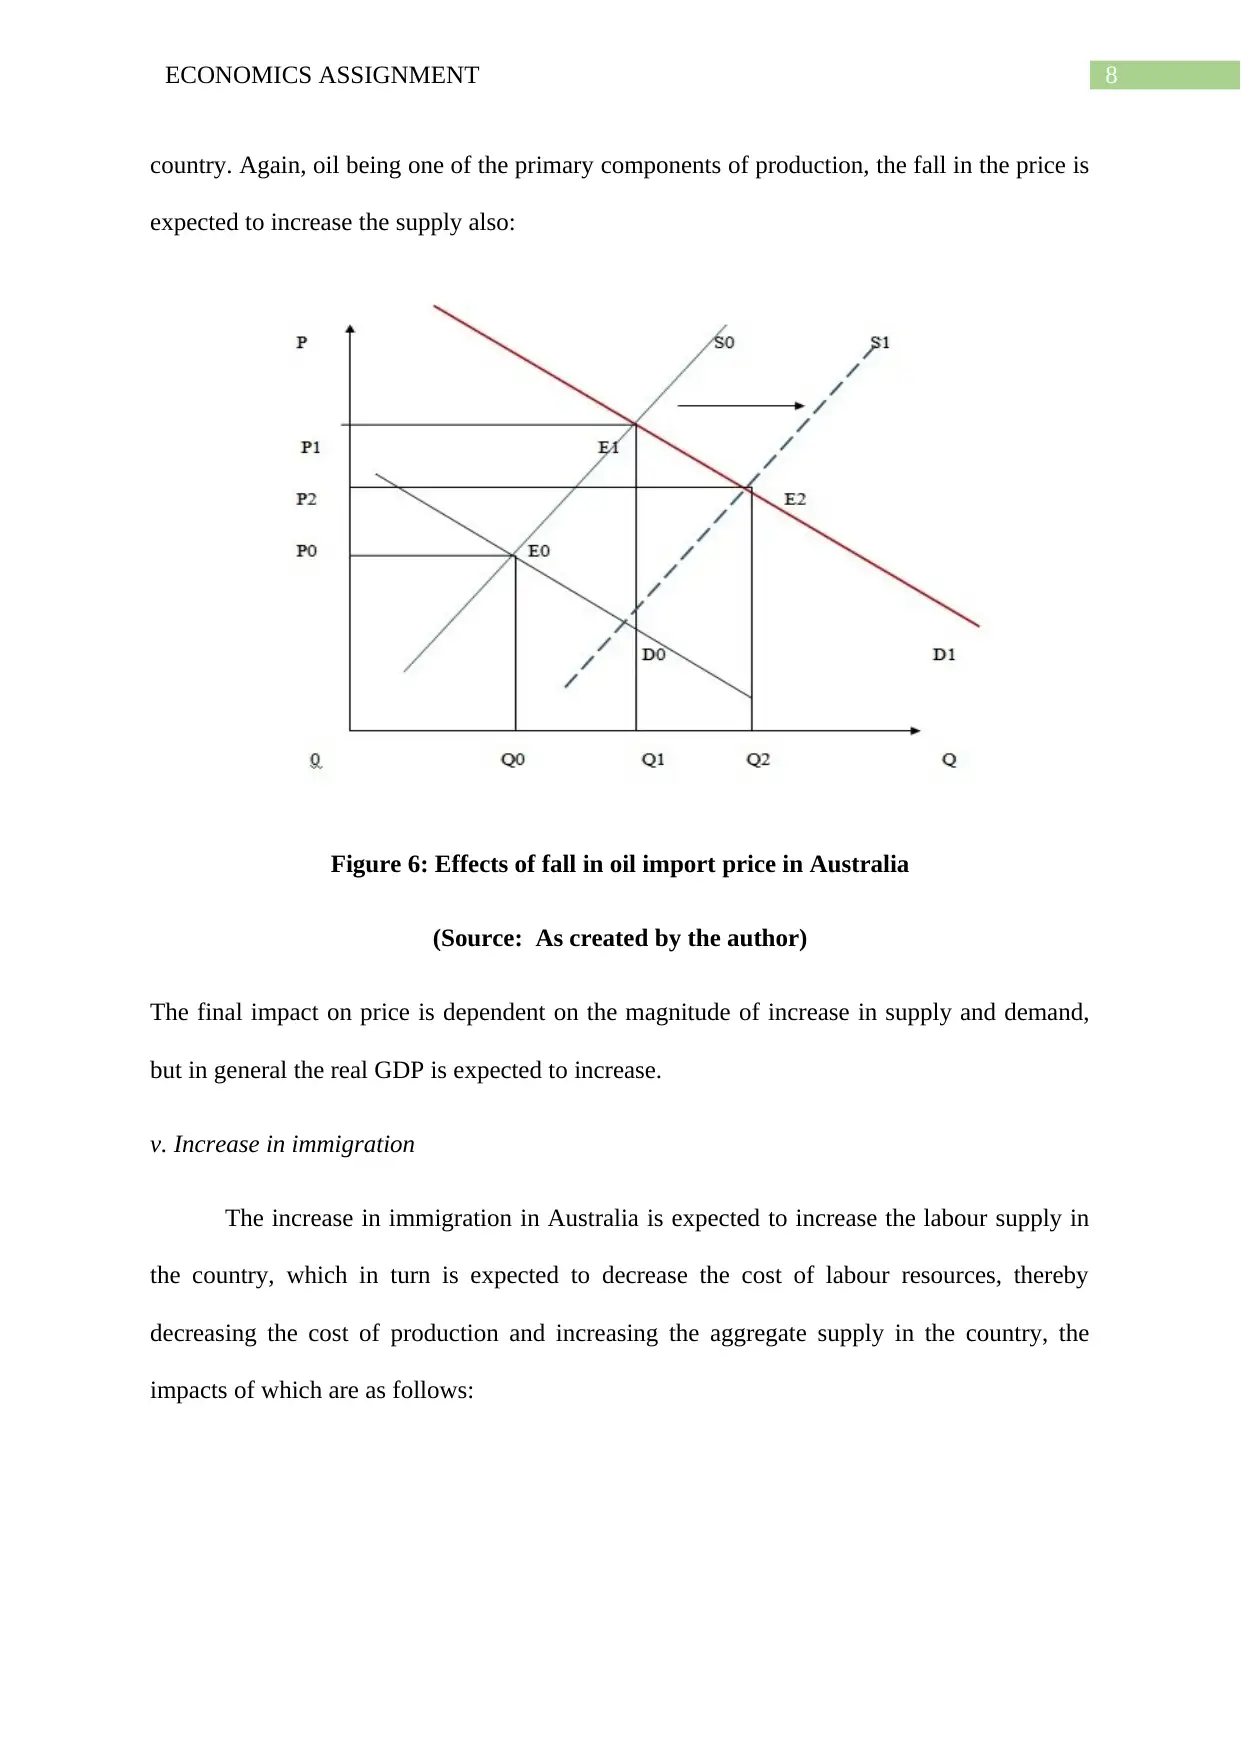
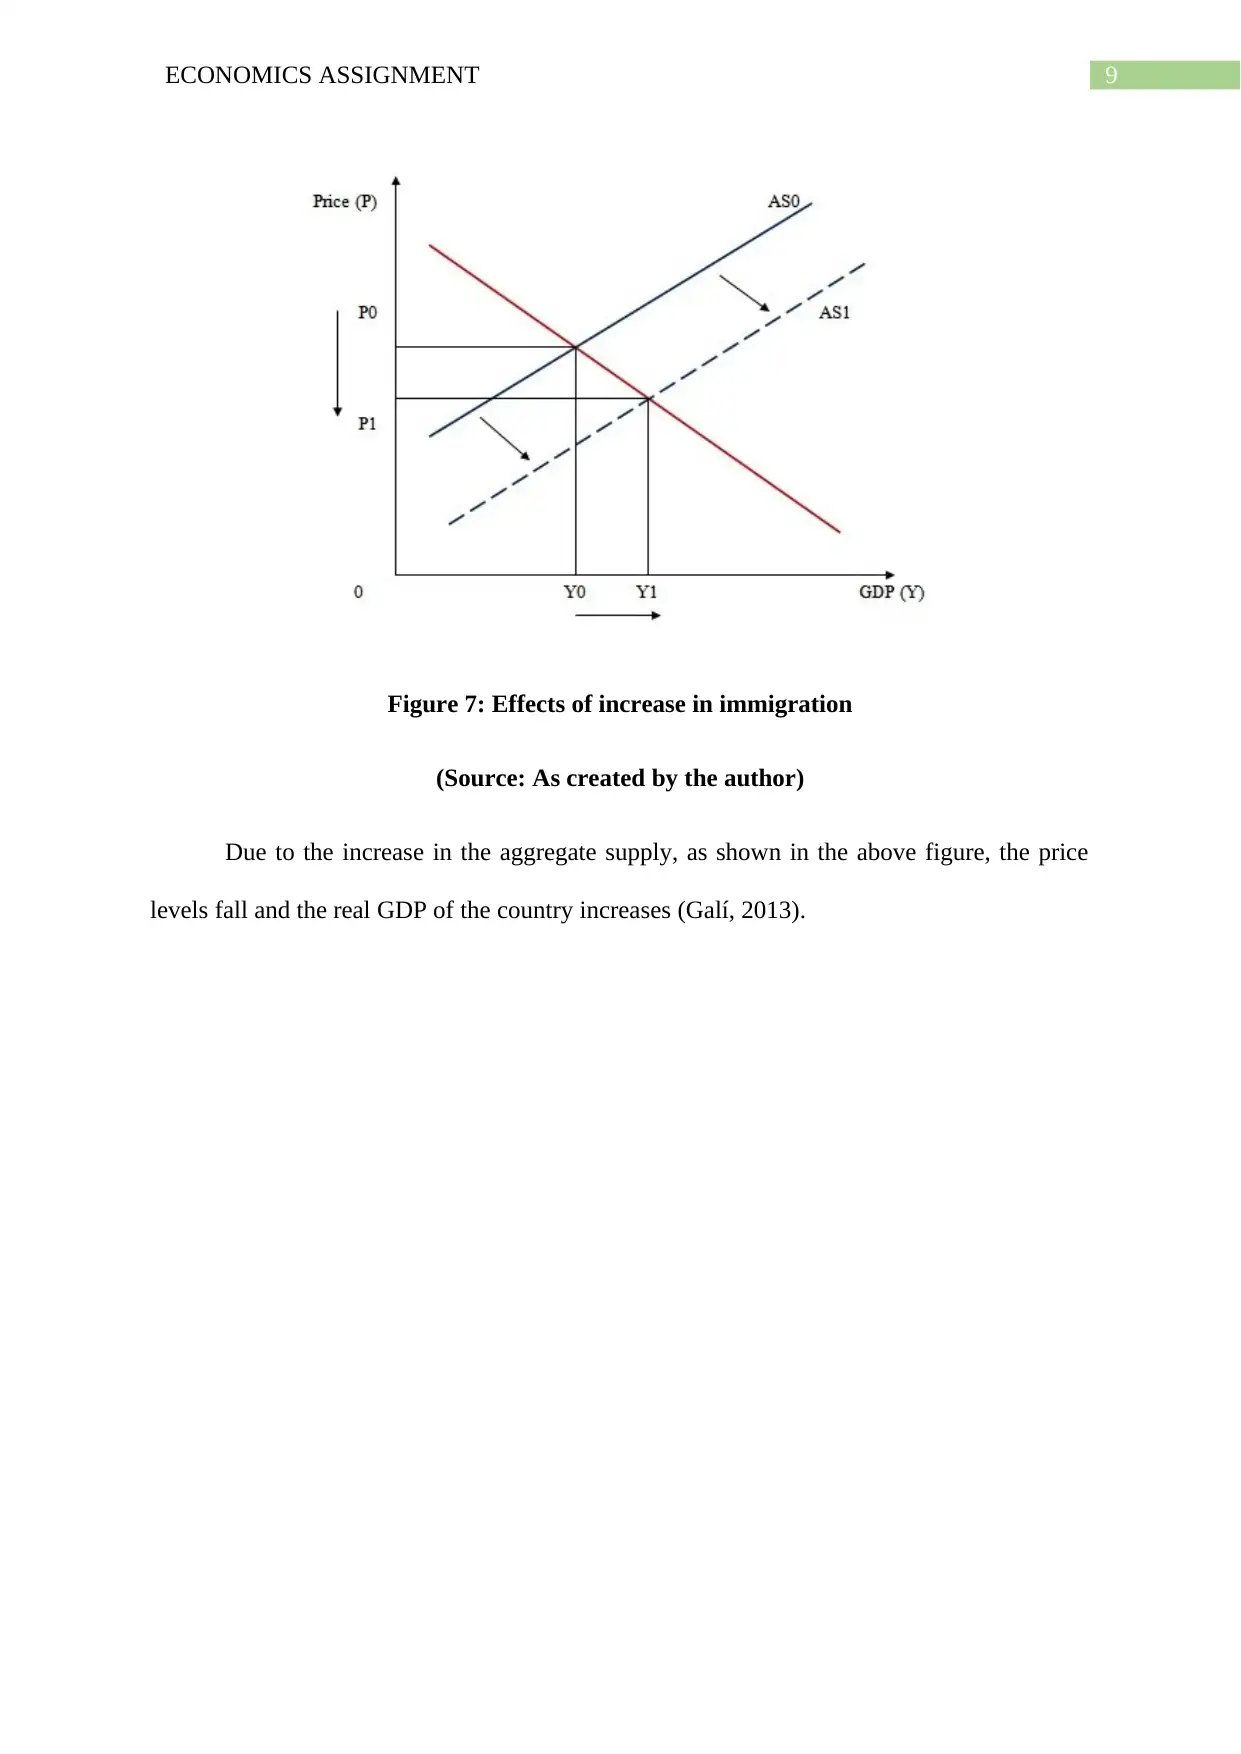
This economics assignment analyzes the macroeconomic indicators of Australia from 2001 to 2016, focusing on the relationship between inflation and unemployment, supported by the Phillips Curve theory. The assignment further explores the aggregate demand (AD) and aggregate supply (AS) model to assess the impact of various economic events on Australia's real GDP and price levels. These events include tariffs on chickpea exports, changes in wine demand in China, government expenditure, oil price fluctuations, and immigration. Each scenario is illustrated with AD-AS diagrams to demonstrate the effects on key economic variables. The analysis provides a comprehensive understanding of how different economic factors influence the Australian economy.

Running head: ECONOMICS ASSIGNMENT
Economics Assignment
Name of the Student
Name of the University
Author Note
Economics Assignment
Name of the Student
Name of the University
Author Note
Paraphrase This Document
Need a fresh take? Get an instant paraphrase of this document with our AI Paraphraser

1ECONOMICS ASSIGNMENT
Table of Contents
Answer 1....................................................................................................................................2
Answer 2....................................................................................................................................4
References................................................................................................................................10

2ECONOMICS ASSIGNMENT
Answer 1
The overall health and performance of the economy of a country at a point of time can
be assessed to a considerable extent by observing the trends which prevail in the different
macroeconomic indicators of the country, which primarily include the GDP growth of the
country, unemployment rate, rate of inflation, exchange rate and others. The rate of inflation
shows the dynamics of the overall price levels in the country at a point of time, which is one
of the eminent macroeconomic indicators of immense significance (Gandolfo, 2013). This is
because an extremely high level of price can affect the wellbeing of the consumers in the
economy by reducing their purchasing power, while a low-price level can lead to loss of
productivity in general and an overall stagnation in the country. On the other hand, the
unemployment rate is another significant economic indicator in the country as it shows the
dynamics and employment scenario as well as the overall health of the labour market of the
country. This in turn, shows the well being of the workers in terms of economic abundance,
purchasing power and overall standard of living (Mankiw, 2014).
Keeping this into consideration, the dynamics in the inflation rate and the
unemployment rate, for the period of 2001 to 2016, of one of the most significant economies
in the contemporary global economic scenario, the economy of Australia and their
relationship (if any) can be shown as follows:
⊘ This is a preview!⊘
Do you want full access?
Subscribe today to unlock all pages.

Trusted by 1+ million students worldwide

3ECONOMICS ASSIGNMENT
Figure 1: Inflation Rate, Unemployment Rate and their relationship for Australia
(2002-2016)
(Source: Abs.gov.au, 2018)
From the above figure, showing the relationship between the unemployment rate and
the inflation rate in Australia within the period (2001-2016), it is evident that the two
concerned variables have a roughly negative relationship, as high inflation rate can be seen to
be related with low level of unemployment and vice versa. This can also be theoretically
supported with the help of the concept of Phillip’s Curve (Johnson, 2017).
Phillip’s Curve Theory
The theory of Phillip’s curve, in the conceptual framework of economics asserts that
there usually exists an inverse relationship between the inflation rate and the rate of
unemployment in a country at a point of time, which is shown by a negatively sloped curve,
which is known as Phillip’s Curve:
Paraphrase This Document
Need a fresh take? Get an instant paraphrase of this document with our AI Paraphraser

4ECONOMICS ASSIGNMENT
Figure 2: Phillip’s Curve and relationship between inflation and unemployment
(Source: Coibion & Gorodnichenko, 2015)
The primary notion behind this inverse relationship is that with the increase in the
employment, that is with the decrease in the unemployment of a country, the amount of
economic abundance among the existing population increases, which in turn increases their
purchasing power and aggregate demand in the country, which in turn pushes the price up,
thereby increasing the level of inflation in the country, which is seen to be occurring in case
of Australia in the period of 2001-2016 (Coibion & Gorodnichenko, 2015).
Answer 2
The productivity and overall demand supply dynamics in a country can be observed
and analysed with the help of the aggregate demand and aggregate supply of model of
macroeconomics, which in turn helps in determining the Real GDP as well as the overall
price levels existing in the country. The Aggregate Demand of a country is composed of the
following components:

5ECONOMICS ASSIGNMENT
AD = C+G+I+NX, where C is the consumption expenditure in the country, I is the
private investment expenditure, G is the spending of the government and NX is the Net
Exports (Exports-Imports) in the country. The Aggregate Supply, on the other hand, of a
country is shown by the total production of goods and services which is denoted by Y, in
general.
Changes in Real GDP and price levels of Australia due to the following:
i. Tariff by India on exports of Chickpeas by Australia
The aggregate demand of a country is positively related with the exports of the
country as with increase in exports, the income inflow increases in the economy, which in
turn increases the purchasing power of the people in the country and their aggregate demand
and vice versa. In this context, the imposition of 30% tariff by India on the chickpeas
exported by Australia to India, will decrease the volume of exports, the effects of which can
be seen as follows:
Figure 3: Effects of a fall in the exports of Australia
(Source: As created by the author)
⊘ This is a preview!⊘
Do you want full access?
Subscribe today to unlock all pages.

Trusted by 1+ million students worldwide

6ECONOMICS ASSIGNMENT
As is evident from the above figure, the fall in exports decreases the aggregate demand in the
country, which in turn reduces both the average price levels as well as the Real GDP (denoted
by Q) in the country.
ii. Increase in demand for wine of Australia in China
The increase in the demand for Australian wine in China implies an increase in the
volume of exports, which in turn implies increase in the aggregate demand, the effects of
which are shown as follows:
Figure 4: Effects of increase in exports of Australian wine
(Source: As created by the author)
The increase in the aggregate demand in the country from D0 to D1, leads to increase
in the price levels (From P0 to P1) in the country as well as to an increase in the Real GDP
(from Q0 to Q1) in the country.
Paraphrase This Document
Need a fresh take? Get an instant paraphrase of this document with our AI Paraphraser

7ECONOMICS ASSIGNMENT
iii. Increase in the expenditure of Australian government for generating more electric power
capacity
The increase in the expenditure of the government being a positive component of the
AD Model, is expected to increase the aggregate demand in the country, which can be seen to
have the following implications:
Figure 5: Effects of increase in the expenditures of the Australian government
(Source: As created by the author)
The increase in the aggregate demand leads to the increase of both the Real GDP and
the average price levels in the country (Rao, 2016).
iv. Fall in imported oil’s price
The fall in the import expenditures usually increase the net export value, thereby
increasing the economic abundance and aggregate demand in the economy. Thus, the fall in
the price of oil imported by Australia is expected to increase the aggregate demand in the

8ECONOMICS ASSIGNMENT
country. Again, oil being one of the primary components of production, the fall in the price is
expected to increase the supply also:
Figure 6: Effects of fall in oil import price in Australia
(Source: As created by the author)
The final impact on price is dependent on the magnitude of increase in supply and demand,
but in general the real GDP is expected to increase.
v. Increase in immigration
The increase in immigration in Australia is expected to increase the labour supply in
the country, which in turn is expected to decrease the cost of labour resources, thereby
decreasing the cost of production and increasing the aggregate supply in the country, the
impacts of which are as follows:
⊘ This is a preview!⊘
Do you want full access?
Subscribe today to unlock all pages.

Trusted by 1+ million students worldwide

9ECONOMICS ASSIGNMENT
Figure 7: Effects of increase in immigration
(Source: As created by the author)
Due to the increase in the aggregate supply, as shown in the above figure, the price
levels fall and the real GDP of the country increases (Galí, 2013).
Figure 7: Effects of increase in immigration
(Source: As created by the author)
Due to the increase in the aggregate supply, as shown in the above figure, the price
levels fall and the real GDP of the country increases (Galí, 2013).
Paraphrase This Document
Need a fresh take? Get an instant paraphrase of this document with our AI Paraphraser

10ECONOMICS ASSIGNMENT
References
Abs.gov.au. (2018). 1345.0 - Key Economic Indicators, 2018. Retrieved from
http://www.abs.gov.au/AUSSTATS/abs@.nsf/mf/1345.0?opendocument#Prices
Abs.gov.au. (2018). 6401.0 - Consumer Price Index, Australia, Mar 2018. Retrieved from
http://www.abs.gov.au/AUSSTATS/abs@.nsf/DetailsPage/6401.0Mar%202018?
OpenDocument
Coibion, O., & Gorodnichenko, Y. (2015). Is the Phillips curve alive and well after all?
Inflation expectations and the missing disinflation. American Economic Journal:
Macroeconomics, 7(1), 197-232.
Galí, J. (2013). Notes for a new guide to Keynes (I): wages, aggregate demand, and
employment. Journal of the European Economic Association, 11(5), 973-1003.
Gandolfo, G. (2013). International Economics II: International Monetary Theory and Open-
Economy Macroeconomics. Springer Science & Business Media.
Johnson, H. G. (2017). Macroeconomics and monetary theory. Routledge.
Mankiw, N. G. (2014). Principles of macroeconomics. Cengage Learning.
Rao, B. B. (Ed.). (2016). Aggregate demand and supply: A critique of orthodox
macroeconomic modelling. Springer.
1 out of 11
Related Documents

Your All-in-One AI-Powered Toolkit for Academic Success.
+13062052269
info@desklib.com
Available 24*7 on WhatsApp / Email
Unlock your academic potential
Copyright © 2020–2025 A2Z Services. All Rights Reserved. Developed and managed by ZUCOL.