Australia and New Zealand Health Workforce Planning: A Comparison
VerifiedAdded on 2023/06/11
|21
|4305
|476
Report
AI Summary
This report provides a comparative analysis of health workforce planning in Australia and New Zealand, both countries within the World Health Organization's Western Pacific Region. It includes an environmental scan of the health workforce, considering relevant policies and health documents. The report presents a data profile for each country, identifies critical issues affecting their health workforces, and evaluates their compliance with WHO recommendations. It utilizes data from WHO reports, national health department websites, and peer-reviewed journals. The findings suggest that both countries have generally addressed WHO priorities, but challenges remain, particularly in technology adoption and reaching underserved areas. Key issues include workforce distribution, practitioner mobility, and care for the elderly, all of which have broader relevance for the Western Pacific region.
Running head: Health Workforce Planning 1
Health Workforce Planning
Student’s (Name)
Institution
Health Workforce Planning
Student’s (Name)
Institution
Paraphrase This Document
Need a fresh take? Get an instant paraphrase of this document with our AI Paraphraser
Health Workforce Planning 2
Executive summary
The health work force in Australia is composed of several occupations and professionals
due to its diversity and size (Schäfer et al., 2015), likewise other countries in the western pacific
region such as New Zealand are also composed of several health workforces aiming to provide
quality health services to their countries without ignoring World Health Organization priorities
as indicated in the WHO report.
This report compares the health workforce of two nations which are of Australia and
New Zealand which are classified under the Western Pacific Region by the World Health
Organization. It carries out an environmental scan of the health workforce considering the
relevant policies and other health documents. The paper goes further to prepare a data profile,
identify critical issues and use the relevant recommendations by WHO to criticize if the countries
are addressing WHO priorities.
The report provides relevant and reliable findings that are obtained from the WHO 2015
and 2016 reports, information from Australia department of Health website and New Zealand
ministry of health website among other relevant peer reviewed journal on the health workforce.
In general, this report indicates that both countries have addressed the priorities of WHO
organizations as addressed in WHO recommendation though there are other issues that are still to
be addressed especially in dealing with technology and in reaching all the areas. The issues that
are addressed in this paper are not only relevant to Australia or New Zealand but they are also
relevant to all the countries in the Western Pacific region due to the vast amount of health issues,
policies and partnership that are shared
Health Workforce Planning 3
Table of Contents
Executive summary.....................................................................................................................................2
Introduction.................................................................................................................................................4
Environmental scan.....................................................................................................................................5
Data profile..................................................................................................................................................7
In Australia..............................................................................................................................................7
In New Zealand.....................................................................................................................................11
Critical issues............................................................................................................................................12
Compliance to WHO recommendation......................................................................................................15
Conclusion.................................................................................................................................................16
Reference...................................................................................................................................................17
Appendix...................................................................................................................................................21
⊘ This is a preview!⊘
Do you want full access?
Subscribe today to unlock all pages.
Trusted by 1+ million students worldwide
Health Workforce Planning 4
Introduction
Health is a key aspect for any human being and any nations, this is seen even in its
appearance as the third SDG goal “Good health and wellbeing”, Buddha the founder of
Buddhism quoted health as the “life’s greatest blessing” (Gauld, 2012). The state of health as an
important need cannot survive without the presence of the health workforce who ensure that the
health sector is at its best and that health services are provided whenever required.
Australia as a country in the western pacific region and a member in the World Health
organization has put up several measures and policies to ensure that they provide quality services
to their citizens. The department of health in the country that is headed by Hon. Jill Hennesse
MP not only sets standards and hospitals but also follow up to ensure that these standards are
implemented amongst other services such as employment for the good of its citizens.
The world health organization is an agency or organization that functions under united
nations with an aim of ensuring quality health internationally, it does this by-passing legislations,
recommendations and medical support for its members (Grigg & Tracy, 2013).
In choosing the country to compare with Australia’s health sector, my choice was New
Zealand. New Zealand and Australia are very close countries that have belonged to several
unions together such as United Nations, World Trade Organization, New Zealand Australia Free
Trade Agreement (NAFTA) and World Health Organization amongst others, the citizens of both
country are free to work in any country amongst them without taxes or tariffs in fact, in the year
Paraphrase This Document
Need a fresh take? Get an instant paraphrase of this document with our AI Paraphraser
Health Workforce Planning 5
2013 approximately 650, 000 citizens of New Zealand were staying in Australia (Perkins et al.,
2015), this was about quarter of the total population in New Zealand.
New Zealand is a country found in the southwester part of the Pacific Ocean with about
600 Islands within it (Huntington et al., 2011), this Island country is headed by a queen closely
followed by a prime minister who are advised by several other ministers, among the ministries is
the health ministry that is currently headed by Dr. David Clark (Gauld, Horsburgh, & Brown,
2011).
This country though different in size share a lot of issues such as diversity and presence
of islands amongst other issues such as sharing a British colonial heritage and belonging to
settler communities (Williamson, & Harrison, 2010).
Environmental scan
The health workforce in Australia and New Zealand is comprised of several medical
professionals such as the doctors, nurses, volunteers and medical practitioners (Moore et al.,
2015). They include the professionals who carry out activities such as physical treatment, mental
treatment and those that carry out consultations in the psychological department.
The largest number of health force is comprised of the nurses and midwives as compared
to other professionals (Zimmet, Moylan, & Colagiuri, 2017), out of this population the largest
gender is occupied by women with little percentage of men, according to statistics 54% of health
workforce in New Zealand are women and they continue to produce more women from medical
schools the same is seen in Australia this population is at 53% as compared to the men in the
health workforce.
Health Workforce Planning 6
In both countries there has been significant improvement in the quality of medical
practitioners leading to decrease in the mortality rate in both country because of diseases such as
cancer, asthma, HIV and other cardiovascular diseases.
Most health professionals are in urban areas due to the large population in the urban
centers (Pairman, Tracy, Thorogood, & Pincombe, 2010) and most hospitals are public hospitals
which means that most of the health workers are found in the public hospitals.
According to common wealth statistics both countries medical practitioner was among
the best in administrative efficiency (Schluter et al., 2011), administrative efficiency is
concerned with the management of the hospital or any medical service provision organization.
In terms of health outcomes both countries have had good health outcomes in terms of
looking at the performance of the workers, they have had better health outcomes that has
surpassed that of the US though the UK is still ahead of the countries (McFarlane & Van, 2017).
Australia is among the top ten countries global that spend huge amount of money to fund
their medical sector, though this is greater than that of New Zealand, in terms of percentage they
both spend a large percentage of their tax in the medical department. Both countries health
systems are funded by taxes up to 80% and then the rest is because of sponsorships and
donations (Chrisopoulos, Harford, & Ellershaw, 2016).
The nurses and midwives that form the largest population in the medical category are
found to be the ones that are receiving the least amount of salary ranging $50,000 to 70 000$ per
year compared to the few general practitioners who receive salaries that range from $100 000 to
$200 000 per year (Crowther et al., 2018).
These countries share a common reporting system (OECD. Publishing, 2013) and
according statistics both countries have developed in the research process and promotion
⊘ This is a preview!⊘
Do you want full access?
Subscribe today to unlock all pages.
Trusted by 1+ million students worldwide
Health Workforce Planning 7
amongst the in the medical practitioner’s category however they do not share in the educational
system or curriculum the largest difference being seen in the education of the dentist (Laurence
& Karnon, 2016).
Both countries contain laws or regulations and conduct document that dictate the
behavior of medical practitioners and the laws sometime refer to each other, both government
have tried their best to create the best working conditions to the doctors and the nurses.
The professional conduct in terms of behavior of the New Zealand health force has been
doubtful with several scandals of wrong surgery (Kensington et al., 2018), smoking at work
amongst and majorly corruption despite the large investment of the government to the health
sector.
Data profile
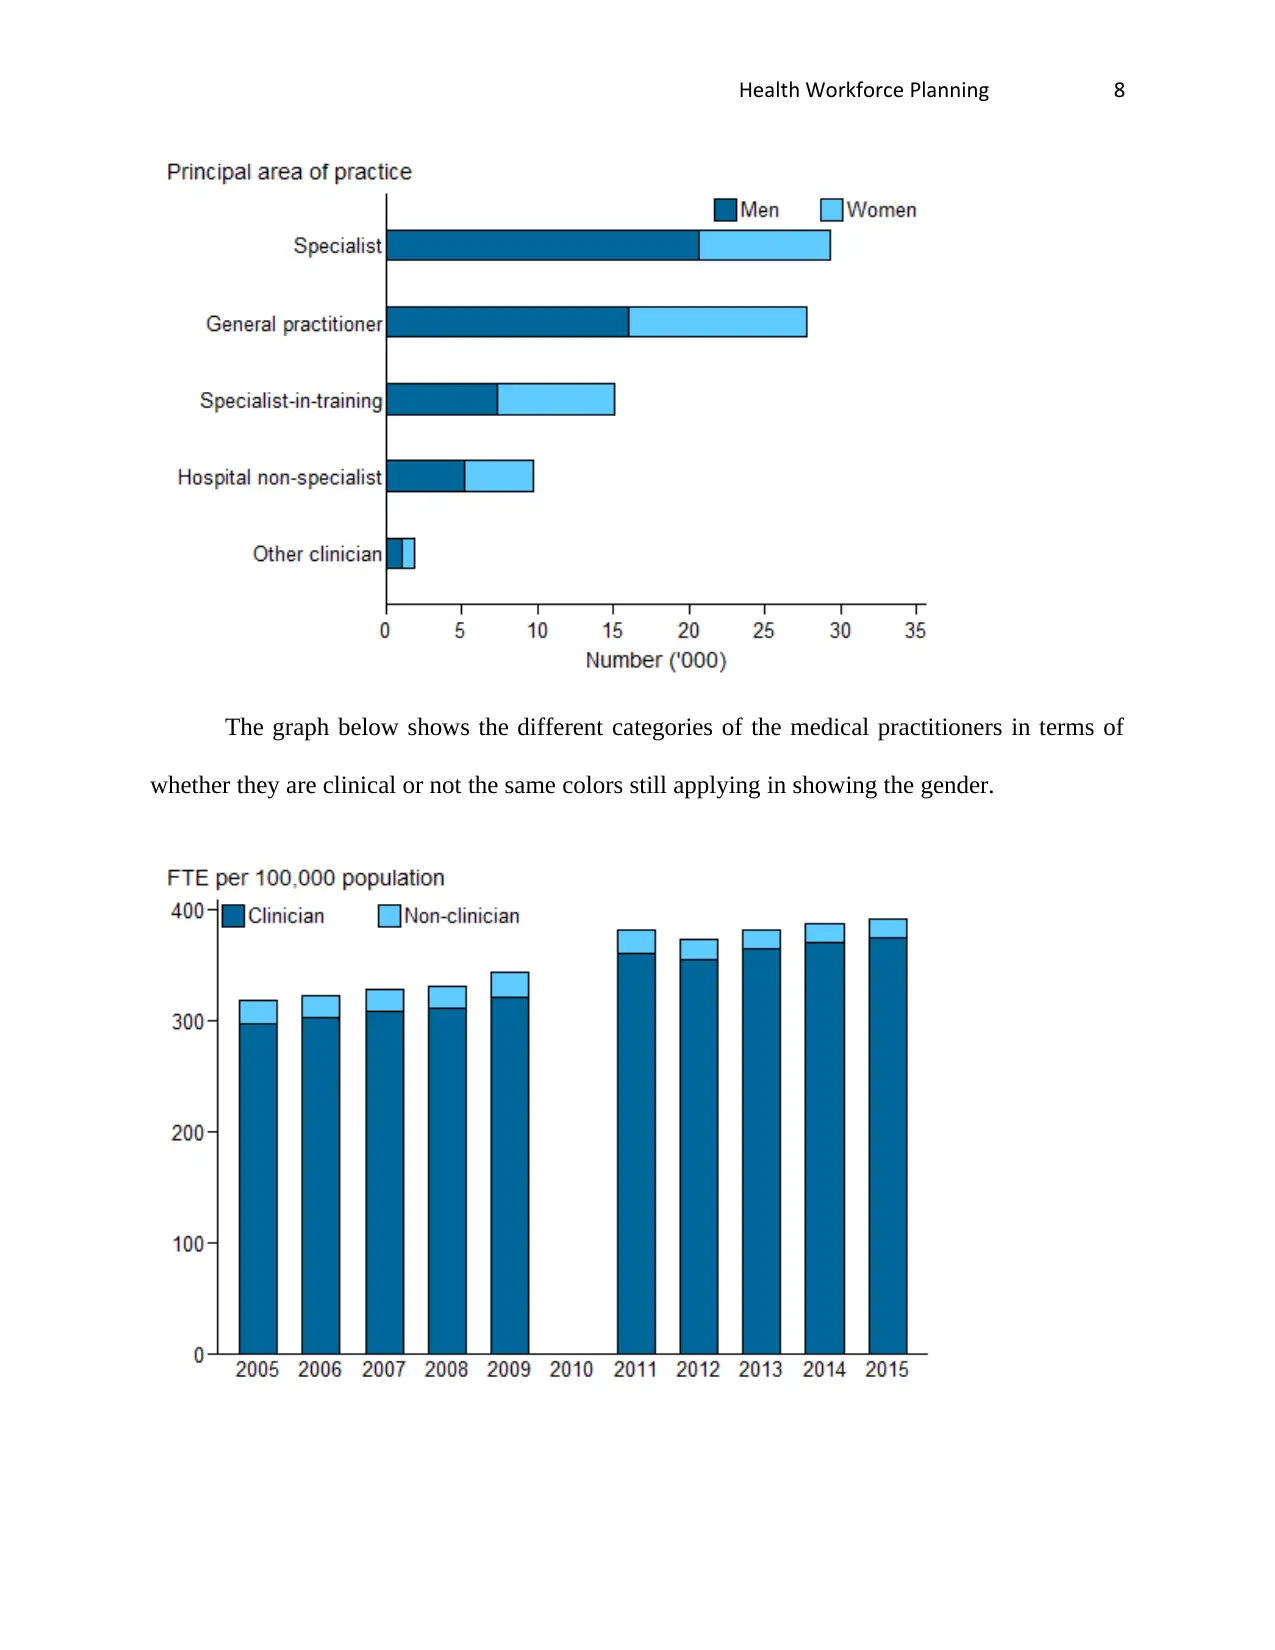
In Australia
For nurses and midwives, according to statistics 9 out 10 employees in Australia are
women. This is 90.3%,98% of the midwives were the women. Out of 100 000 people there are
57dentist comprising of 4 dental therapists and 5 dental hygienists.
The graph below provides the gender of the practitioners working in Australia
categorized according to the area of work
amongst the in the medical practitioner’s category however they do not share in the educational
system or curriculum the largest difference being seen in the education of the dentist (Laurence
& Karnon, 2016).
Both countries contain laws or regulations and conduct document that dictate the
behavior of medical practitioners and the laws sometime refer to each other, both government
have tried their best to create the best working conditions to the doctors and the nurses.
The professional conduct in terms of behavior of the New Zealand health force has been
doubtful with several scandals of wrong surgery (Kensington et al., 2018), smoking at work
amongst and majorly corruption despite the large investment of the government to the health
sector.
Data profile
In Australia
For nurses and midwives, according to statistics 9 out 10 employees in Australia are
women. This is 90.3%,98% of the midwives were the women. Out of 100 000 people there are
57dentist comprising of 4 dental therapists and 5 dental hygienists.
The graph below provides the gender of the practitioners working in Australia
categorized according to the area of work
Paraphrase This Document
Need a fresh take? Get an instant paraphrase of this document with our AI Paraphraser
Health Workforce Planning 8
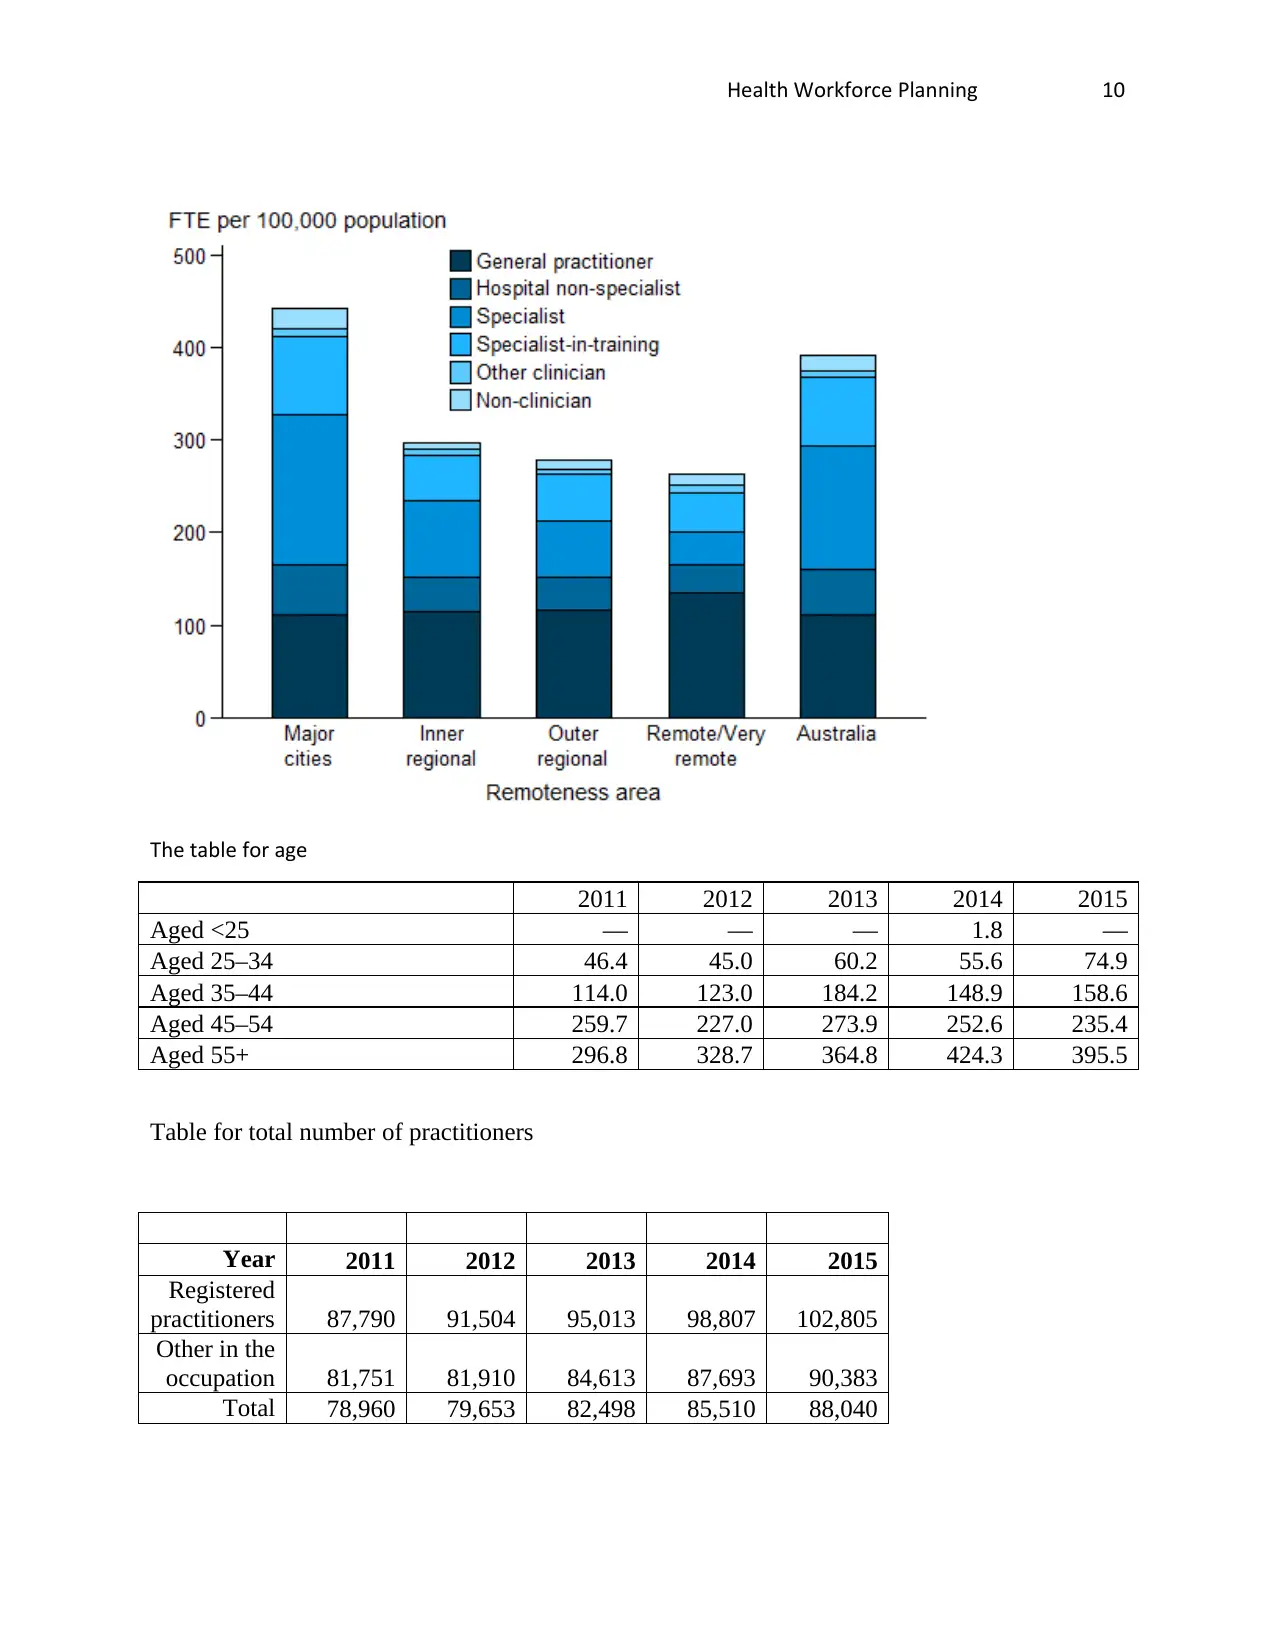
The graph below shows the different categories of the medical practitioners in terms of
whether they are clinical or not the same colors still applying in showing the gender.
The graph below shows the different categories of the medical practitioners in terms of
whether they are clinical or not the same colors still applying in showing the gender.
Health Workforce Planning 9
Table in terms of the regions in Australia
Year NSW Vic Qld WA SA Tas ACT NT Australia
2005 24,566 17,315 10,514 5,766 5,664 1,700 1,592 773 67,890
2006 25,116 18,625 10,821 7,196 5,800 1,592 1,614 977 71,740
2007) 24,810 19,509 13,928 8,247 6,113 1,846 1,720 1,020 77,193
2008 25,105 19,711 15,235 7,872 6,212 1,793 1,778 964 78,669
2009(a) 25,625 20,648 16,526 8,401 6,470 2,204 1,902 1,120 82,895
2011 27,723 21,148 16,865 8,456 6,804 2,021 1,718 1,010 87,790
2012( 28,104 21,320 17,070 8,726 6,771 1,972 1,748 1,061 88,254
2013 29,066 21,912 17,377 9,115 6,910 2,020 1,782 1,080 91,467
2014 29,902 22,824 18,072 9,376 7,073 2,083 1,802 1,146 94,617
2015 30,578 23,675 18,771 9,735 7,180 2,079 1,853 1,178 97,466
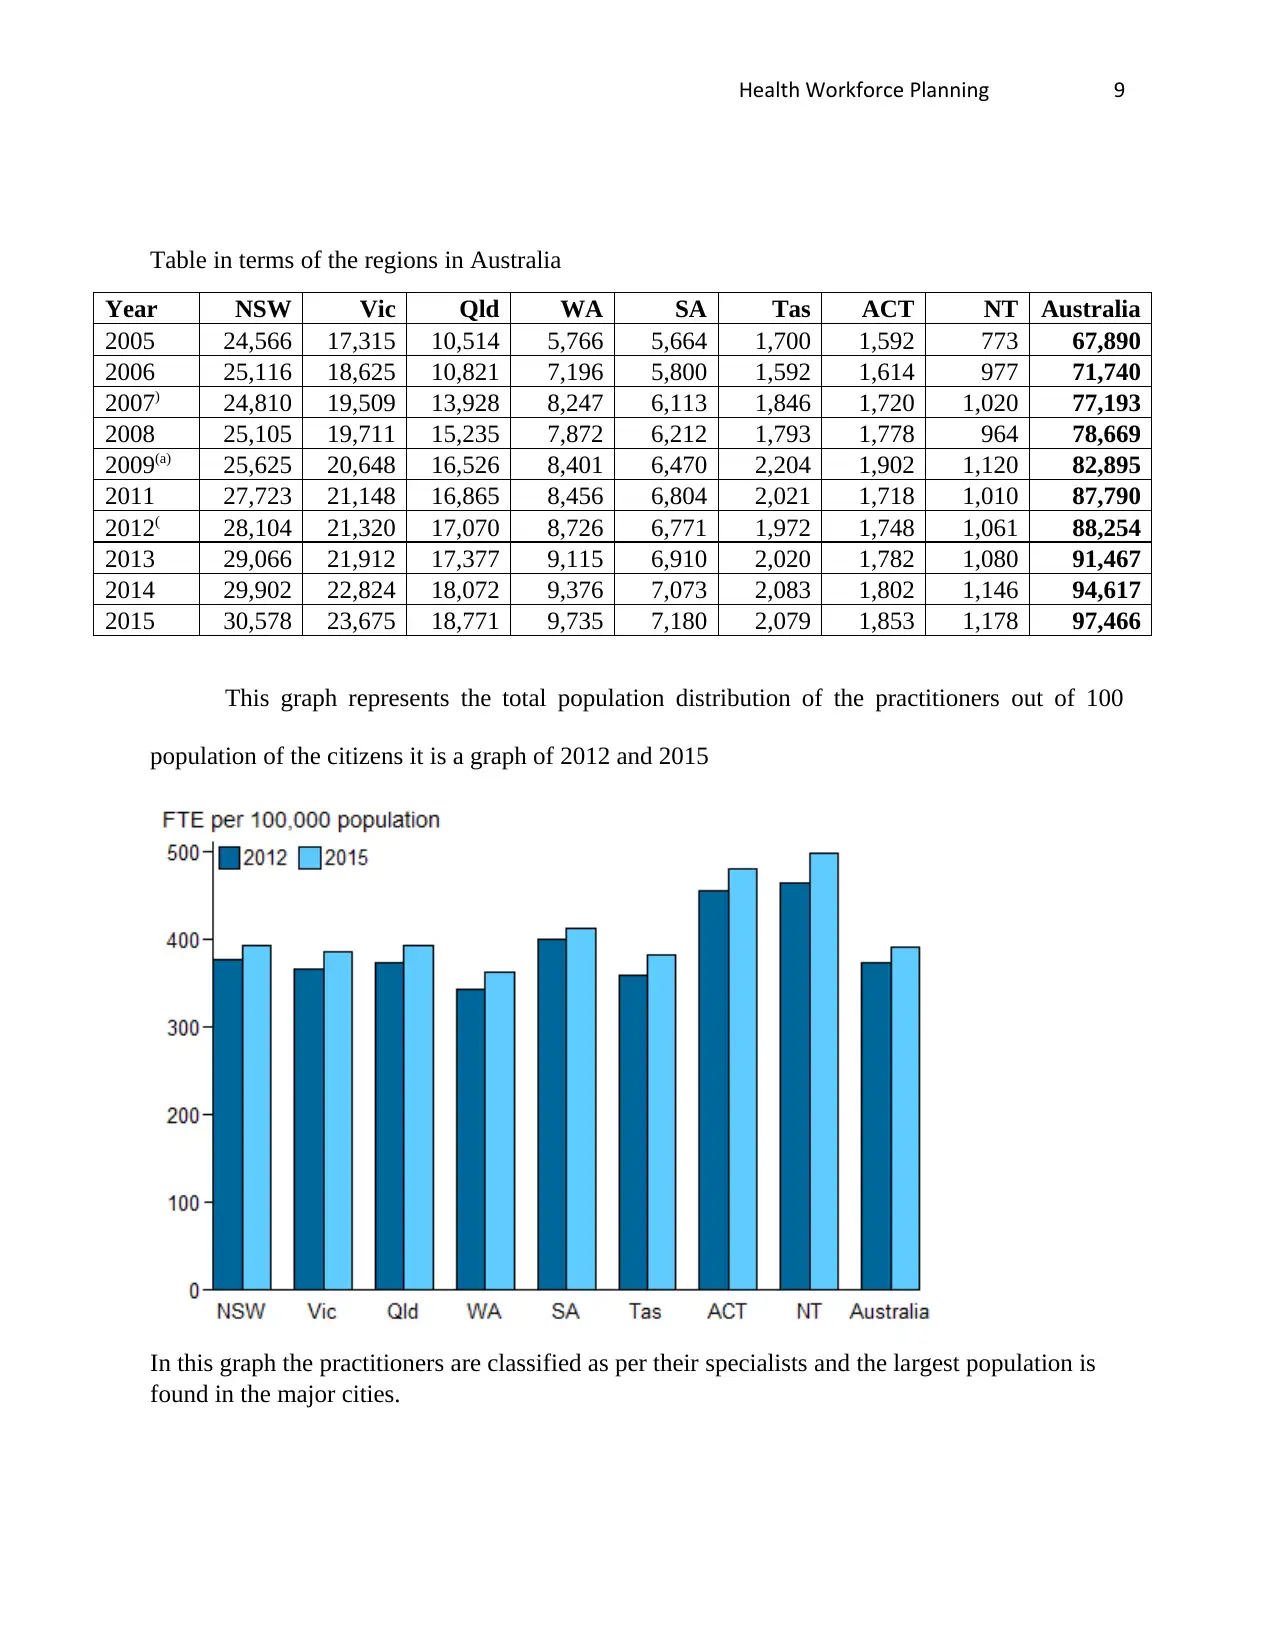
This graph represents the total population distribution of the practitioners out of 100
population of the citizens it is a graph of 2012 and 2015
In this graph the practitioners are classified as per their specialists and the largest population is
found in the major cities.
Table in terms of the regions in Australia
Year NSW Vic Qld WA SA Tas ACT NT Australia
2005 24,566 17,315 10,514 5,766 5,664 1,700 1,592 773 67,890
2006 25,116 18,625 10,821 7,196 5,800 1,592 1,614 977 71,740
2007) 24,810 19,509 13,928 8,247 6,113 1,846 1,720 1,020 77,193
2008 25,105 19,711 15,235 7,872 6,212 1,793 1,778 964 78,669
2009(a) 25,625 20,648 16,526 8,401 6,470 2,204 1,902 1,120 82,895
2011 27,723 21,148 16,865 8,456 6,804 2,021 1,718 1,010 87,790
2012( 28,104 21,320 17,070 8,726 6,771 1,972 1,748 1,061 88,254
2013 29,066 21,912 17,377 9,115 6,910 2,020 1,782 1,080 91,467
2014 29,902 22,824 18,072 9,376 7,073 2,083 1,802 1,146 94,617
2015 30,578 23,675 18,771 9,735 7,180 2,079 1,853 1,178 97,466
This graph represents the total population distribution of the practitioners out of 100
population of the citizens it is a graph of 2012 and 2015
In this graph the practitioners are classified as per their specialists and the largest population is
found in the major cities.
⊘ This is a preview!⊘
Do you want full access?
Subscribe today to unlock all pages.
Trusted by 1+ million students worldwide
Health Workforce Planning 10
The table for age
2011 2012 2013 2014 2015
Aged <25 — — — 1.8 —
Aged 25–34 46.4 45.0 60.2 55.6 74.9
Aged 35–44 114.0 123.0 184.2 148.9 158.6
Aged 45–54 259.7 227.0 273.9 252.6 235.4
Aged 55+ 296.8 328.7 364.8 424.3 395.5
Table for total number of practitioners
Year 2011 2012 2013 2014 2015
Registered
practitioners 87,790 91,504 95,013 98,807 102,805
Other in the
occupation 81,751 81,910 84,613 87,693 90,383
Total 78,960 79,653 82,498 85,510 88,040
Paraphrase This Document
Need a fresh take? Get an instant paraphrase of this document with our AI Paraphraser
Health Workforce Planning 11
Overall classification of workforce in Australia up to 2017
Category 2010 2011 2012 2013 2014 2015 2016 2017 Total
Clinician 26,682 20,719 16,927 8,543 6,417 1,802 1,559 1,039 83,731
Non-clinician 1,462 1,199 624 409 296 98 156 63 4,309
Administrator 446 372 250 176 98 33 84 30 1,490
Teacher/educator 370 231 172 115 75 39 35 19 1,056
Researcher 479 483 125 84 94 19 21 13 1,319
Other 167 113 77 34 29 7 16 1 444
In New Zealand
In terms of overall number of practitioners
Practitioners
Category Total
General
practitioners 3541
Medical
Officers 970
House
officers 500
Special
scale
Primary
care 150
Registrars 1689
Specialists 3879
Others 275
Not
reported 160
Total 11164
Health Workforce Planning 12
In terms of gender
Year 2007 2008 2009
Ethnicity non-
Māori Total Māori
non-
Māori Total Māori
non-
Māori Total
Female 5925 6065 178 6306 6484 181 6621 6802
Male 3571 3692 150 3918 4068 149 4213 4362
Total 9496 9757 328 10224 10552 330 10834 11164
Types of nurses
Registered Total
Enrolled 41406
Nurse
practitioner 2933
Nurse
assistant 16
205
44560
Critical issues
Some of the health issues that need to be addressed in New Zealand are:
There is a problem providing health services to the areas that are found in the rural areas
or areas that are located away from the city because a lot of the health workforce with are
founding the city, also there are few technological machines in handling a lot of diseases in the
indigenous areas since the medical practitioners with knowledge of operating this machine have
move to the city.
The country is also facing problems with mobility of practitioners in that most of the
practitioners do not settle in a single place for a long time for work, they keep on changing their
⊘ This is a preview!⊘
Do you want full access?
Subscribe today to unlock all pages.
Trusted by 1+ million students worldwide
1 out of 21
Related Documents


Your All-in-One AI-Powered Toolkit for Academic Success.
+13062052269
info@desklib.com
Available 24*7 on WhatsApp / Email
![[object Object]](/_next/static/media/star-bottom.7253800d.svg)
Unlock your academic potential
Copyright © 2020–2026 A2Z Services. All Rights Reserved. Developed and managed by ZUCOL.