Assessing Net Overseas Migration in Australia and Common Good
VerifiedAdded on 2020/03/16
|20
|3590
|41
Report
AI Summary
This report analyzes net overseas migration (NOM) in Australia, examining its trends, drivers, and consequences. It explores the significant influx of immigrants, particularly the shift from UK to Asian origins, and its impact on population growth, GDP, and infrastructure. The report details the fluctuation in NOM, driven primarily by temporary migration, especially student visas, and its economic implications. It discusses the relationship between NOM and the Catholic Social Teaching principle of "the common good," highlighting concerns about environmental pollution, strain on resources, and poverty. The conclusion emphasizes the need for governmental regulation of population growth to mitigate negative effects. Data from 2004-2014 are analyzed, with tables and figures illustrating migration types, trends, and contributing factors. The report also examines the impact of skilled migration policies and the influence of Australian and New Zealand citizen movements on NOM.

NET OVERSEAS MIGRATION IN AUSTRALIA
Paraphrase This Document
Need a fresh take? Get an instant paraphrase of this document with our AI Paraphraser
NET OVERSEAS MIGRATION IN AUSTRALIA
Abstract
The report assessed the net overseas movement in Australia and its effects regarding the
universal interest principle. Australia's population growth rate though fluctuating annually
have is considerably high compared to other nations belonging to the OECD. This high rate is
majorly due to the enormous influx of immigrants flowing into the country. This number hit
its peak in 2008 with the temporary immigrants increasing massively. Afterwards, there were
legislations to try control it. The significant shift which has occurred ever seen is the growth
in the immigrants from Asia to surpass those originating from the United Kingdom with the
government more focused on allowing in more immigrants who come to Australia for the
sake of pursuing career and education.
Even though a growing population results in a colossal GDP, the effects of the fast-growing
Australian society is becoming more of a problem than the arising benefits. The infrastructure
development in the country is currently not at per with the increase in population. Also, there
is growing stress in the housing sector. As much as this means more profit for the banking
sector, it adds little gain to the lower income population who are spending more to access the
services.
The conclusion is that a faster growth will lead to environmental pollution, a burden to the
community regarding taking care of the elderly, faster depletion of the natural resources and a
general increase in poverty level. The government, therefore, need to change its objectives I
regard to the population growth and put more measures to regulate those entering the country
NET OVERSEAS MIGRATION IN AUSTRALIA
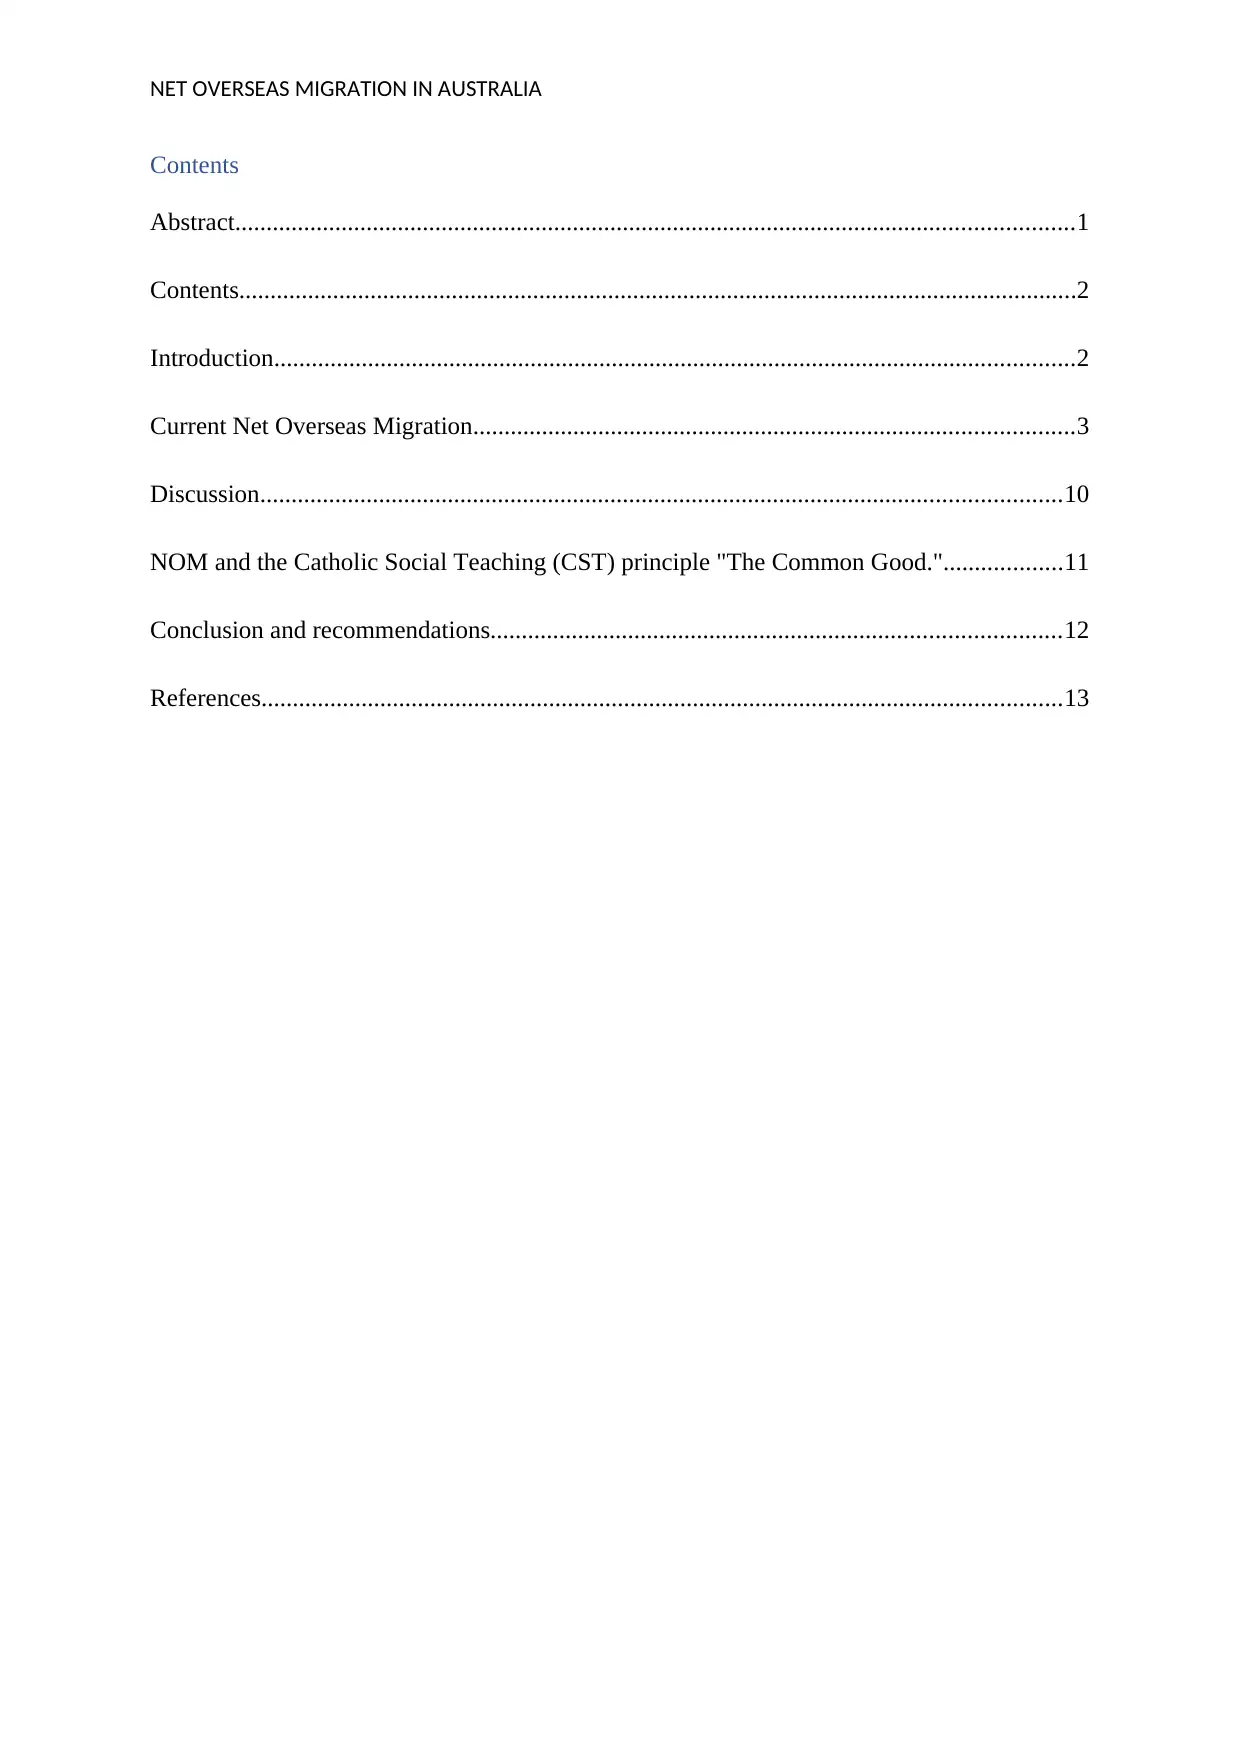
Contents
Abstract......................................................................................................................................1
Contents......................................................................................................................................2
Introduction................................................................................................................................2
Current Net Overseas Migration................................................................................................3
Discussion................................................................................................................................10
NOM and the Catholic Social Teaching (CST) principle "The Common Good."...................11
Conclusion and recommendations...........................................................................................12
References................................................................................................................................13
⊘ This is a preview!⊘
Do you want full access?
Subscribe today to unlock all pages.
Trusted by 1+ million students worldwide
NET OVERSEAS MIGRATION IN AUSTRALIA
Introduction
Net overseas migration (NOM) is the net gain or loss regarding the population via the
processes of emigration and immigration. The net profit or loss is assessed on a global travel
duration of a star in or out of the nation for a one-year period and above. In the current
method of gauging the final net overseas migration in Australia, it is based on travelers’
actual stay duration or absence using 12/16-month principle. Originally the NOM estimation
is done through modeling on passengers' behaviors’ pattern seen in the final NOM estimates
over the same period one year ago. The NOM is essential to evaluate as it has economic and
social consequences to the citizens of the country (Burnley, 2001). For this purpose, our
report will focus on the trend in net overseas migration and how it has influenced the Catholic
social teaching of the "the common good."
Australia is ranked as one of the top countries where immigration is highest around the globe
joined in the list by Canada, USA, and New Zealand. From 1945 when the first federal
immigration portfolio was developed more than 7.5 million individuals have migrated and
settled in Australia. In June 2015, the Australis residents' born overseas was valued to be
28.2% of the entire population a number which is considerably higher compared to other
nations under OECD (Simon-Davies, 2017).
In the past, people from the United Kingdom formed the major block of individuals who are
moving permanently into Australia this trend changed in the year 2010-2011 when the
Chinese surpassed the UK for the first time in Australian history. From then onwards it has
been China and India who provide the highest number of immigrants. Even though New
Zealand citizens do feature highly in the settler arrivals value, they are omitted from the
Australia migration program unless they apply for and are given a permanent visa (O'Farrell,
2001).
Paraphrase This Document
Need a fresh take? Get an instant paraphrase of this document with our AI Paraphraser
NET OVERSEAS MIGRATION IN AUSTRALIA
The Australian migration program planning numbers have differed based on the priorities,
economic and political objectives of the government in power. Despite this, it is essential to
take in to account the fact that the government immigration policy focus has shifted
significantly since 1945 when attracting general migrants mainly from the UK was the
priority. The center is now on attracting economic and temporary migrants. This pattern has
seen more skilled migrants get into Australia.
The last ten years have seen the annual population growth of the country rise to hit its peak in
the year 2008. The rate of 2.2% recorded was the highest which has ever been reached in the
state. The subsequent years saw the area dropping to 1.8% in 2009, 1.45 in 2010 only to rise a
bit to 1.8% in 2012. As at the end of 2015 it stood at 1.4% (Australian Bureau of Statistics,
2012).
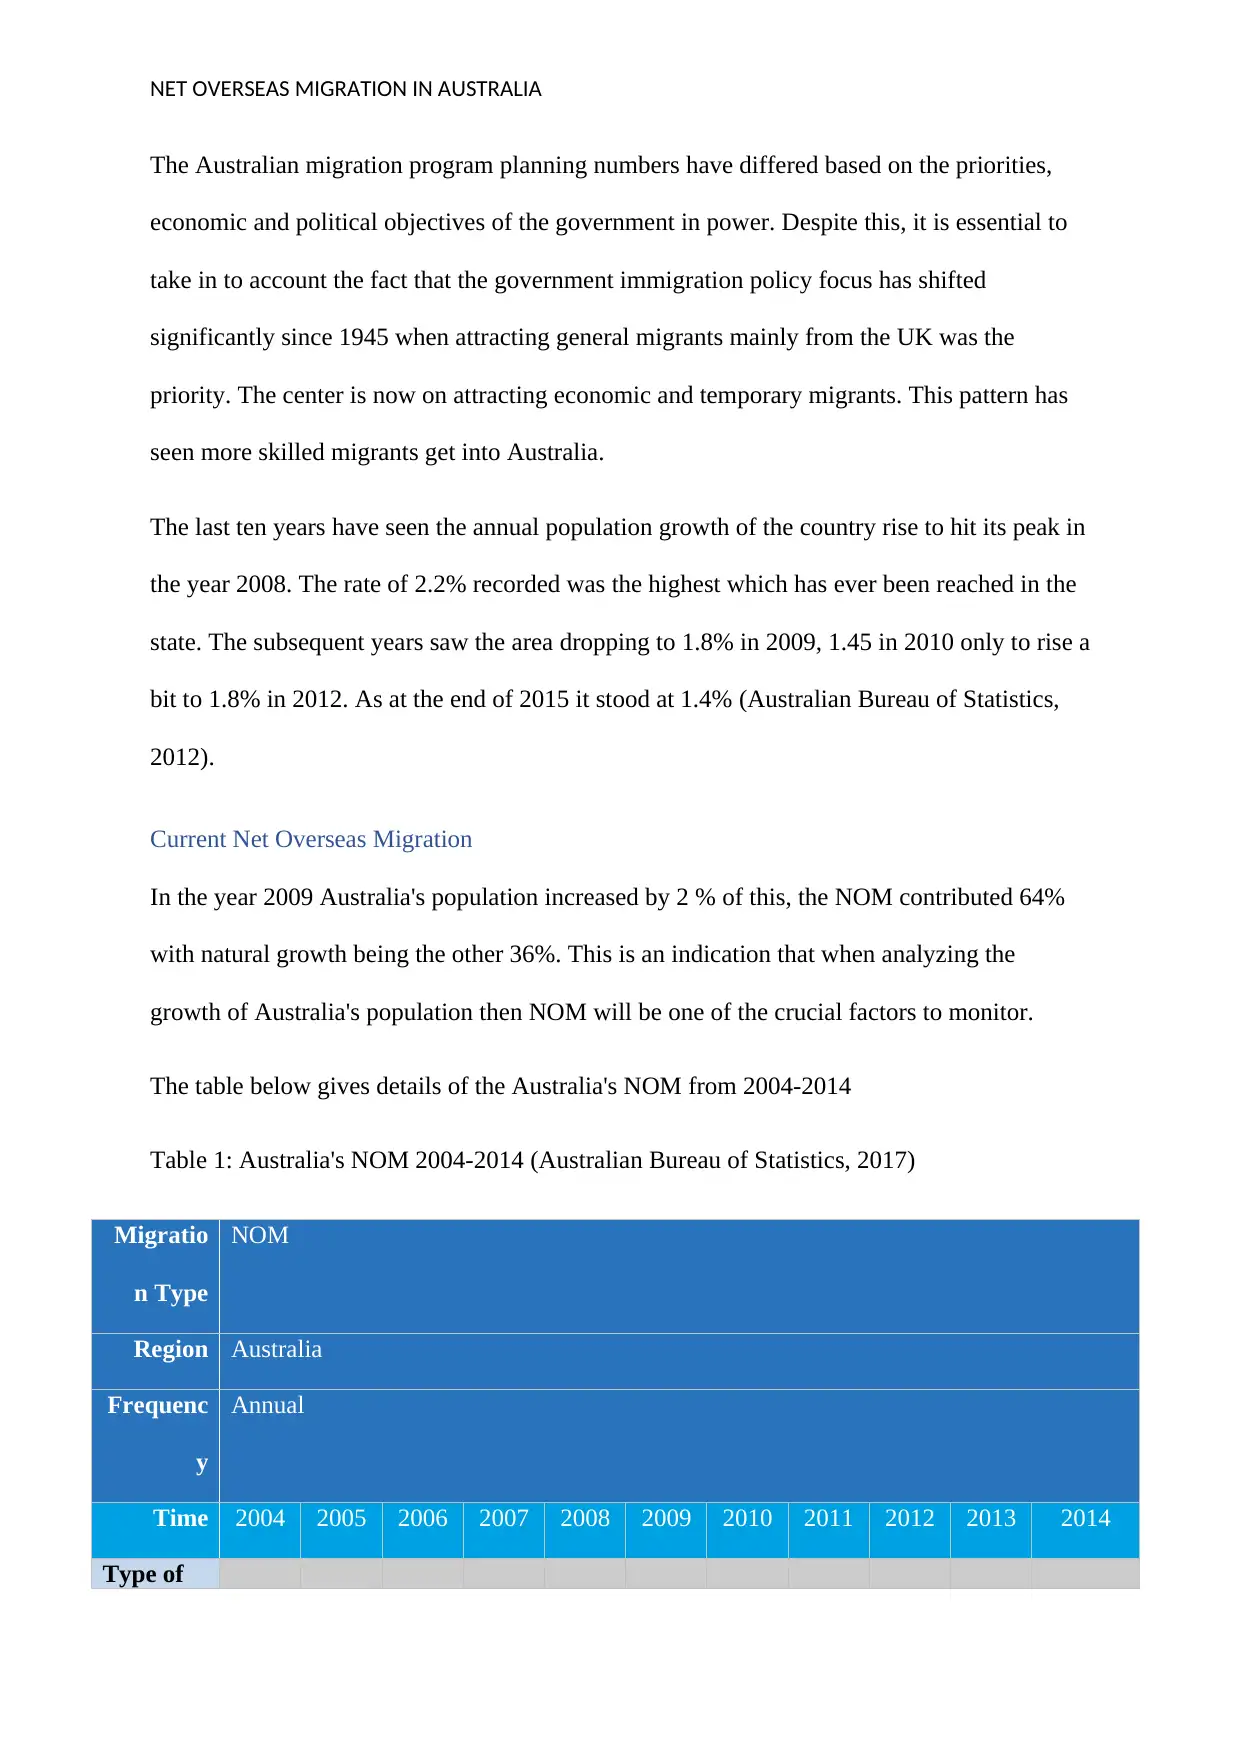
Current Net Overseas Migration
In the year 2009 Australia's population increased by 2 % of this, the NOM contributed 64%
with natural growth being the other 36%. This is an indication that when analyzing the
growth of Australia's population then NOM will be one of the crucial factors to monitor.
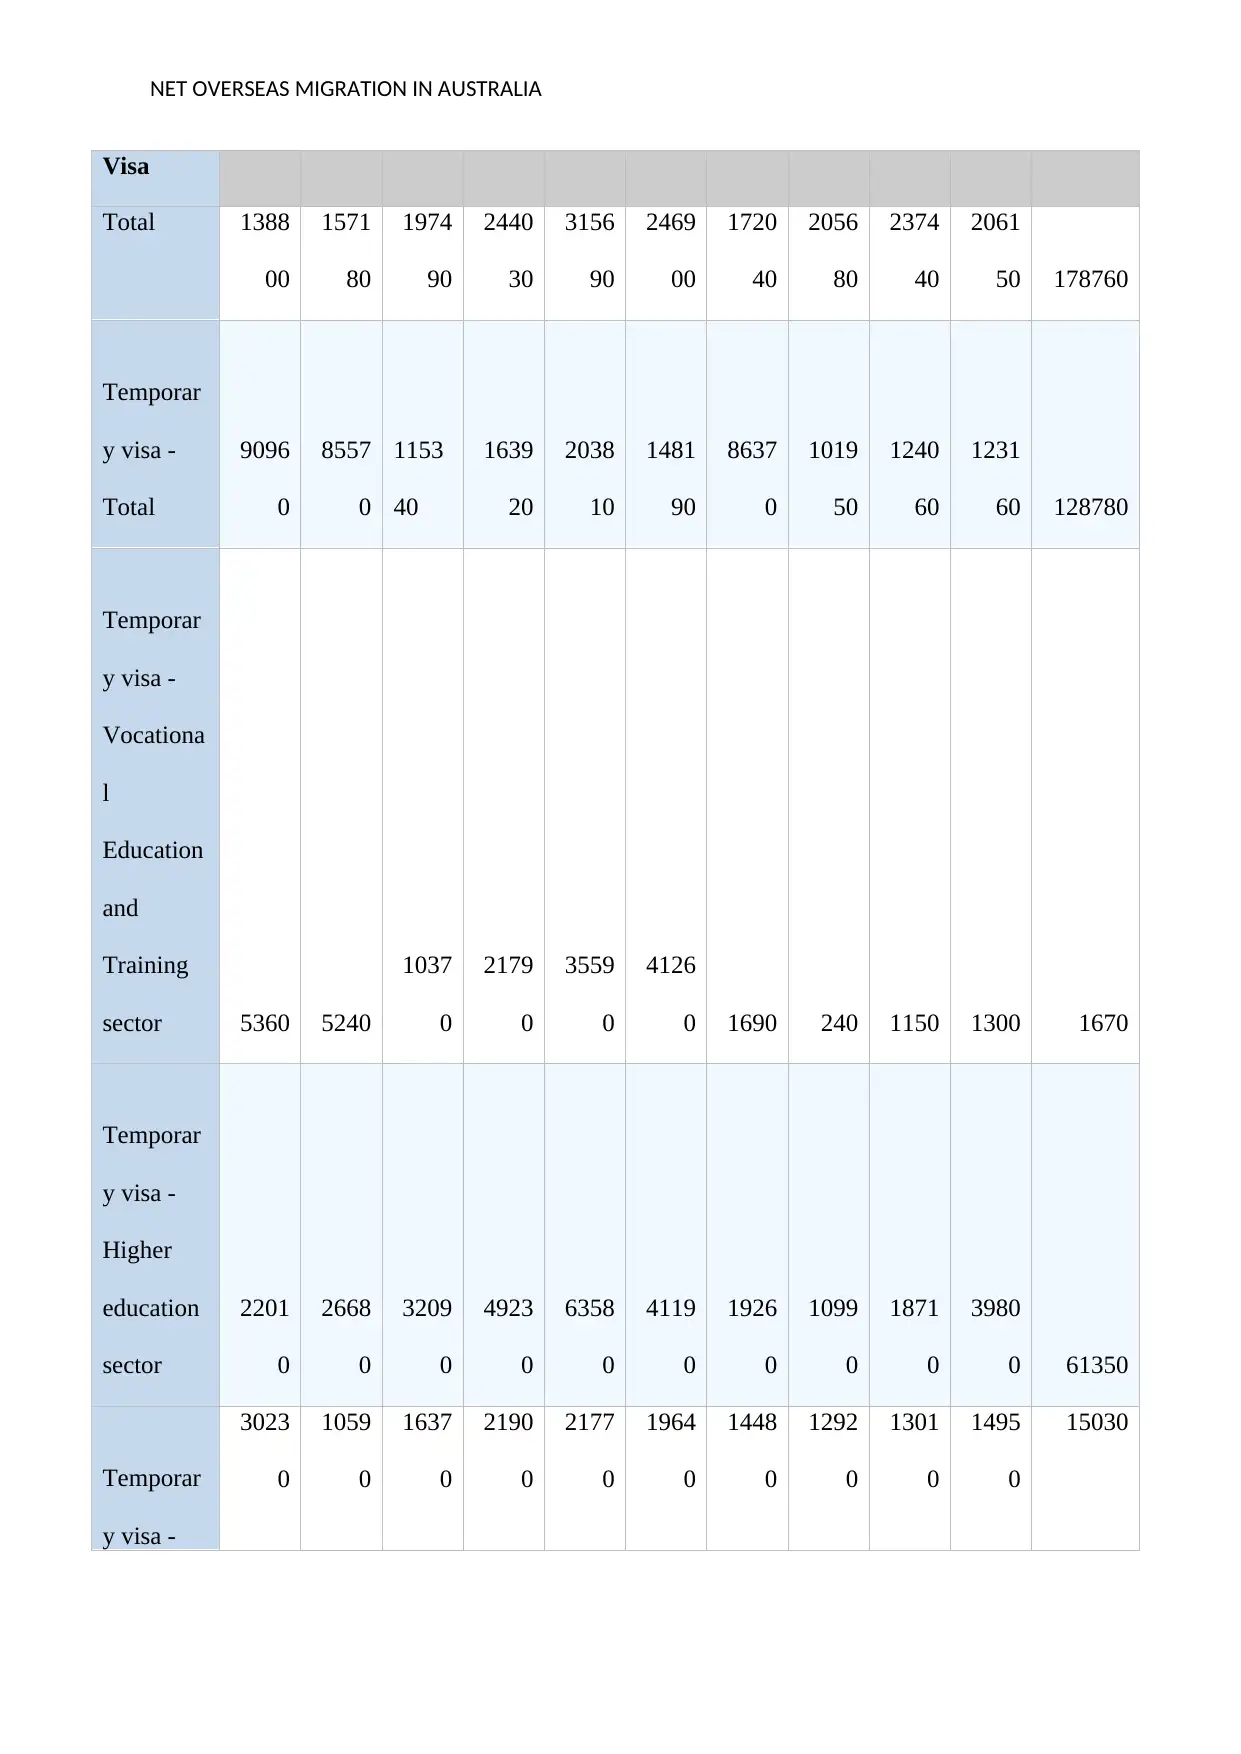
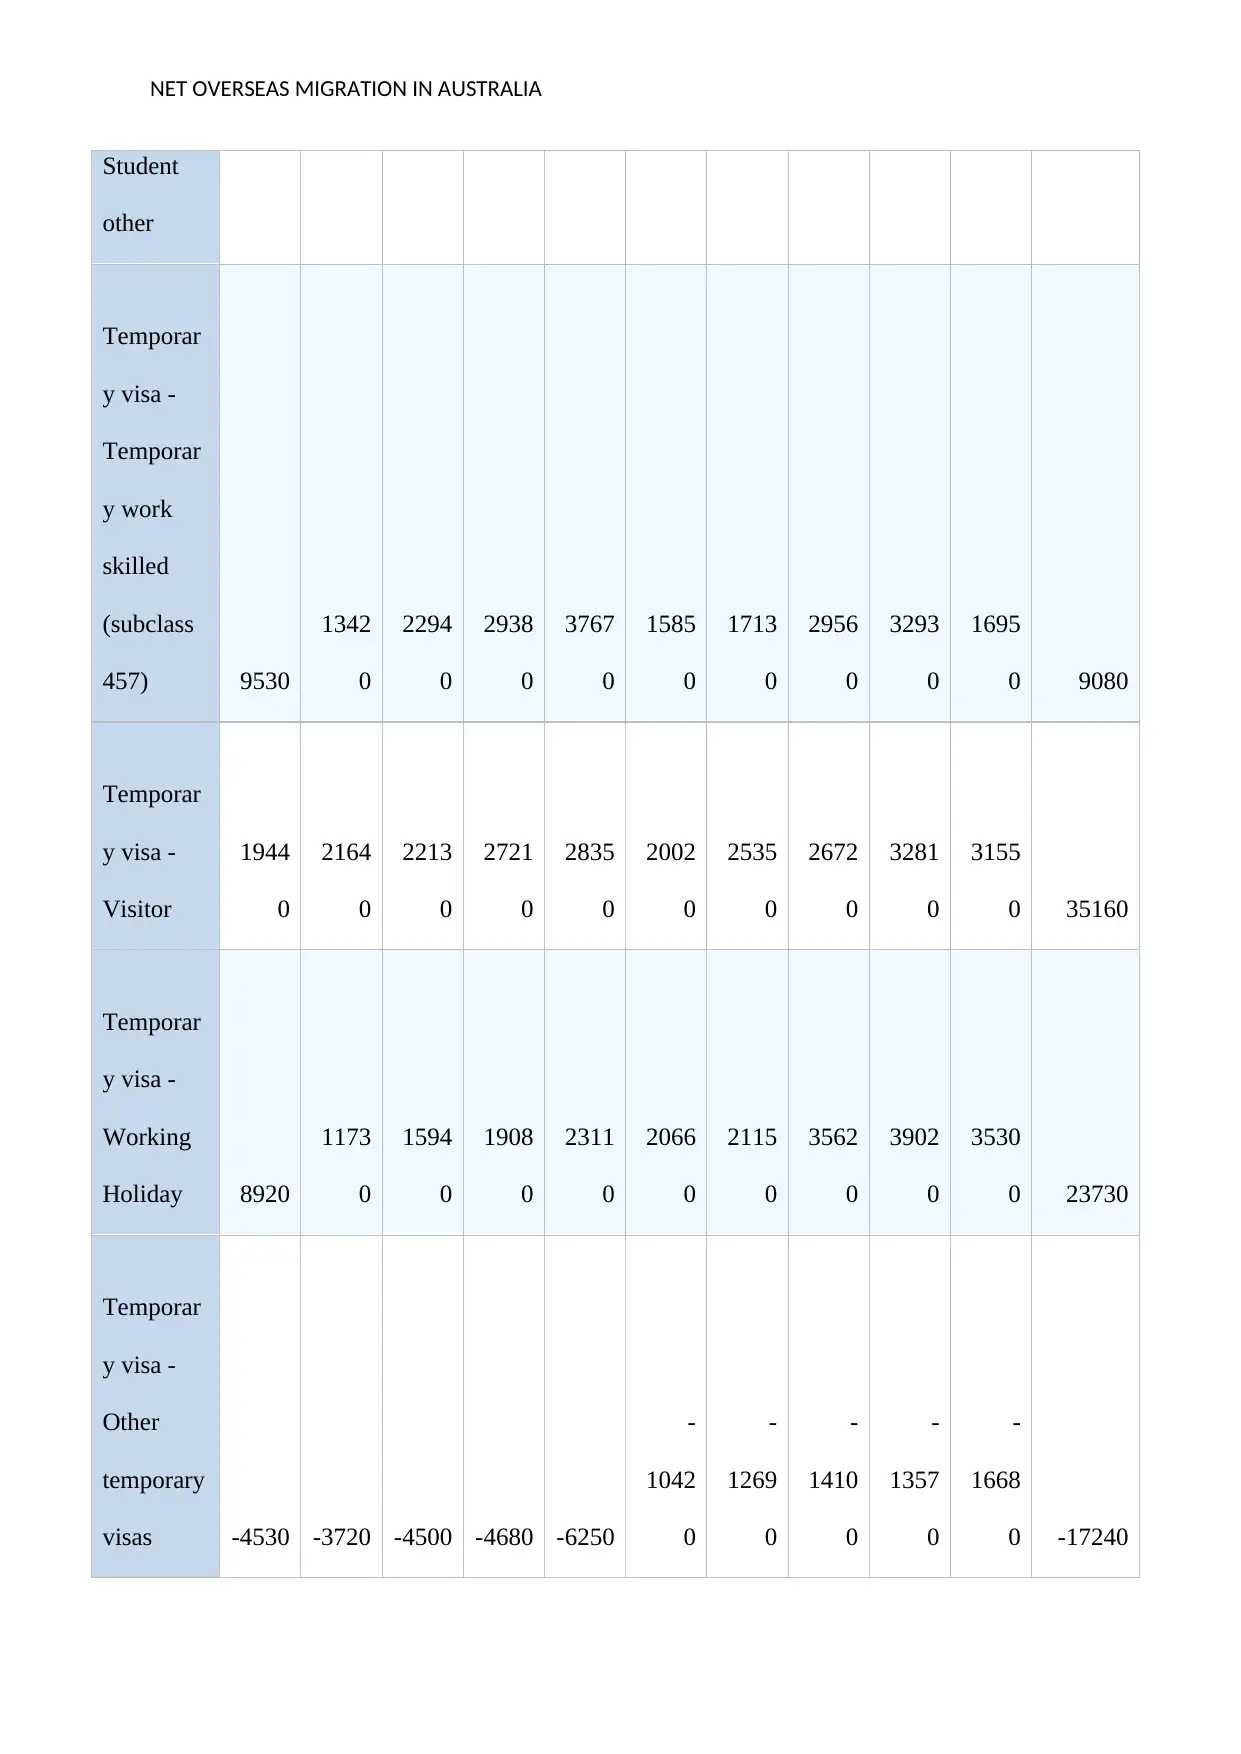
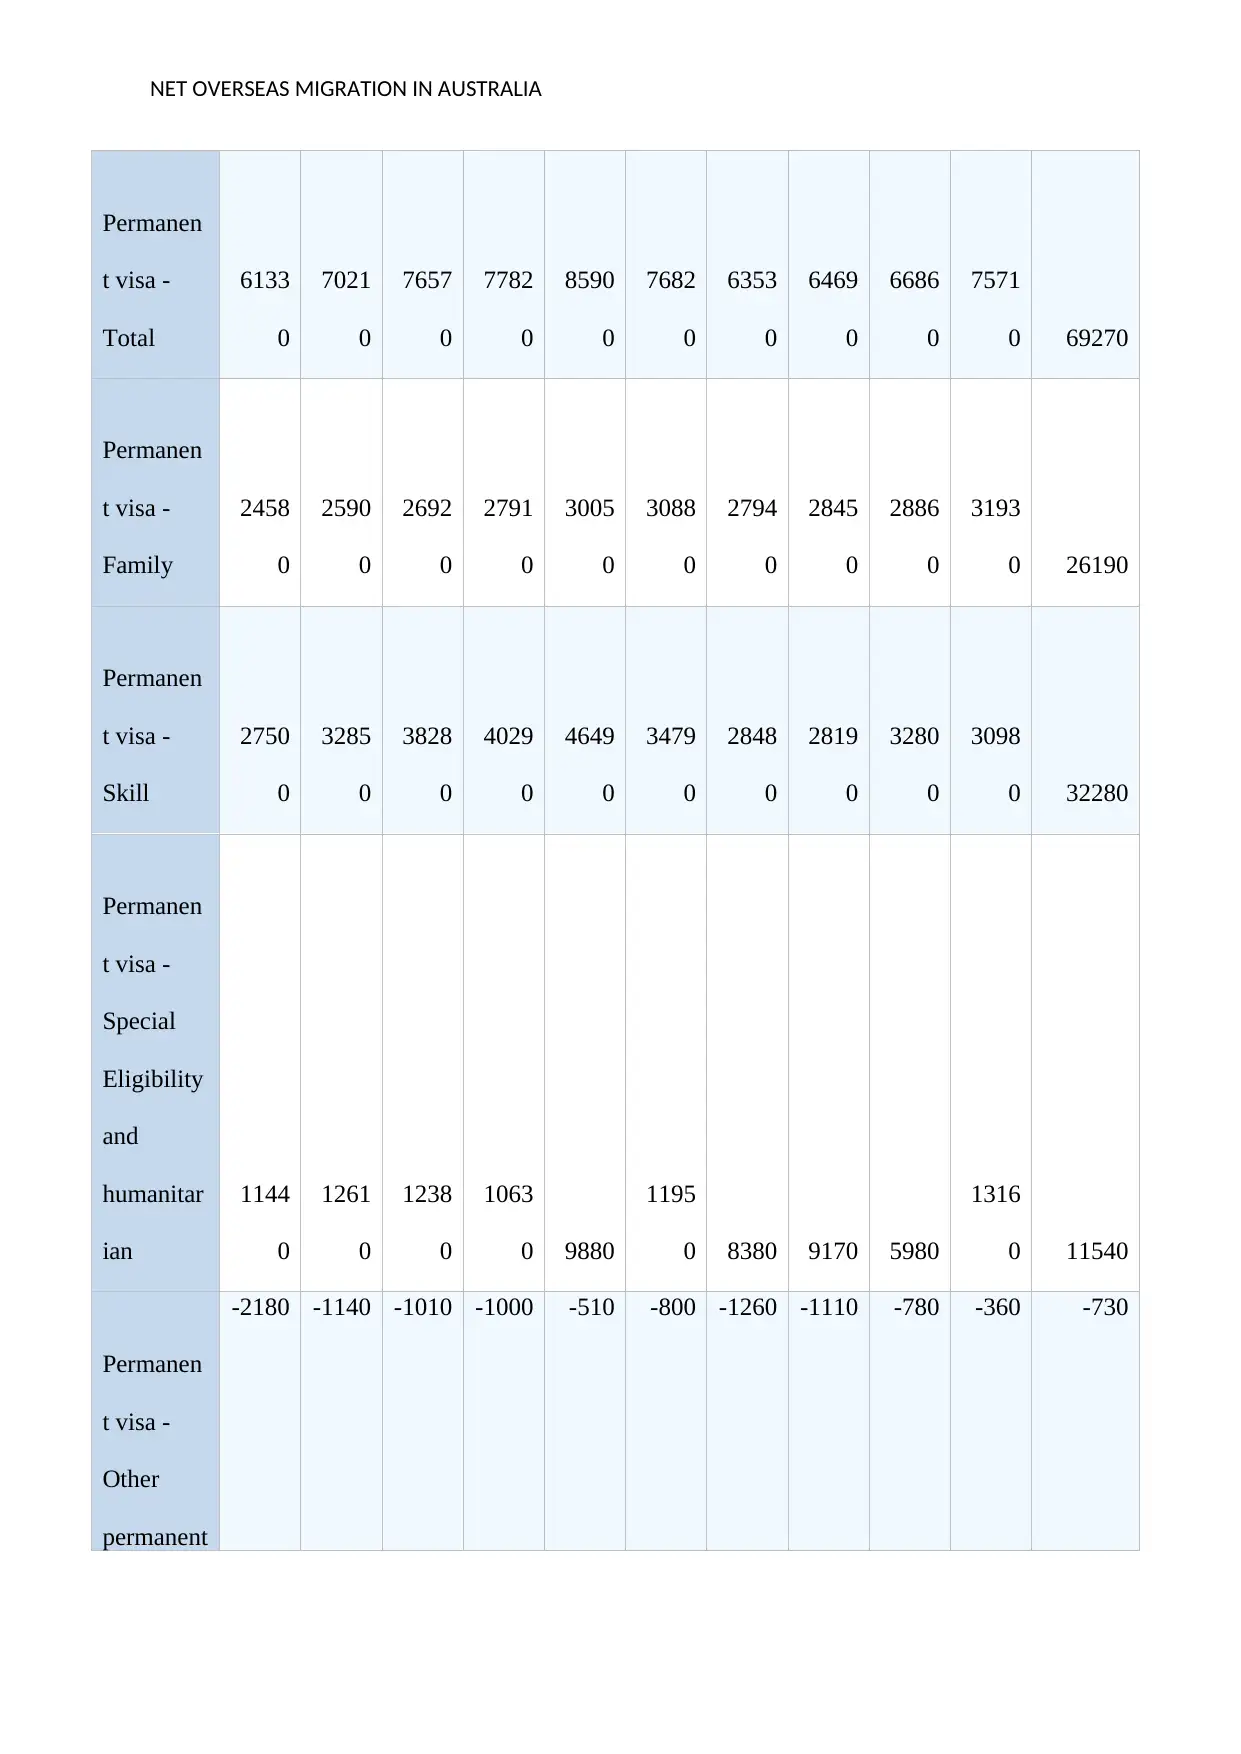
The table below gives details of the Australia's NOM from 2004-2014
Table 1: Australia's NOM 2004-2014 (Australian Bureau of Statistics, 2017)
Migratio
n Type
NOM
Region Australia
Frequenc
y
Annual
Time 2004 2005 2006 2007 2008 2009 2010 2011 2012 2013 2014
Type of
The Australian migration program planning numbers have differed based on the priorities,
economic and political objectives of the government in power. Despite this, it is essential to
take in to account the fact that the government immigration policy focus has shifted
significantly since 1945 when attracting general migrants mainly from the UK was the
priority. The center is now on attracting economic and temporary migrants. This pattern has
seen more skilled migrants get into Australia.
The last ten years have seen the annual population growth of the country rise to hit its peak in
the year 2008. The rate of 2.2% recorded was the highest which has ever been reached in the
state. The subsequent years saw the area dropping to 1.8% in 2009, 1.45 in 2010 only to rise a
bit to 1.8% in 2012. As at the end of 2015 it stood at 1.4% (Australian Bureau of Statistics,
2012).
Current Net Overseas Migration
In the year 2009 Australia's population increased by 2 % of this, the NOM contributed 64%
with natural growth being the other 36%. This is an indication that when analyzing the
growth of Australia's population then NOM will be one of the crucial factors to monitor.
The table below gives details of the Australia's NOM from 2004-2014
Table 1: Australia's NOM 2004-2014 (Australian Bureau of Statistics, 2017)
Migratio
n Type
NOM
Region Australia
Frequenc
y
Annual
Time 2004 2005 2006 2007 2008 2009 2010 2011 2012 2013 2014
Type of
NET OVERSEAS MIGRATION IN AUSTRALIA
Visa
Total 1388
00
1571
80
1974
90
2440
30
3156
90
2469
00
1720
40
2056
80
2374
40
2061
50 178760
Temporar
y visa -
Total
9096
0
8557
0
1153
40
1639
20
2038
10
1481
90
8637
0
1019
50
1240
60
1231
60 128780
Temporar
y visa -
Vocationa
l
Education
and
Training
sector 5360 5240
1037
0
2179
0
3559
0
4126
0 1690 240 1150 1300 1670
Temporar
y visa -
Higher
education
sector
2201
0
2668
0
3209
0
4923
0
6358
0
4119
0
1926
0
1099
0
1871
0
3980
0 61350
Temporar
y visa -
3023
0
1059
0
1637
0
2190
0
2177
0
1964
0
1448
0
1292
0
1301
0
1495
0
15030
⊘ This is a preview!⊘
Do you want full access?
Subscribe today to unlock all pages.
Trusted by 1+ million students worldwide
NET OVERSEAS MIGRATION IN AUSTRALIA
Student
other
Temporar
y visa -
Temporar
y work
skilled
(subclass
457) 9530
1342
0
2294
0
2938
0
3767
0
1585
0
1713
0
2956
0
3293
0
1695
0 9080
Temporar
y visa -
Visitor
1944
0
2164
0
2213
0
2721
0
2835
0
2002
0
2535
0
2672
0
3281
0
3155
0 35160
Temporar
y visa -
Working
Holiday 8920
1173
0
1594
0
1908
0
2311
0
2066
0
2115
0
3562
0
3902
0
3530
0 23730
Temporar
y visa -
Other
temporary
visas -4530 -3720 -4500 -4680 -6250
-
1042
0
-
1269
0
-
1410
0
-
1357
0
-
1668
0 -17240
Paraphrase This Document
Need a fresh take? Get an instant paraphrase of this document with our AI Paraphraser
NET OVERSEAS MIGRATION IN AUSTRALIA
Permanen
t visa -
Total
6133
0
7021
0
7657
0
7782
0
8590
0
7682
0
6353
0
6469
0
6686
0
7571
0 69270
Permanen
t visa -
Family
2458
0
2590
0
2692
0
2791
0
3005
0
3088
0
2794
0
2845
0
2886
0
3193
0 26190
Permanen
t visa -
Skill
2750
0
3285
0
3828
0
4029
0
4649
0
3479
0
2848
0
2819
0
3280
0
3098
0 32280
Permanen
t visa -
Special
Eligibility
and
humanitar
ian
1144
0
1261
0
1238
0
1063
0 9880
1195
0 8380 9170 5980
1316
0 11540
Permanen
t visa -
Other
permanent
-2180 -1140 -1010 -1000 -510 -800 -1260 -1110 -780 -360 -730
Permanen
t visa -
Total
6133
0
7021
0
7657
0
7782
0
8590
0
7682
0
6353
0
6469
0
6686
0
7571
0 69270
Permanen
t visa -
Family
2458
0
2590
0
2692
0
2791
0
3005
0
3088
0
2794
0
2845
0
2886
0
3193
0 26190
Permanen
t visa -
Skill
2750
0
3285
0
3828
0
4029
0
4649
0
3479
0
2848
0
2819
0
3280
0
3098
0 32280
Permanen
t visa -
Special
Eligibility
and
humanitar
ian
1144
0
1261
0
1238
0
1063
0 9880
1195
0 8380 9170 5980
1316
0 11540
Permanen
t visa -
Other
permanent
-2180 -1140 -1010 -1000 -510 -800 -1260 -1110 -780 -360 -730
NET OVERSEAS MIGRATION IN AUSTRALIA
visas
New
Zealand
Citizen
(subclass
444)
1803
0
2187
0
2514
0
3202
0
3803
0
2037
0
2717
0
4328
0
4184
0
2217
0 7040
Australian
Citizen
-
3042
0
-
1770
0
-
1579
0
-
2496
0
-
1033
0 -200 -8650 -8500 -6250
-
1317
0 -22530
Other
Visas -1090 -2750 -3770 -4750 -1720 1720 3630 4260
1094
0 -1710 -3780
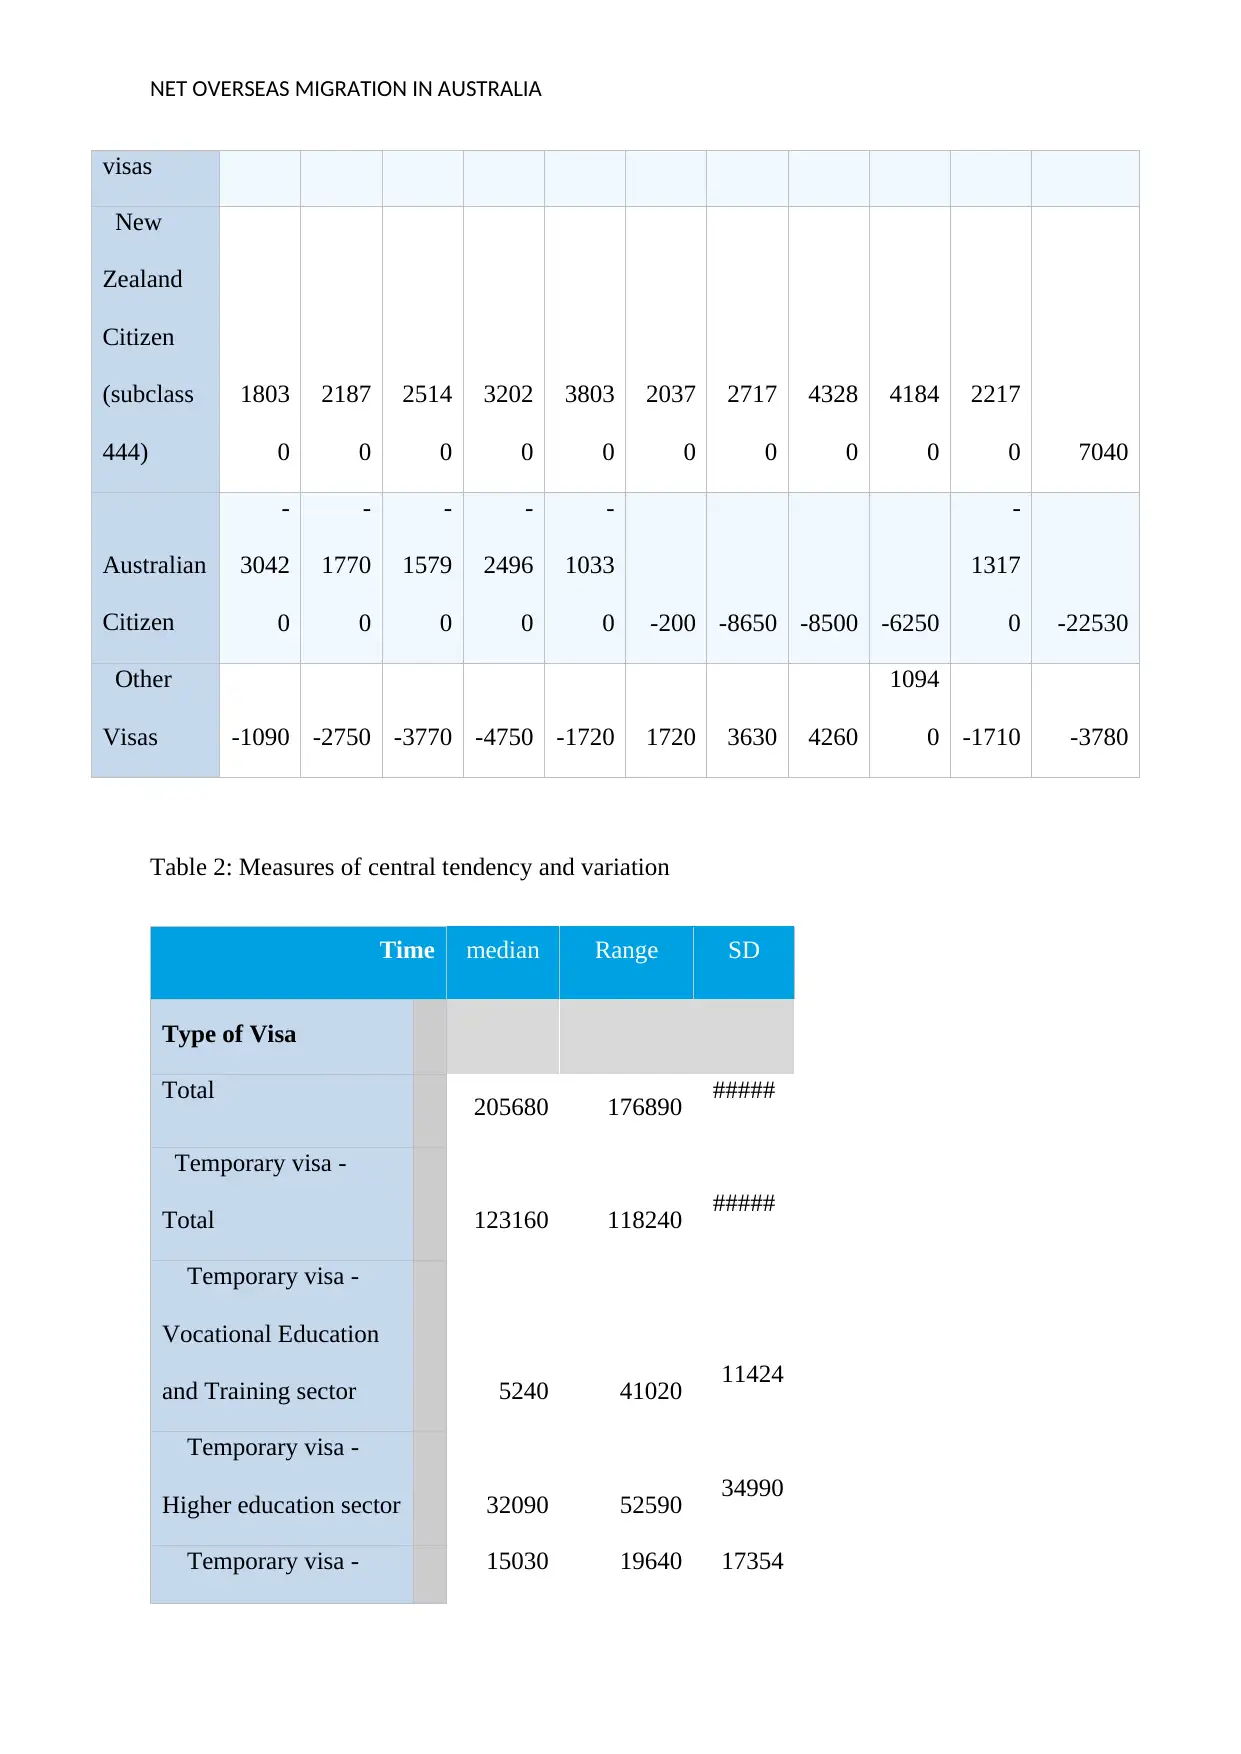
Table 2: Measures of central tendency and variation
Time median Range SD mean
Type of Visa
Total 205680 176890 #####
Temporary visa -
Total 123160 118240 #####
Temporary visa -
Vocational Education
and Training sector 5240 41020 11424
Temporary visa -
Higher education sector 32090 52590 34990
Temporary visa - 15030 19640 17354
visas
New
Zealand
Citizen
(subclass
444)
1803
0
2187
0
2514
0
3202
0
3803
0
2037
0
2717
0
4328
0
4184
0
2217
0 7040
Australian
Citizen
-
3042
0
-
1770
0
-
1579
0
-
2496
0
-
1033
0 -200 -8650 -8500 -6250
-
1317
0 -22530
Other
Visas -1090 -2750 -3770 -4750 -1720 1720 3630 4260
1094
0 -1710 -3780
Table 2: Measures of central tendency and variation
Time median Range SD mean
Type of Visa
Total 205680 176890 #####
Temporary visa -
Total 123160 118240 #####
Temporary visa -
Vocational Education
and Training sector 5240 41020 11424
Temporary visa -
Higher education sector 32090 52590 34990
Temporary visa - 15030 19640 17354
⊘ This is a preview!⊘
Do you want full access?
Subscribe today to unlock all pages.
Trusted by 1+ million students worldwide
NET OVERSEAS MIGRATION IN AUSTRALIA
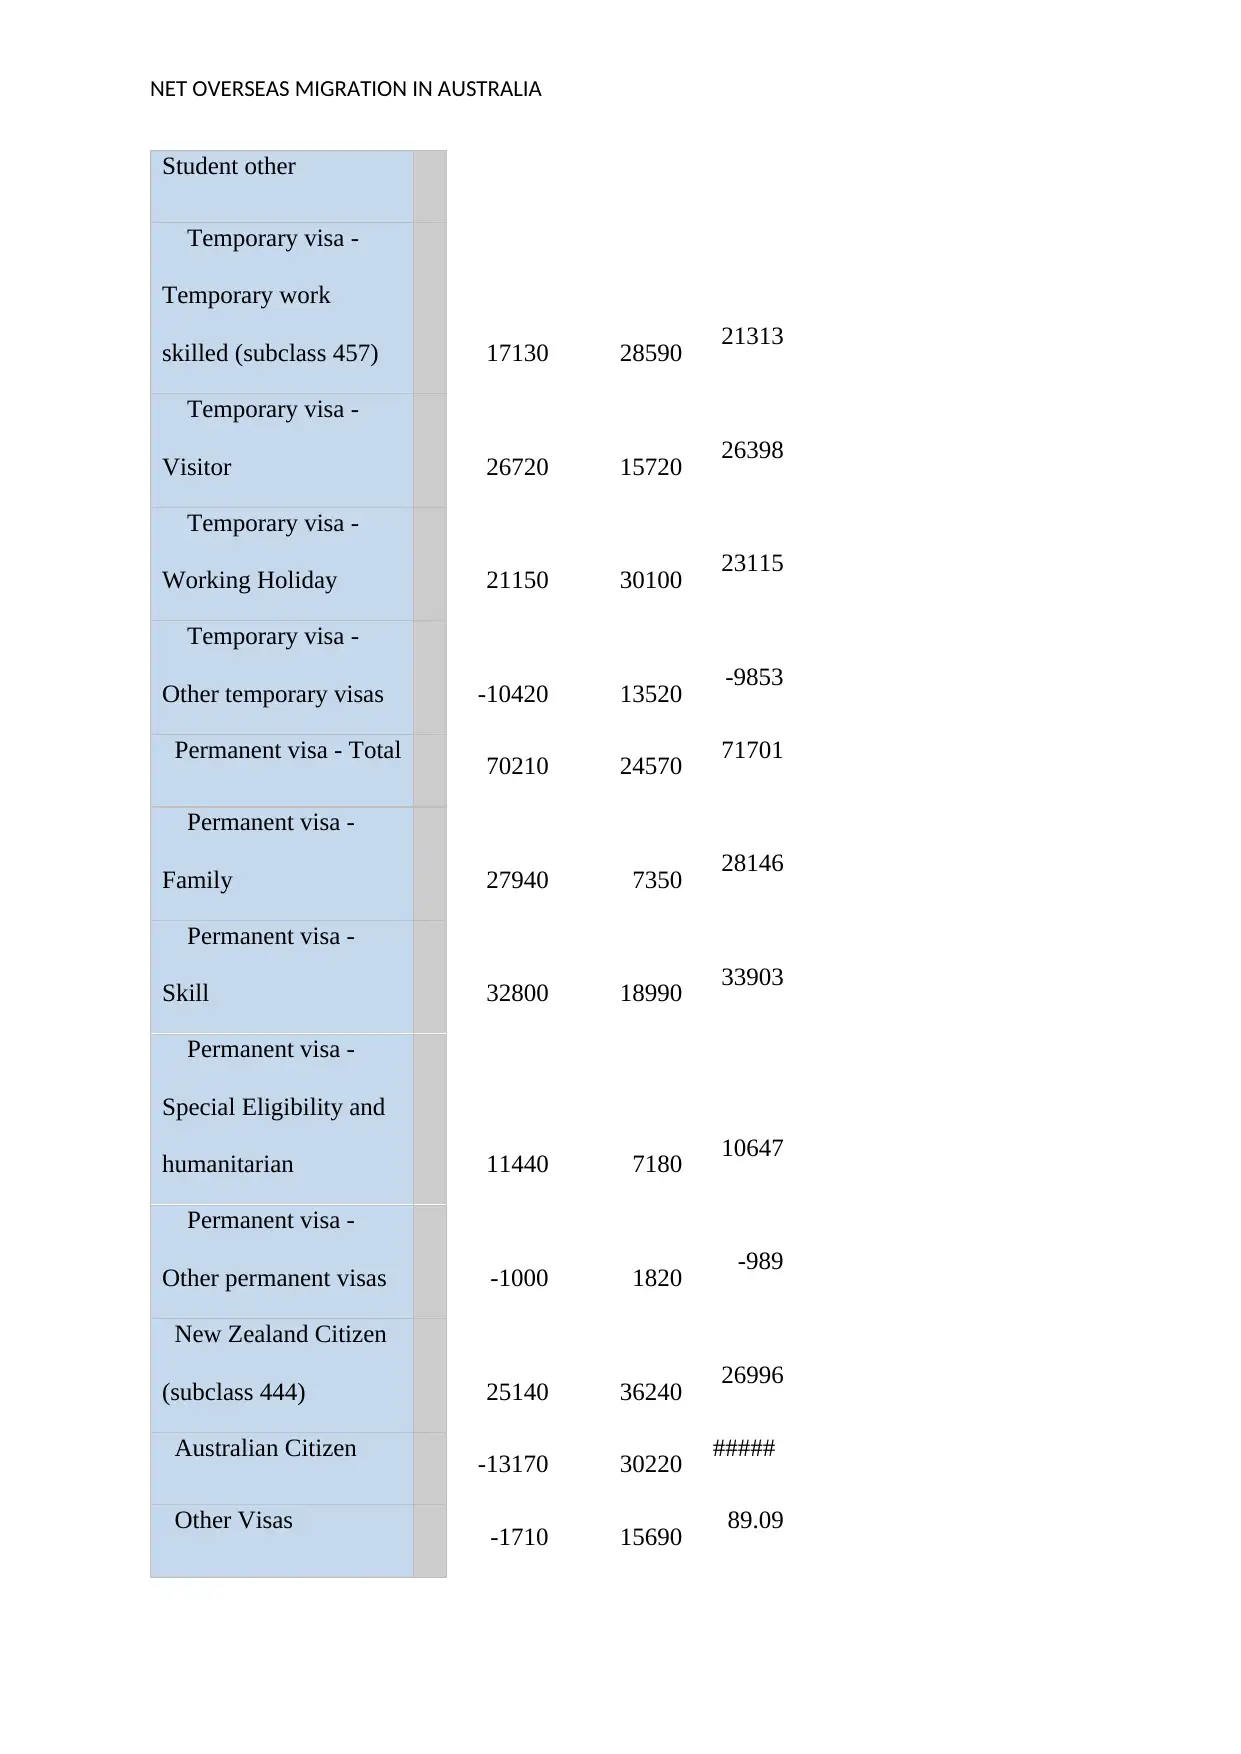
Student other
Temporary visa -
Temporary work
skilled (subclass 457) 17130 28590 21313
Temporary visa -
Visitor 26720 15720 26398
Temporary visa -
Working Holiday 21150 30100 23115
Temporary visa -
Other temporary visas -10420 13520 -9853
Permanent visa - Total 70210 24570 71701
Permanent visa -
Family 27940 7350 28146
Permanent visa -
Skill 32800 18990 33903
Permanent visa -
Special Eligibility and
humanitarian 11440 7180 10647
Permanent visa -
Other permanent visas -1000 1820 -989
New Zealand Citizen
(subclass 444) 25140 36240 26996
Australian Citizen -13170 30220 #####
Other Visas -1710 15690 89.09
Paraphrase This Document
Need a fresh take? Get an instant paraphrase of this document with our AI Paraphraser
NET OVERSEAS MIGRATION IN AUSTRALIA
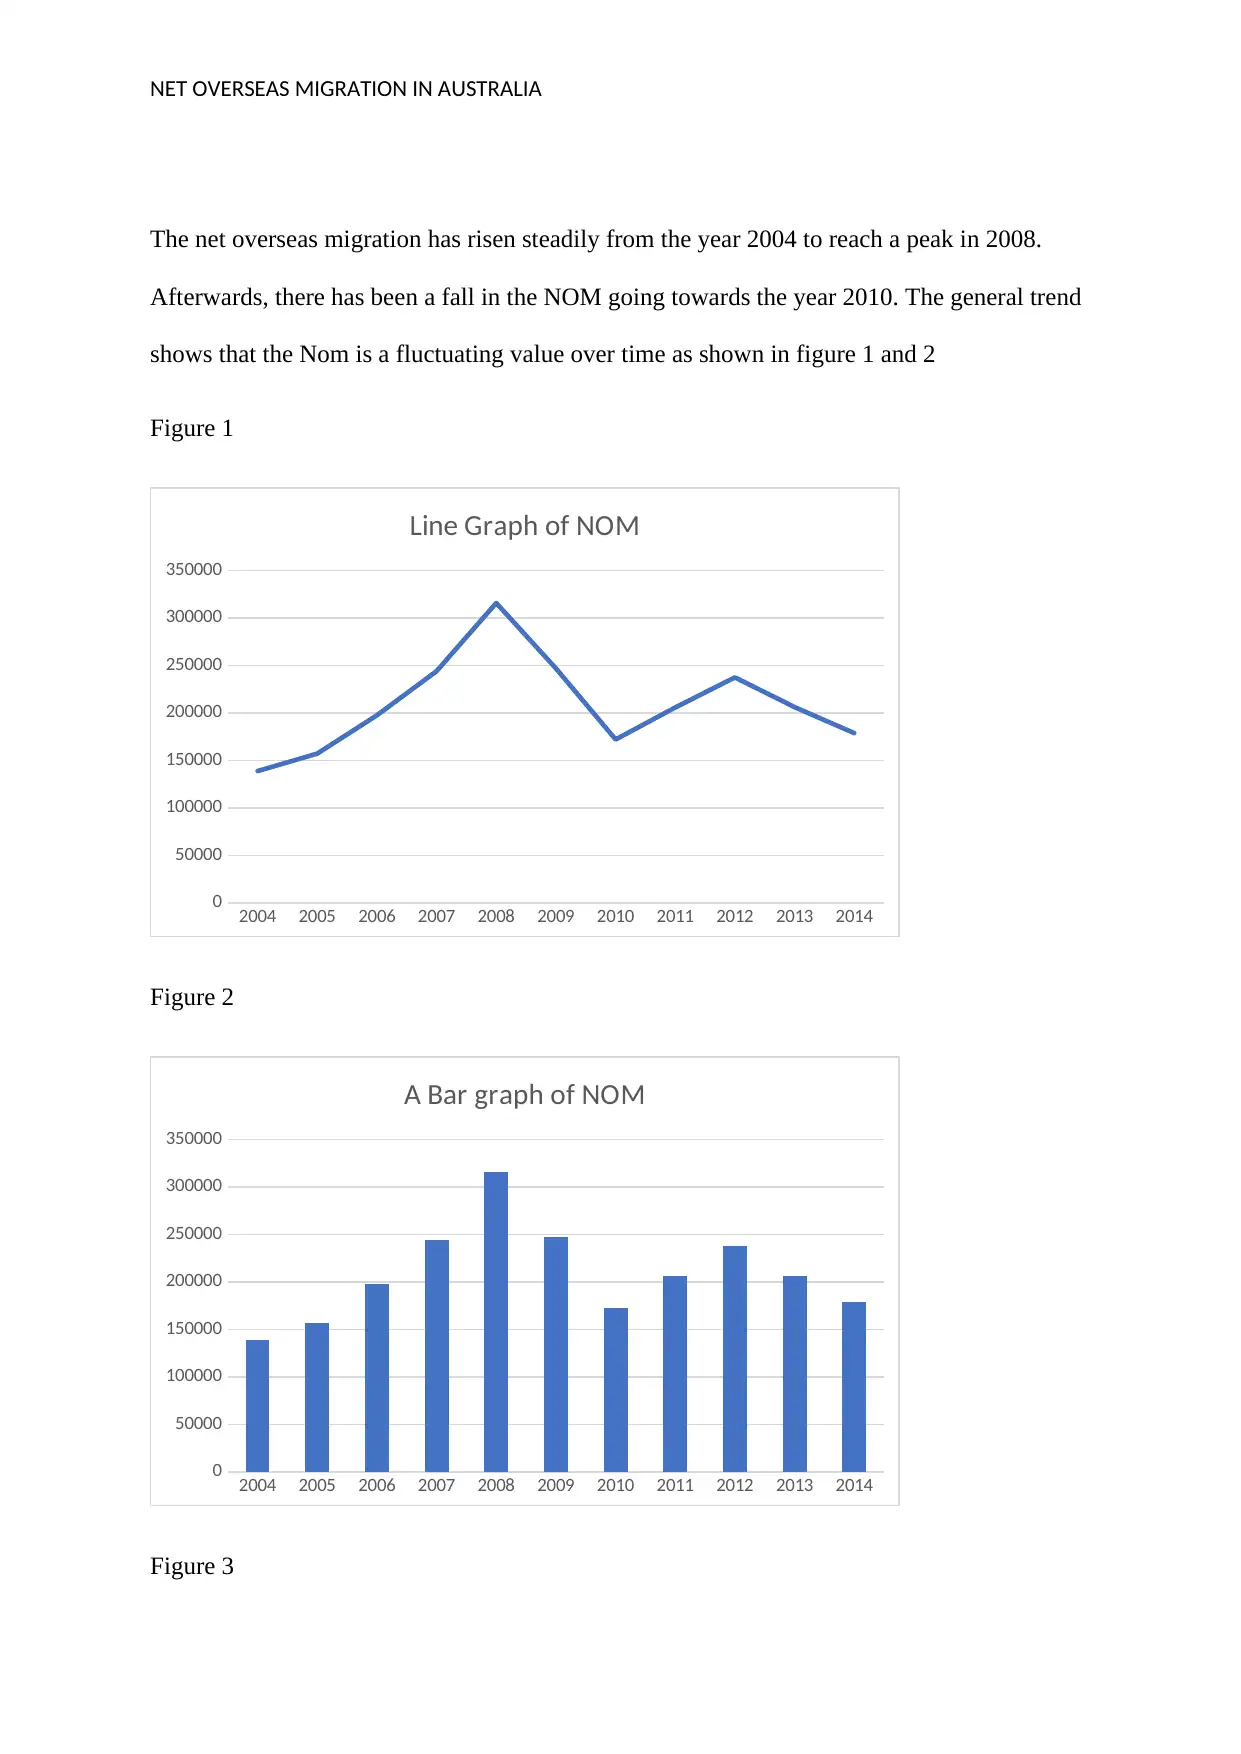
The net overseas migration has risen steadily from the year 2004 to reach a peak in 2008.
Afterwards, there has been a fall in the NOM going towards the year 2010. The general trend
shows that the Nom is a fluctuating value over time as shown in figure 1 and 2
Figure 1
2004 2005 2006 2007 2008 2009 2010 2011 2012 2013 2014
0
50000
100000
150000
200000
250000
300000
350000
Line Graph of NOM
Figure 2
2004 2005 2006 2007 2008 2009 2010 2011 2012 2013 2014
0
50000
100000
150000
200000
250000
300000
350000
A Bar graph of NOM
Figure 3
NET OVERSEAS MIGRATION IN AUSTRALIA
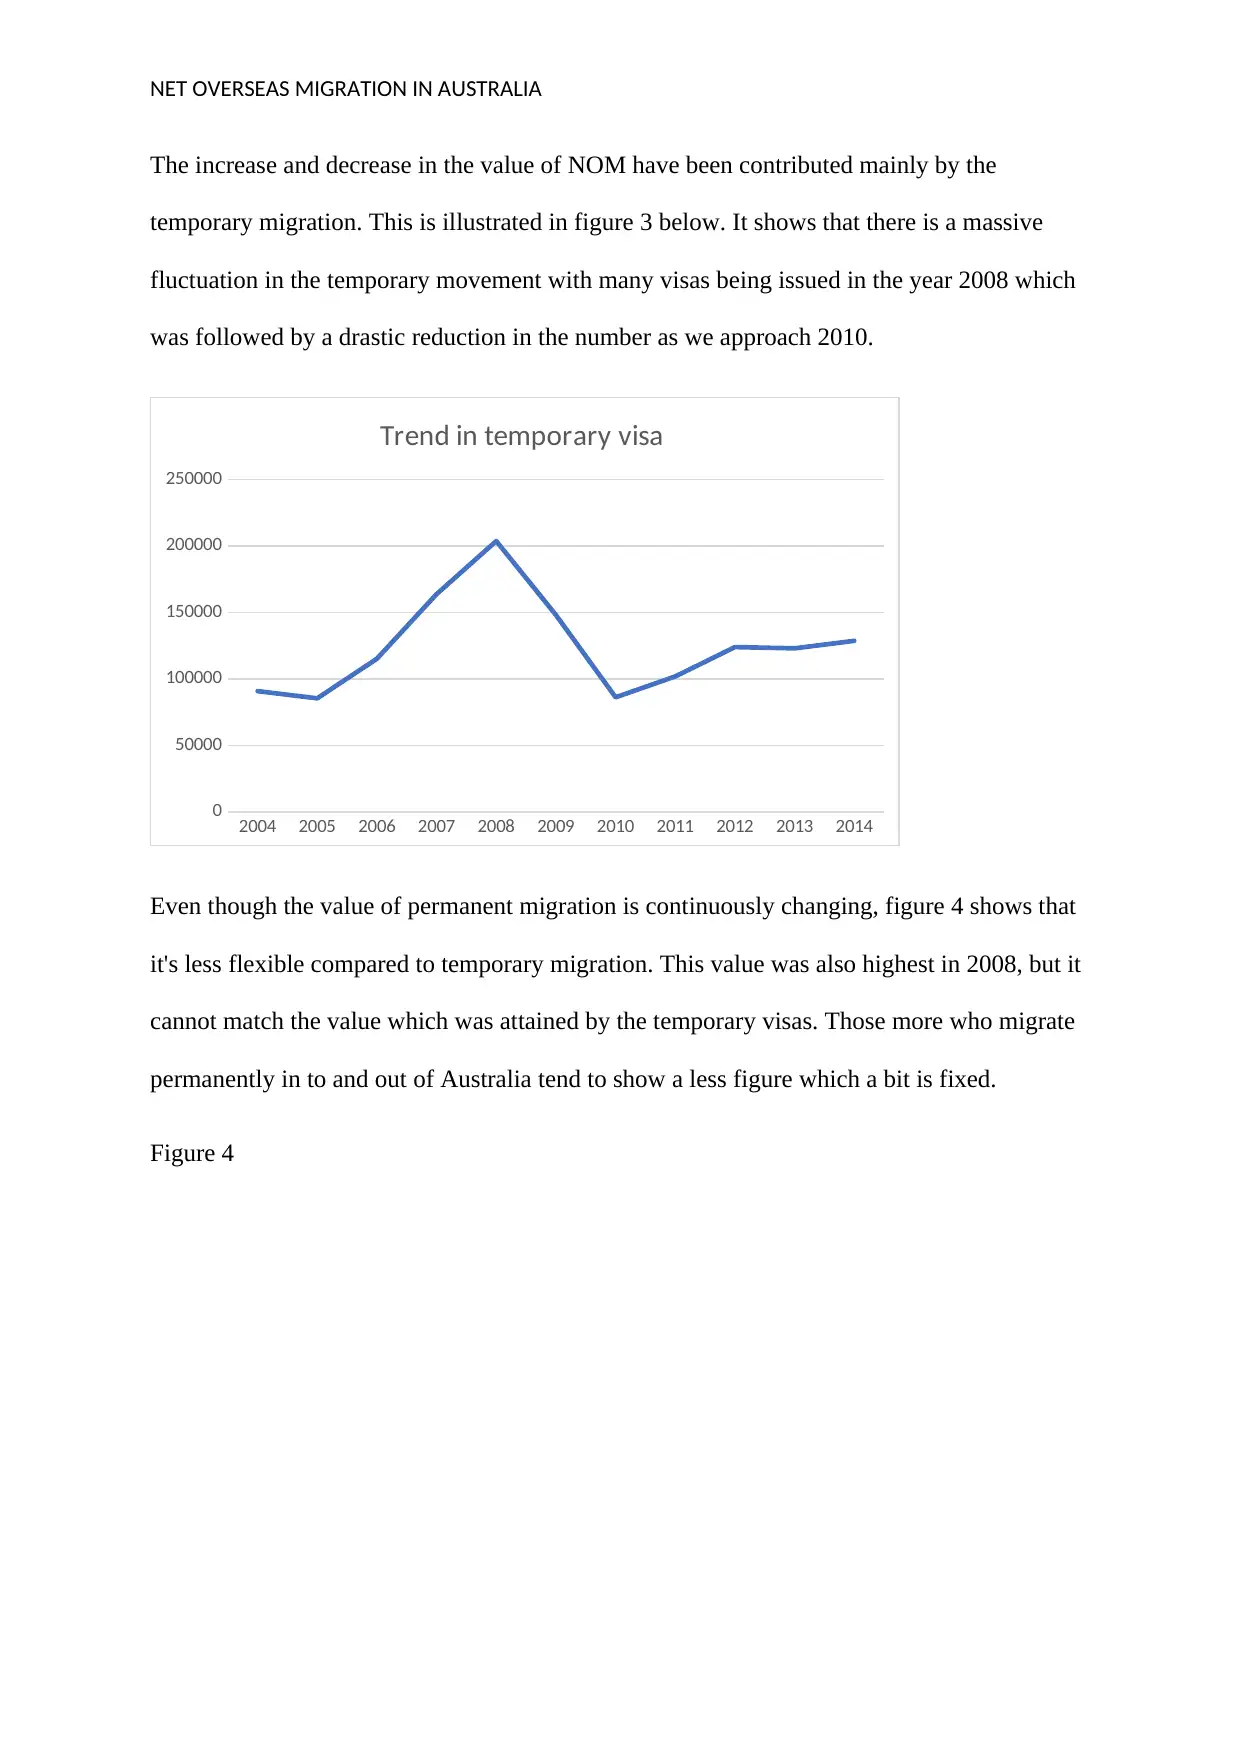
The increase and decrease in the value of NOM have been contributed mainly by the
temporary migration. This is illustrated in figure 3 below. It shows that there is a massive
fluctuation in the temporary movement with many visas being issued in the year 2008 which
was followed by a drastic reduction in the number as we approach 2010.
2004 2005 2006 2007 2008 2009 2010 2011 2012 2013 2014
0
50000
100000
150000
200000
250000
Trend in temporary visa
Even though the value of permanent migration is continuously changing, figure 4 shows that
it's less flexible compared to temporary migration. This value was also highest in 2008, but it
cannot match the value which was attained by the temporary visas. Those more who migrate
permanently in to and out of Australia tend to show a less figure which a bit is fixed.
Figure 4
⊘ This is a preview!⊘
Do you want full access?
Subscribe today to unlock all pages.
Trusted by 1+ million students worldwide
1 out of 20

Your All-in-One AI-Powered Toolkit for Academic Success.
+13062052269
info@desklib.com
Available 24*7 on WhatsApp / Email
![[object Object]](/_next/static/media/star-bottom.7253800d.svg)
Unlock your academic potential
Copyright © 2020–2026 A2Z Services. All Rights Reserved. Developed and managed by ZUCOL.