BUS700 Economics: Macroeconomic Evaluation of Australia and NZ
VerifiedAdded on 2023/06/07
|16
|3932
|350
Report
AI Summary
This report provides a comprehensive evaluation of the macroeconomic performance of Australia and New Zealand between 1995 and 2015, examining key indicators such as real GDP, inflation rates, unemployment rates, and interest rates. It analyzes the relationship between real GDP growth and inflation in both countries, noting Australia's generally inverse relationship and New Zealand's mix of positive and inverse correlations depending on economic factors. The report also compares unemployment rates, highlighting New Zealand's consistently lower figures, and discusses the relationship between the cash rate in Australia and the official cash rate in New Zealand. Ultimately, the analysis suggests that both countries have performed well economically, with Australia exhibiting stronger overall performance and both poised for future growth.
EVALUATION OF MACROECONOMIC PERFORMANCE OF AUSTRALIA AND NEW ZEALAND i
EVALUATION OF MACROECONOMIC PERFORMANCE OF AUSTRALIA AND NEW ZEALAND
Student Name
Institutional Affiliation
Facilitator
Course
Date
EVALUATION OF MACROECONOMIC PERFORMANCE OF AUSTRALIA AND NEW ZEALAND
Student Name
Institutional Affiliation
Facilitator
Course
Date
Paraphrase This Document
Need a fresh take? Get an instant paraphrase of this document with our AI Paraphraser
EVALUATION OF MACROECONOMIC PERFORMANCE OF AUSTRALIA AND NEW ZEALAND ii
Executive summary
The major economic goal of any nation is to improve its economic performance. A country’s
economic performance is reflected by its macroeconomic performance. Macroeconomic
performance indicates the performance of the economy as a whole. A country’s macro-economy
is measured by evaluating four major pillars which include the level of unemployment, the rates
of inflation, the balance of payments and the real gross domestic product (Halligan, 2013, p.17).
Interest rates may also be considered. A country is said to be undergoing economic growth if its
real gross domestic product improves with time, the level of employment is low, the balance of
payments is favorable (exports exceed the imports) and the rates of inflation are low (actually
less than two percent). Australia and New Zealand are both countries in the Asia Pacific region
and have been doing well in terms of economic performance. Considering the real gross
domestic product, Australia has been doing better than New Zealand. New Zealand has a lower
level of unemployment than Australia. New Zealand has higher interest rates compared to
Australia for the period 1995-2015. Comparing the inflation rates, Australia has a lower inflation
rates than New Zealand for the period 1995 to 2015. In a nutshell, Australia and New Zealand
have doing well in terms of economic performance with Australia doing much better and the two
countries are anticipated to do much better in future.
EVALUATION OF MACROECONOMIC PERFORMANCE OF AUSTRALIA AND NEW ZEALAND
iii
Contents
Executive summary....................................................................................................................................ii
Introduction.................................................................................................................................................1
Data Collection............................................................................................................................................2
Relation between both countries’ real GDP growth rates and Inflation Rates.............................................3
Relation between real GDP growth rates and Inflation Rates in Australia...............................................3
Relation between real GDP growth rates and Inflation Rates in New Zealand........................................5
Relationship between the unemployment rates in Australia and New Zealand............................................6
Relationship between the cash rate and the official cash rate......................................................................8
The macroeconomic outlook prediction of Australia and New Zealand....................................................10
Conclusion.................................................................................................................................................11
References.................................................................................................................................................11
⊘ This is a preview!⊘
Do you want full access?
Subscribe today to unlock all pages.
Trusted by 1+ million students worldwide
EVALUATION OF MACROECONOMIC PERFORMANCE OF AUSTRALIA AND NEW ZEALAND 1
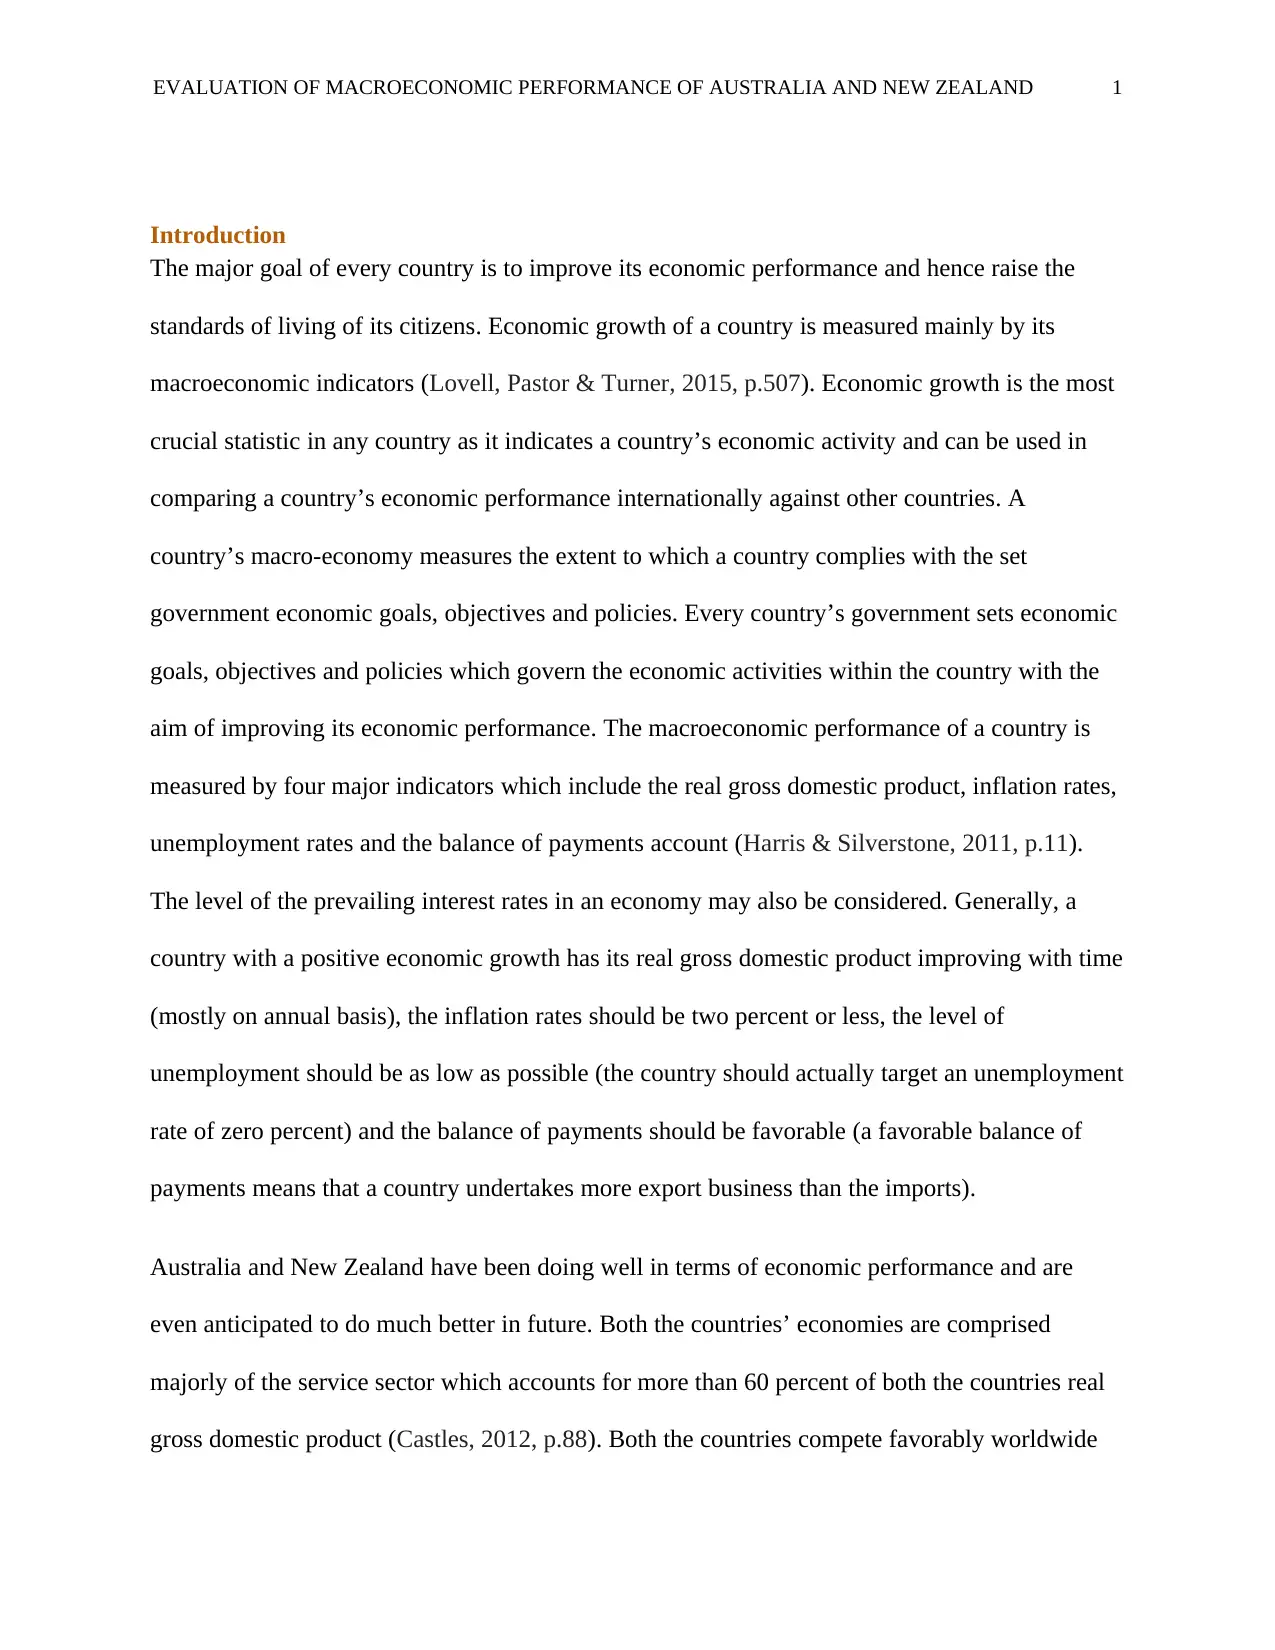
Introduction
The major goal of every country is to improve its economic performance and hence raise the
standards of living of its citizens. Economic growth of a country is measured mainly by its
macroeconomic indicators (Lovell, Pastor & Turner, 2015, p.507). Economic growth is the most
crucial statistic in any country as it indicates a country’s economic activity and can be used in
comparing a country’s economic performance internationally against other countries. A
country’s macro-economy measures the extent to which a country complies with the set
government economic goals, objectives and policies. Every country’s government sets economic
goals, objectives and policies which govern the economic activities within the country with the
aim of improving its economic performance. The macroeconomic performance of a country is
measured by four major indicators which include the real gross domestic product, inflation rates,
unemployment rates and the balance of payments account (Harris & Silverstone, 2011, p.11).
The level of the prevailing interest rates in an economy may also be considered. Generally, a
country with a positive economic growth has its real gross domestic product improving with time
(mostly on annual basis), the inflation rates should be two percent or less, the level of
unemployment should be as low as possible (the country should actually target an unemployment
rate of zero percent) and the balance of payments should be favorable (a favorable balance of
payments means that a country undertakes more export business than the imports).
Australia and New Zealand have been doing well in terms of economic performance and are
even anticipated to do much better in future. Both the countries’ economies are comprised
majorly of the service sector which accounts for more than 60 percent of both the countries real
gross domestic product (Castles, 2012, p.88). Both the countries compete favorably worldwide
Paraphrase This Document
Need a fresh take? Get an instant paraphrase of this document with our AI Paraphraser
EVALUATION OF MACROECONOMIC PERFORMANCE OF AUSTRALIA AND NEW ZEALAND 2
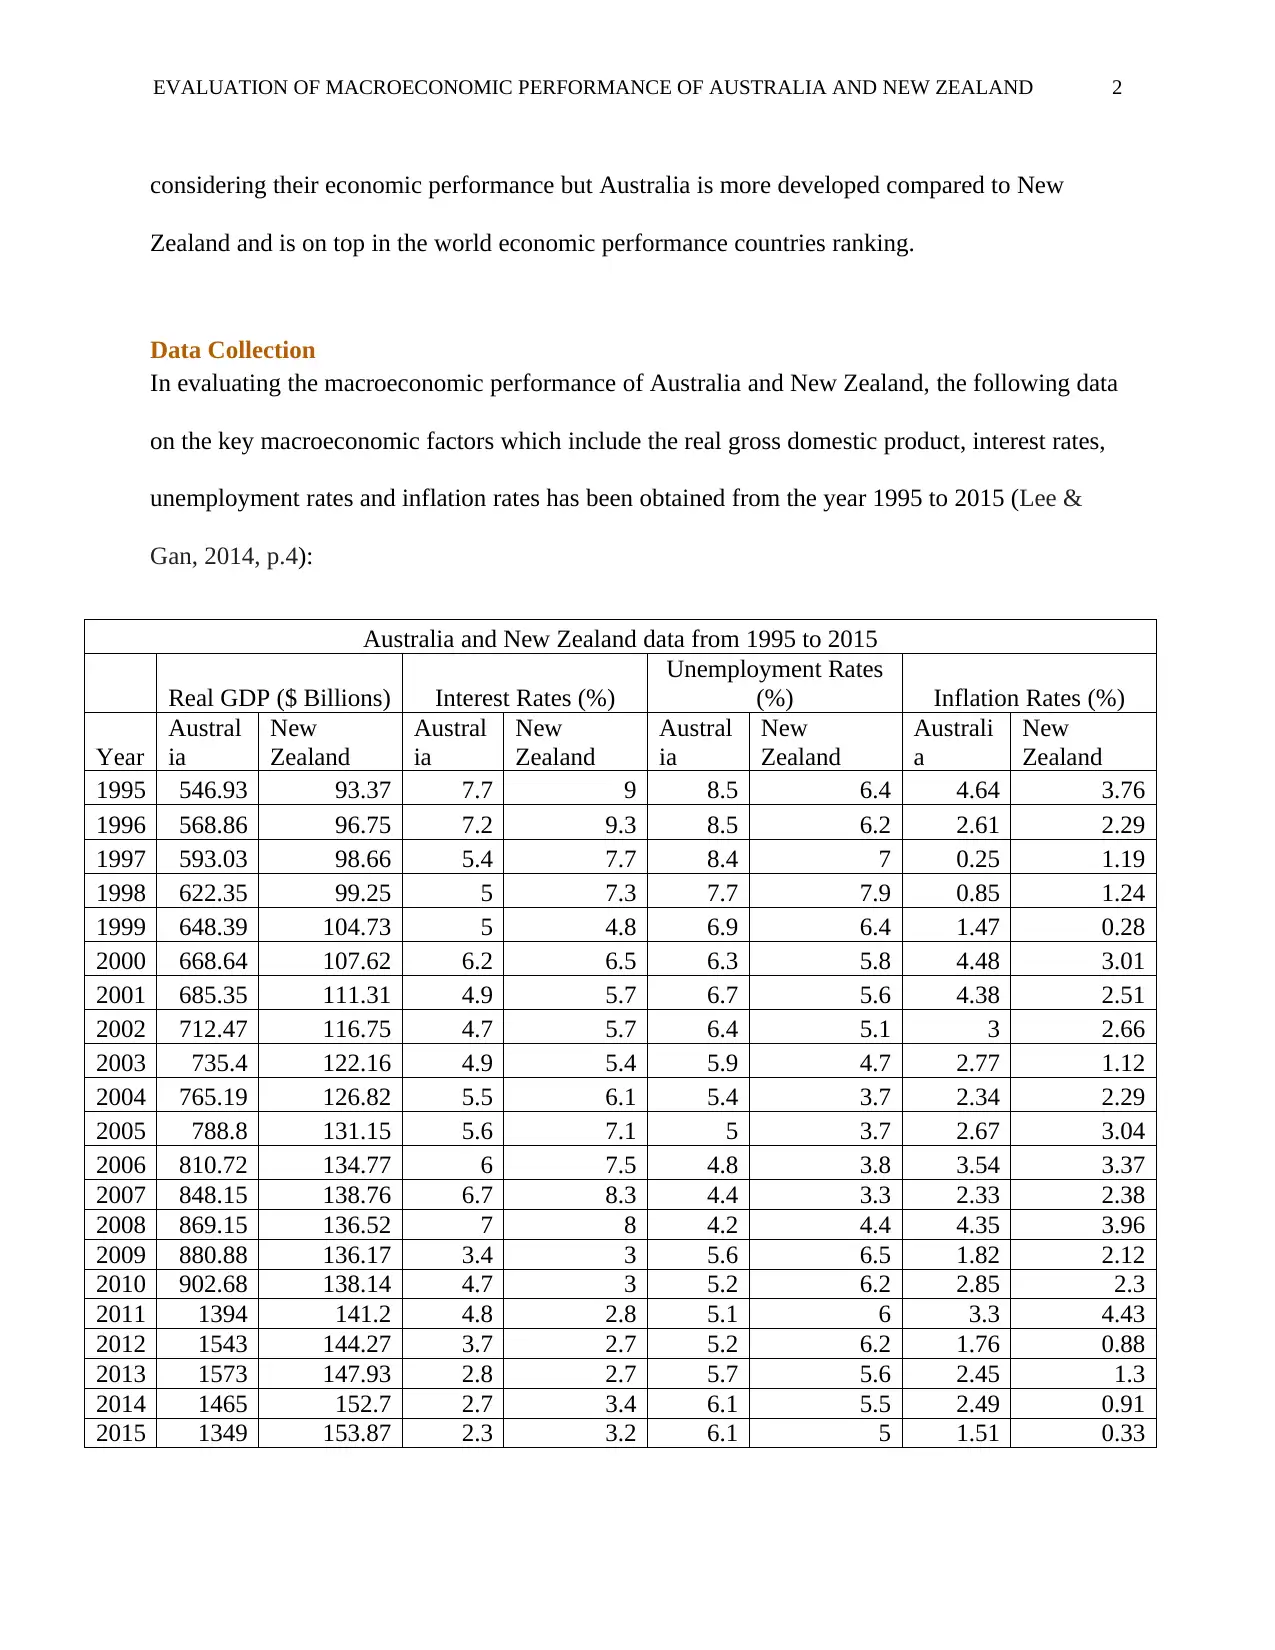
considering their economic performance but Australia is more developed compared to New
Zealand and is on top in the world economic performance countries ranking.
Data Collection
In evaluating the macroeconomic performance of Australia and New Zealand, the following data
on the key macroeconomic factors which include the real gross domestic product, interest rates,
unemployment rates and inflation rates has been obtained from the year 1995 to 2015 (Lee &
Gan, 2014, p.4):
Australia and New Zealand data from 1995 to 2015
Real GDP ($ Billions) Interest Rates (%)
Unemployment Rates
(%) Inflation Rates (%)
Year
Austral
ia
New
Zealand
Austral
ia
New
Zealand
Austral
ia
New
Zealand
Australi
a
New
Zealand
1995 546.93 93.37 7.7 9 8.5 6.4 4.64 3.76
1996 568.86 96.75 7.2 9.3 8.5 6.2 2.61 2.29
1997 593.03 98.66 5.4 7.7 8.4 7 0.25 1.19
1998 622.35 99.25 5 7.3 7.7 7.9 0.85 1.24
1999 648.39 104.73 5 4.8 6.9 6.4 1.47 0.28
2000 668.64 107.62 6.2 6.5 6.3 5.8 4.48 3.01
2001 685.35 111.31 4.9 5.7 6.7 5.6 4.38 2.51
2002 712.47 116.75 4.7 5.7 6.4 5.1 3 2.66
2003 735.4 122.16 4.9 5.4 5.9 4.7 2.77 1.12
2004 765.19 126.82 5.5 6.1 5.4 3.7 2.34 2.29
2005 788.8 131.15 5.6 7.1 5 3.7 2.67 3.04
2006 810.72 134.77 6 7.5 4.8 3.8 3.54 3.37
2007 848.15 138.76 6.7 8.3 4.4 3.3 2.33 2.38
2008 869.15 136.52 7 8 4.2 4.4 4.35 3.96
2009 880.88 136.17 3.4 3 5.6 6.5 1.82 2.12
2010 902.68 138.14 4.7 3 5.2 6.2 2.85 2.3
2011 1394 141.2 4.8 2.8 5.1 6 3.3 4.43
2012 1543 144.27 3.7 2.7 5.2 6.2 1.76 0.88
2013 1573 147.93 2.8 2.7 5.7 5.6 2.45 1.3
2014 1465 152.7 2.7 3.4 6.1 5.5 2.49 0.91
2015 1349 153.87 2.3 3.2 6.1 5 1.51 0.33
EVALUATION OF MACROECONOMIC PERFORMANCE OF AUSTRALIA AND NEW ZEALAND 3
Relation between both countries’ real GDP growth rates and Inflation Rates
The real gross domestic product of a country refers to the gross domestic product which has been
measured taking into consideration the prevailing inflation rates in a country. Inflation refers to a
situation whereby the general price of goods and services in a given country tend to increase
putting into consideration a specific period of time which most of the times is taken to be one
year (Scharpf & Schmidt, 2010, p.176). Considering various economic factors in a given
country, the real gross domestic product growth rates and inflation rates relationship can either
be positive, negative or neutral.
Relation between real GDP growth rates and Inflation Rates in Australia
Australia is among the richest nations in Asia Pacific region and also has a high economic
freedom. It has enjoyed almost more than a decade of economic growth after the 2009 great
recession (Shan, 2009, p.253). Due to its excellent economic performance, it has continued to
attract investors. This has enabled it to improve and maintain its economic performance.
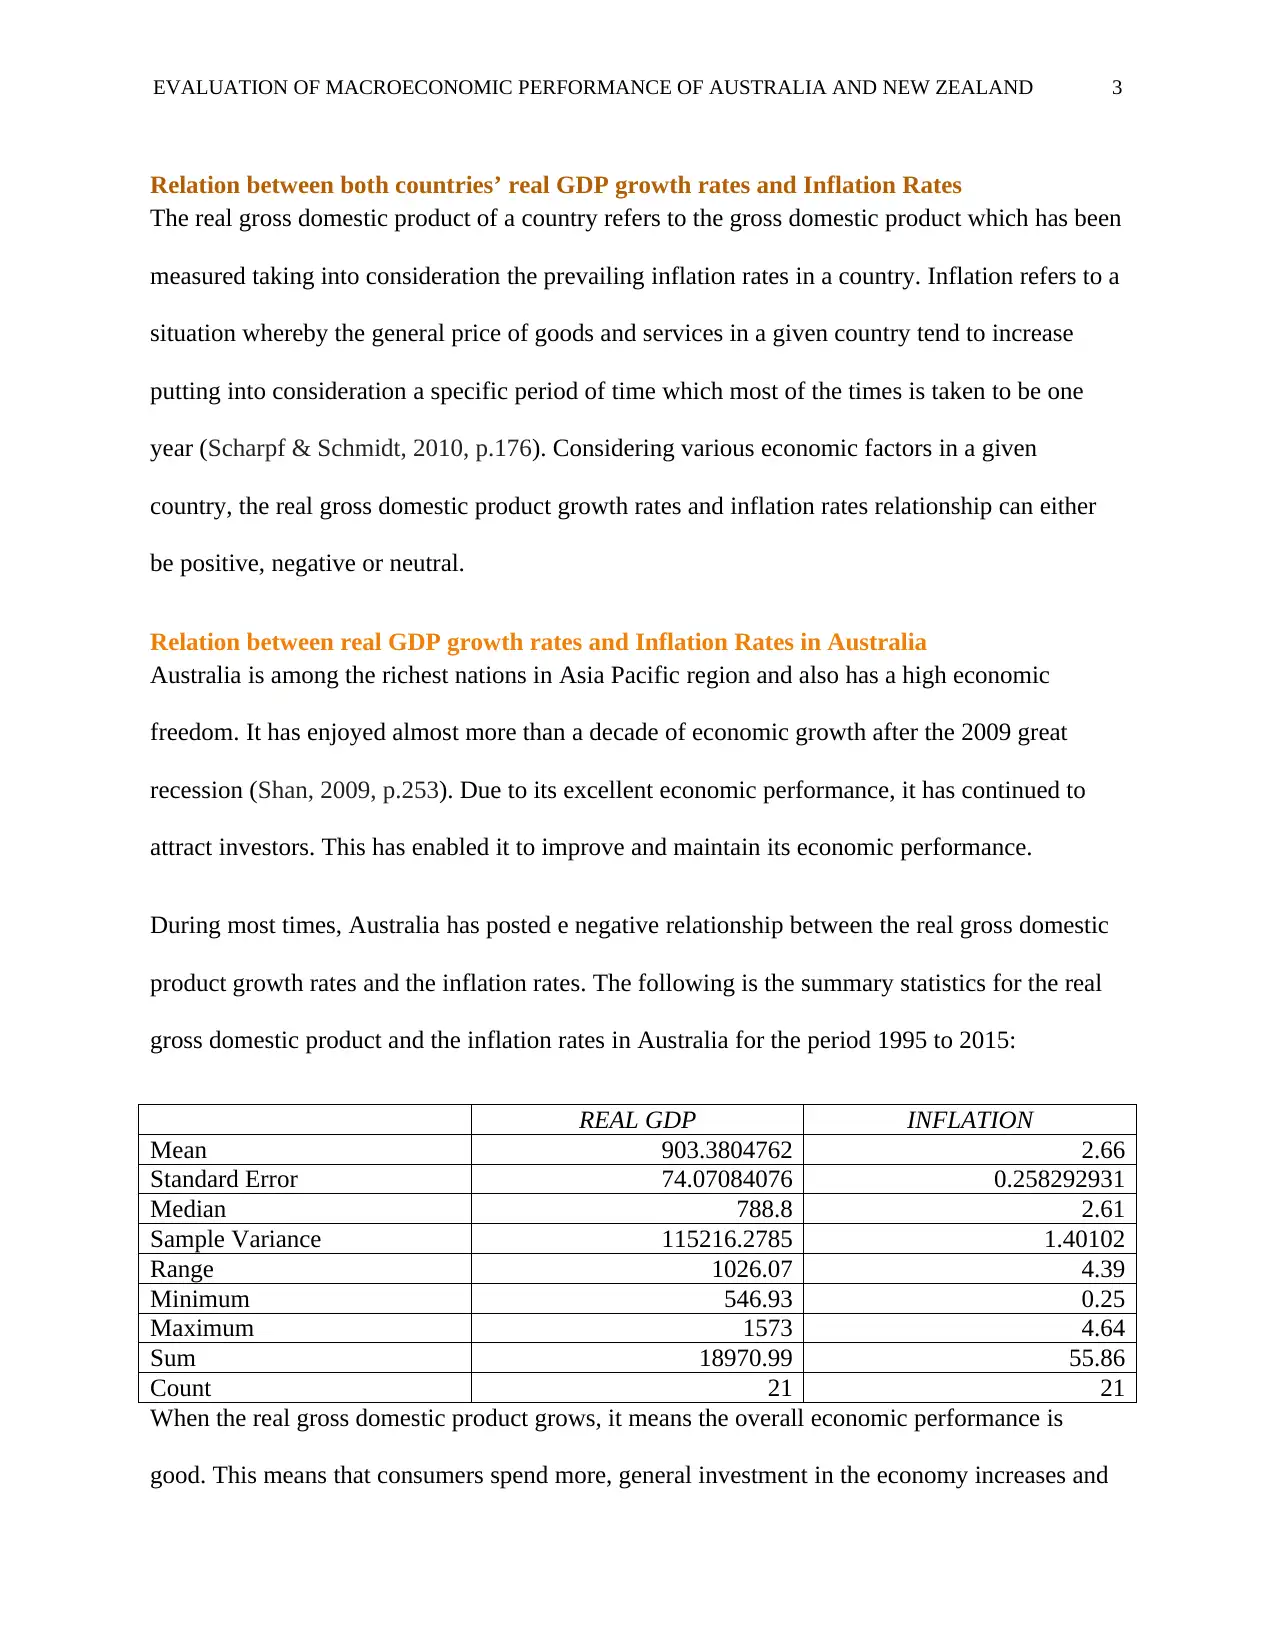
During most times, Australia has posted e negative relationship between the real gross domestic
product growth rates and the inflation rates. The following is the summary statistics for the real
gross domestic product and the inflation rates in Australia for the period 1995 to 2015:
REAL GDP INFLATION
Mean 903.3804762 2.66
Standard Error 74.07084076 0.258292931
Median 788.8 2.61
Sample Variance 115216.2785 1.40102
Range 1026.07 4.39
Minimum 546.93 0.25
Maximum 1573 4.64
Sum 18970.99 55.86
Count 21 21
When the real gross domestic product grows, it means the overall economic performance is
good. This means that consumers spend more, general investment in the economy increases and
Relation between both countries’ real GDP growth rates and Inflation Rates
The real gross domestic product of a country refers to the gross domestic product which has been
measured taking into consideration the prevailing inflation rates in a country. Inflation refers to a
situation whereby the general price of goods and services in a given country tend to increase
putting into consideration a specific period of time which most of the times is taken to be one
year (Scharpf & Schmidt, 2010, p.176). Considering various economic factors in a given
country, the real gross domestic product growth rates and inflation rates relationship can either
be positive, negative or neutral.
Relation between real GDP growth rates and Inflation Rates in Australia
Australia is among the richest nations in Asia Pacific region and also has a high economic
freedom. It has enjoyed almost more than a decade of economic growth after the 2009 great
recession (Shan, 2009, p.253). Due to its excellent economic performance, it has continued to
attract investors. This has enabled it to improve and maintain its economic performance.
During most times, Australia has posted e negative relationship between the real gross domestic
product growth rates and the inflation rates. The following is the summary statistics for the real
gross domestic product and the inflation rates in Australia for the period 1995 to 2015:
REAL GDP INFLATION
Mean 903.3804762 2.66
Standard Error 74.07084076 0.258292931
Median 788.8 2.61
Sample Variance 115216.2785 1.40102
Range 1026.07 4.39
Minimum 546.93 0.25
Maximum 1573 4.64
Sum 18970.99 55.86
Count 21 21
When the real gross domestic product grows, it means the overall economic performance is
good. This means that consumers spend more, general investment in the economy increases and
⊘ This is a preview!⊘
Do you want full access?
Subscribe today to unlock all pages.
Trusted by 1+ million students worldwide
EVALUATION OF MACROECONOMIC PERFORMANCE OF AUSTRALIA AND NEW ZEALAND 4
production by the producers as well increases to cater for the increased demand in the economy.
As production increases, it reaches a point where no more production can be done as all the
production tools and available employees are all occupied. This means that demand continues to
grow but goods are no longer produced to meet their increased demand. As a result, the
prevailing market price increase leading to inflation (Sherwin, 2010, p.15). The reserve bank
lending rates rise and hence loans are issued by banks at higher interest rates. The overall
investment in the economy decreases as the investment capital is availed at higher cost. The
decrease in the overall level of investment in the economy lowers the overall real gross domestic.
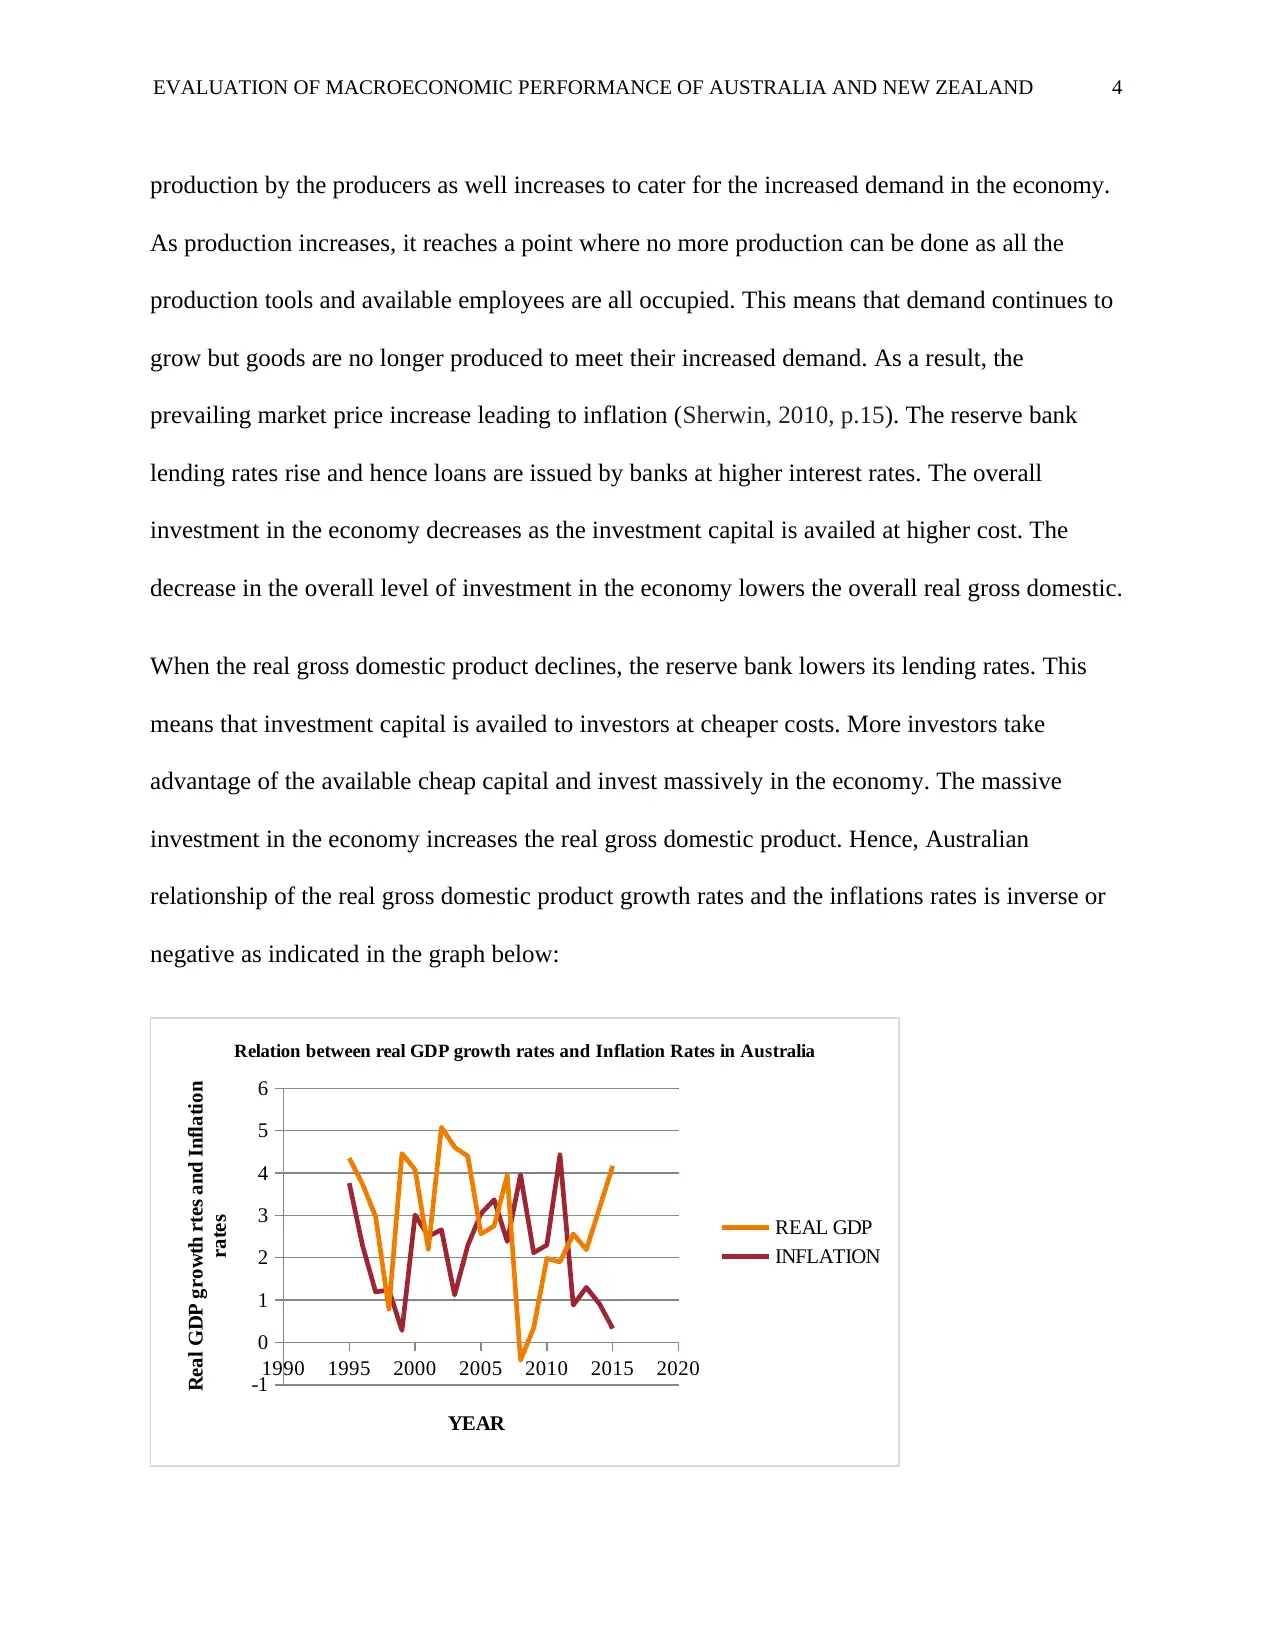
When the real gross domestic product declines, the reserve bank lowers its lending rates. This
means that investment capital is availed to investors at cheaper costs. More investors take
advantage of the available cheap capital and invest massively in the economy. The massive
investment in the economy increases the real gross domestic product. Hence, Australian
relationship of the real gross domestic product growth rates and the inflations rates is inverse or
negative as indicated in the graph below:
1990 1995 2000 2005 2010 2015 2020
-1
0
1
2
3
4
5
6
Relation between real GDP growth rates and Inflation Rates in Australia
REAL GDP
INFLATION
YEAR
Real GDP growth rtes and Inflation
rates
production by the producers as well increases to cater for the increased demand in the economy.
As production increases, it reaches a point where no more production can be done as all the
production tools and available employees are all occupied. This means that demand continues to
grow but goods are no longer produced to meet their increased demand. As a result, the
prevailing market price increase leading to inflation (Sherwin, 2010, p.15). The reserve bank
lending rates rise and hence loans are issued by banks at higher interest rates. The overall
investment in the economy decreases as the investment capital is availed at higher cost. The
decrease in the overall level of investment in the economy lowers the overall real gross domestic.
When the real gross domestic product declines, the reserve bank lowers its lending rates. This
means that investment capital is availed to investors at cheaper costs. More investors take
advantage of the available cheap capital and invest massively in the economy. The massive
investment in the economy increases the real gross domestic product. Hence, Australian
relationship of the real gross domestic product growth rates and the inflations rates is inverse or
negative as indicated in the graph below:
1990 1995 2000 2005 2010 2015 2020
-1
0
1
2
3
4
5
6
Relation between real GDP growth rates and Inflation Rates in Australia
REAL GDP
INFLATION
YEAR
Real GDP growth rtes and Inflation
rates
Paraphrase This Document
Need a fresh take? Get an instant paraphrase of this document with our AI Paraphraser
EVALUATION OF MACROECONOMIC PERFORMANCE OF AUSTRALIA AND NEW ZEALAND 5
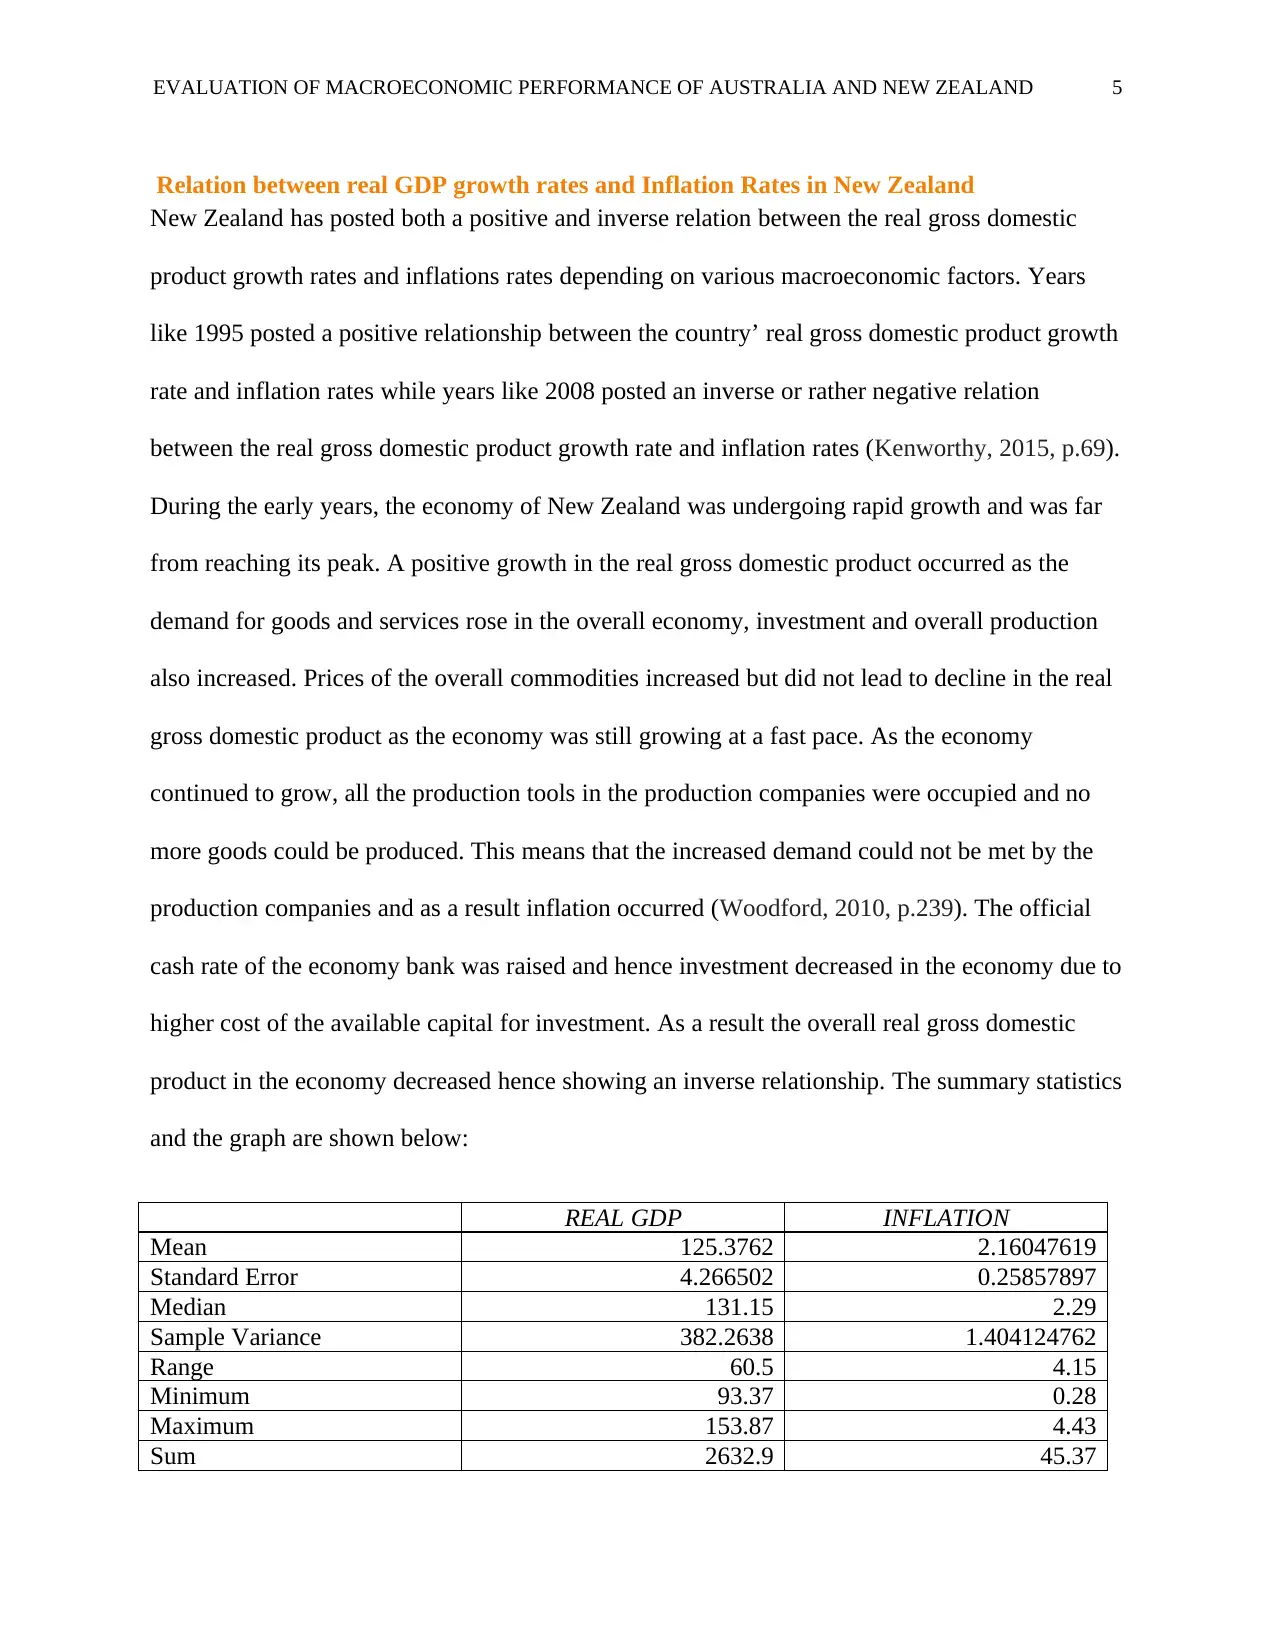
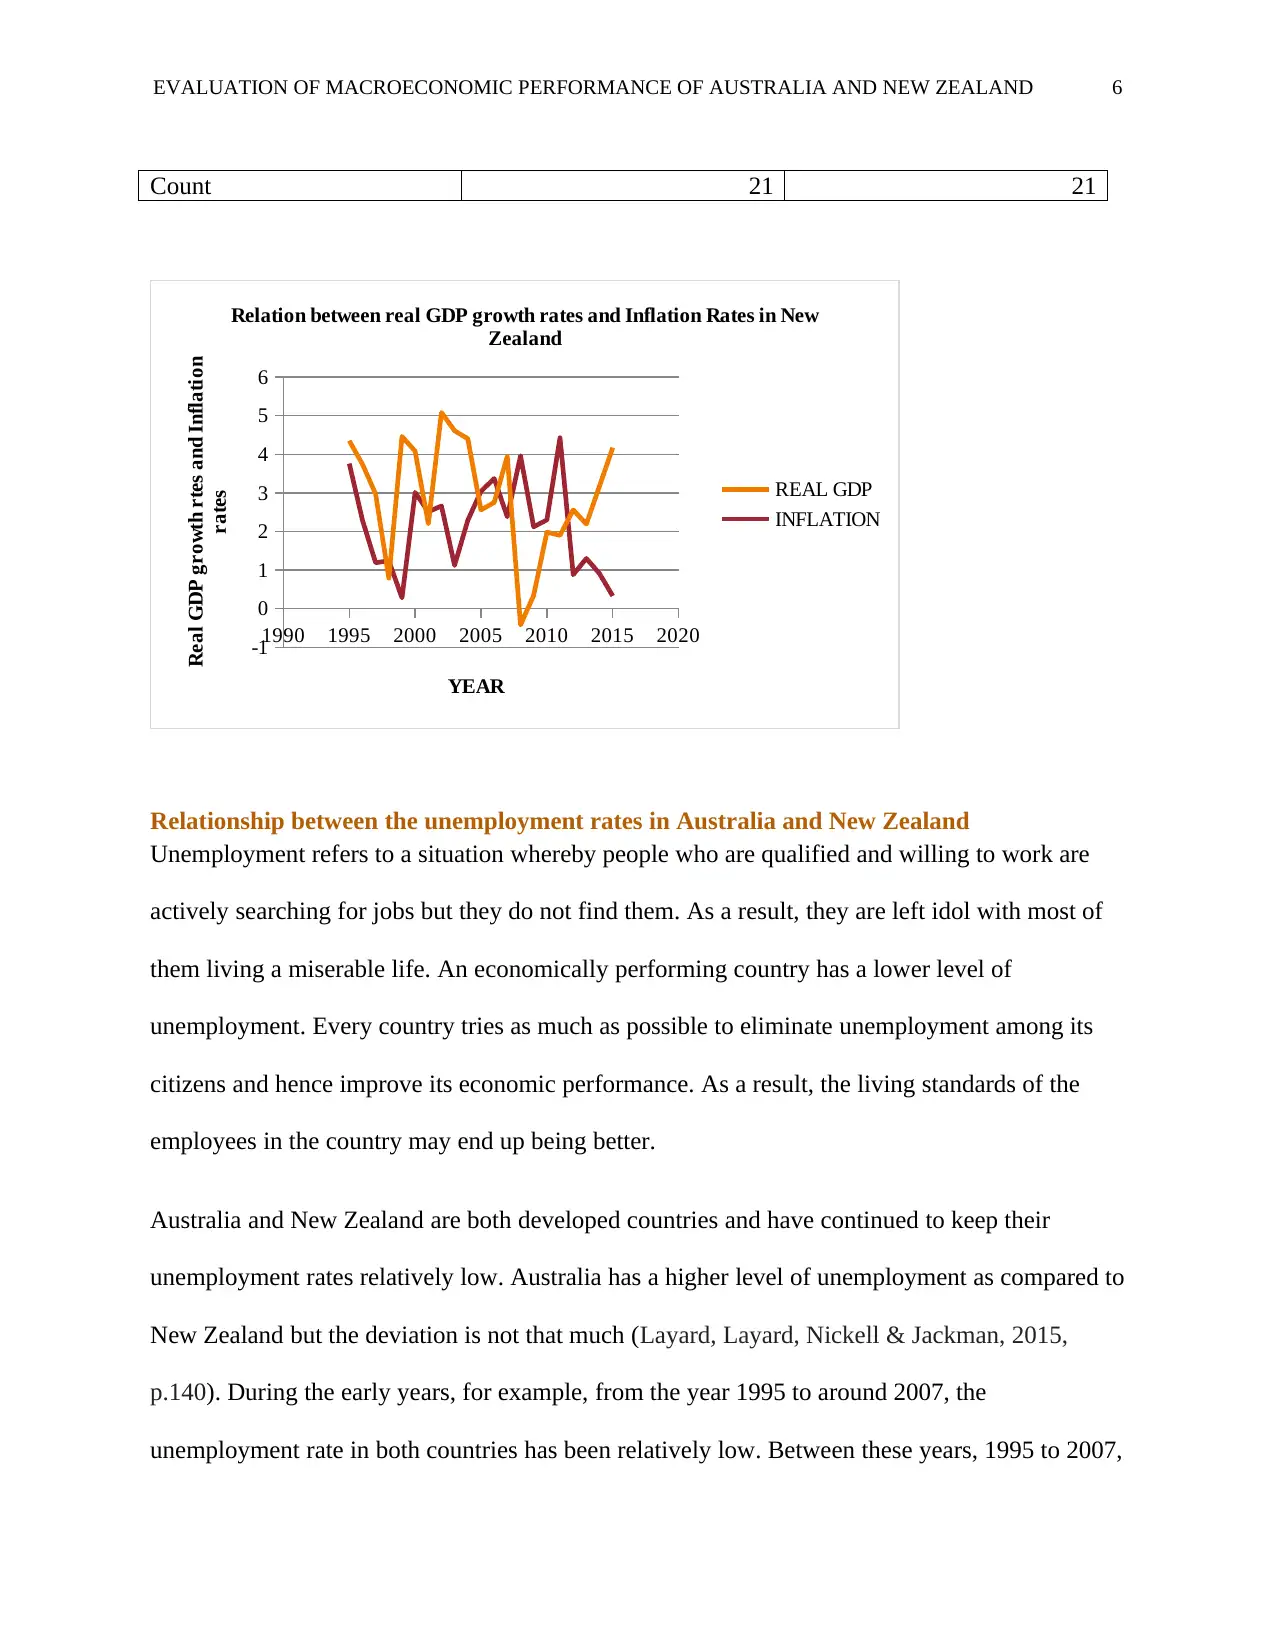
Relation between real GDP growth rates and Inflation Rates in New Zealand
New Zealand has posted both a positive and inverse relation between the real gross domestic
product growth rates and inflations rates depending on various macroeconomic factors. Years
like 1995 posted a positive relationship between the country’ real gross domestic product growth
rate and inflation rates while years like 2008 posted an inverse or rather negative relation
between the real gross domestic product growth rate and inflation rates (Kenworthy, 2015, p.69).
During the early years, the economy of New Zealand was undergoing rapid growth and was far
from reaching its peak. A positive growth in the real gross domestic product occurred as the
demand for goods and services rose in the overall economy, investment and overall production
also increased. Prices of the overall commodities increased but did not lead to decline in the real
gross domestic product as the economy was still growing at a fast pace. As the economy
continued to grow, all the production tools in the production companies were occupied and no
more goods could be produced. This means that the increased demand could not be met by the
production companies and as a result inflation occurred (Woodford, 2010, p.239). The official
cash rate of the economy bank was raised and hence investment decreased in the economy due to
higher cost of the available capital for investment. As a result the overall real gross domestic
product in the economy decreased hence showing an inverse relationship. The summary statistics
and the graph are shown below:
REAL GDP INFLATION
Mean 125.3762 2.16047619
Standard Error 4.266502 0.25857897
Median 131.15 2.29
Sample Variance 382.2638 1.404124762
Range 60.5 4.15
Minimum 93.37 0.28
Maximum 153.87 4.43
Sum 2632.9 45.37
EVALUATION OF MACROECONOMIC PERFORMANCE OF AUSTRALIA AND NEW ZEALAND 6
Count 21 21
1990 1995 2000 2005 2010 2015 2020
-1
0
1
2
3
4
5
6
Relation between real GDP growth rates and Inflation Rates in New
Zealand
REAL GDP
INFLATION
YEAR
Real GDP growth rtes and Inflation
rates
Relationship between the unemployment rates in Australia and New Zealand
Unemployment refers to a situation whereby people who are qualified and willing to work are
actively searching for jobs but they do not find them. As a result, they are left idol with most of
them living a miserable life. An economically performing country has a lower level of
unemployment. Every country tries as much as possible to eliminate unemployment among its
citizens and hence improve its economic performance. As a result, the living standards of the
employees in the country may end up being better.
Australia and New Zealand are both developed countries and have continued to keep their
unemployment rates relatively low. Australia has a higher level of unemployment as compared to
New Zealand but the deviation is not that much (Layard, Layard, Nickell & Jackman, 2015,
p.140). During the early years, for example, from the year 1995 to around 2007, the
unemployment rate in both countries has been relatively low. Between these years, 1995 to 2007,
⊘ This is a preview!⊘
Do you want full access?
Subscribe today to unlock all pages.
Trusted by 1+ million students worldwide
EVALUATION OF MACROECONOMIC PERFORMANCE OF AUSTRALIA AND NEW ZEALAND 7
the unemployment rate in New Zealand increased at a higher rate compared to that of Australia.
During the year 1997, Asia faced severe financial crisis and as a result the unemployment rate in
both countries increased but the rate of increase was higher in New Zealand as compared to
Australia bearing in mind that New Zealand was still lagging behind in terms of growth as
compared to Australia which was undergoing economic growth at a fast pace during the early
years (Murphy, 2011, p.335). After the great 2008 recession in Asia, Australia and New Zealand
experienced a rise in the unemployment rates. The rate of unemployment during this period was
higher in New Zealand than in Australia. New Zealand even posted a negative economic growth
but Australia survived and despite the great recession, it still posted a positive economic growth
but a low one. After the great recession, New Zealand and Australia unemployment rate
increased with New Zealand leading up to the year 2012. From the year 2012, the unemployment
rate in both countries has been decreasing due to better economic performance and is anticipated
to be even much lower in future.
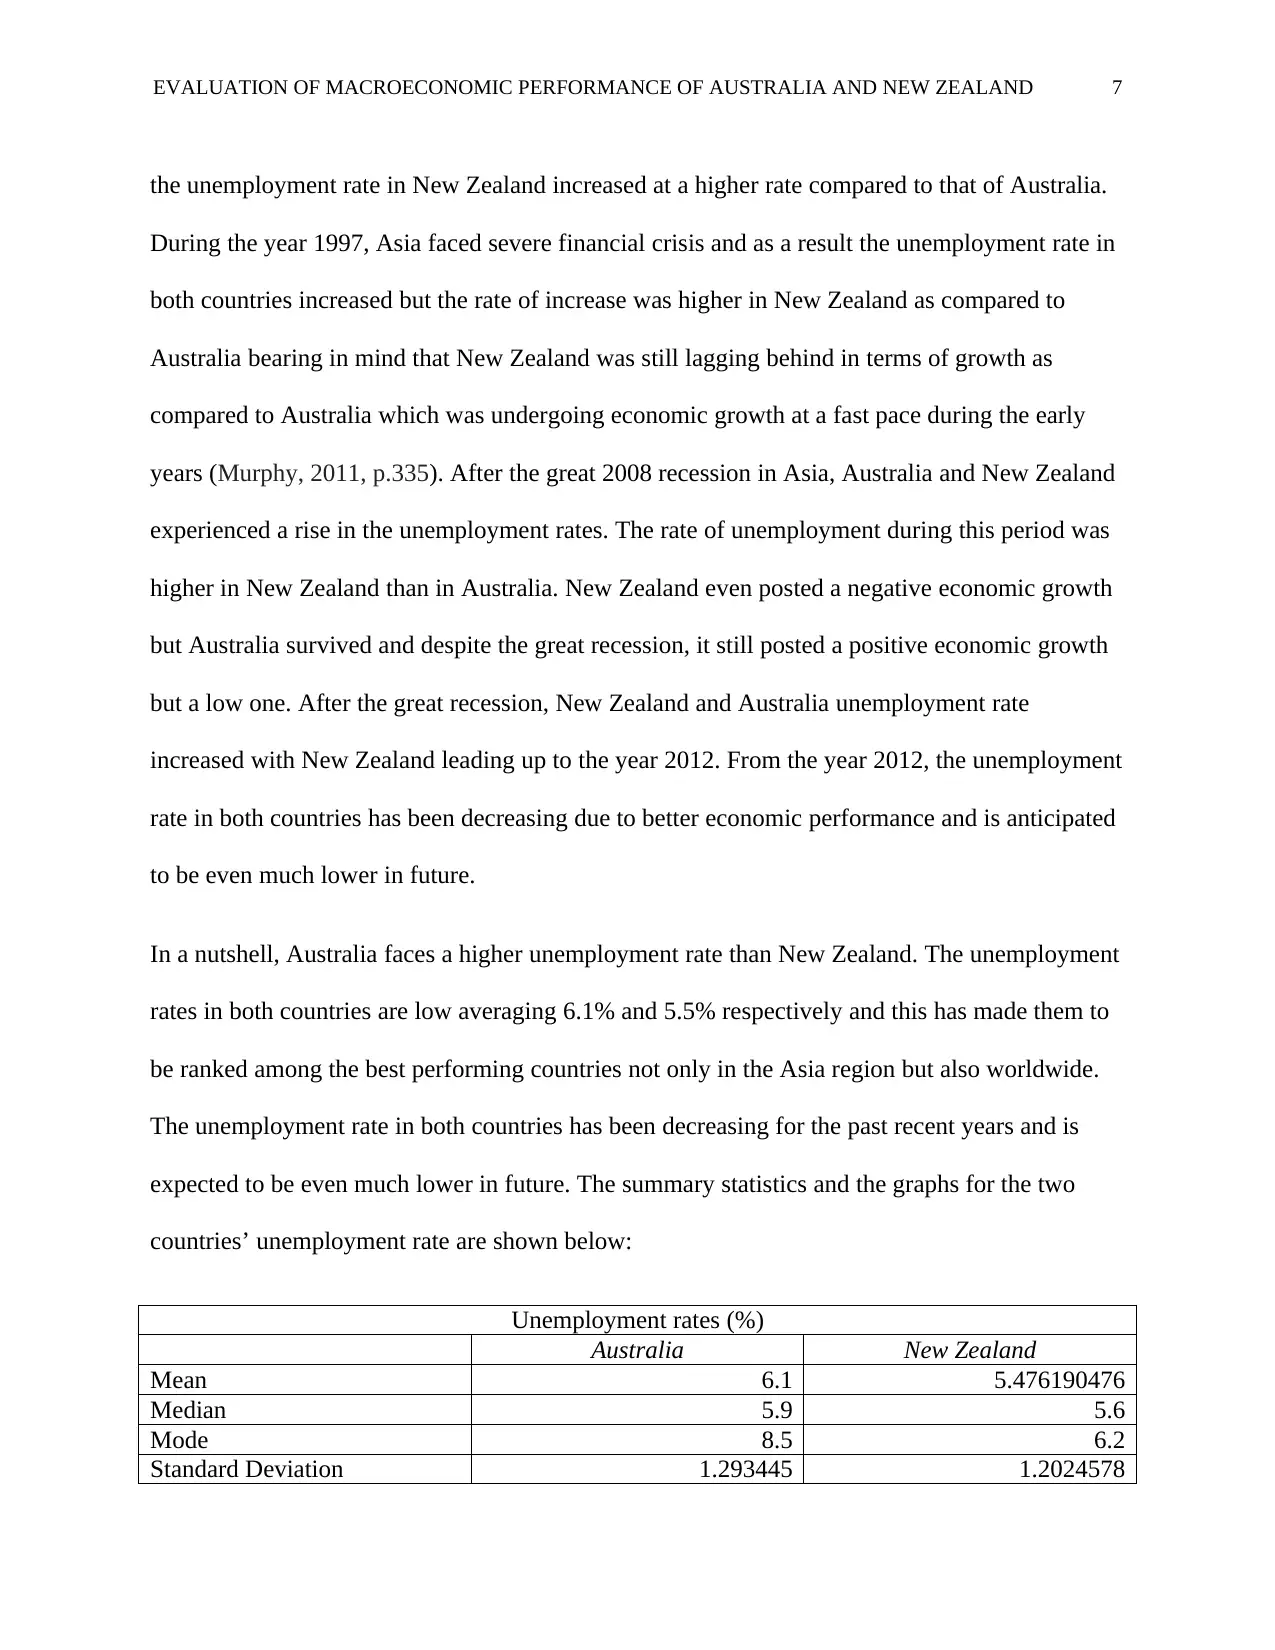
In a nutshell, Australia faces a higher unemployment rate than New Zealand. The unemployment
rates in both countries are low averaging 6.1% and 5.5% respectively and this has made them to
be ranked among the best performing countries not only in the Asia region but also worldwide.
The unemployment rate in both countries has been decreasing for the past recent years and is
expected to be even much lower in future. The summary statistics and the graphs for the two
countries’ unemployment rate are shown below:
Unemployment rates (%)
Australia New Zealand
Mean 6.1 5.476190476
Median 5.9 5.6
Mode 8.5 6.2
Standard Deviation 1.293445 1.2024578
the unemployment rate in New Zealand increased at a higher rate compared to that of Australia.
During the year 1997, Asia faced severe financial crisis and as a result the unemployment rate in
both countries increased but the rate of increase was higher in New Zealand as compared to
Australia bearing in mind that New Zealand was still lagging behind in terms of growth as
compared to Australia which was undergoing economic growth at a fast pace during the early
years (Murphy, 2011, p.335). After the great 2008 recession in Asia, Australia and New Zealand
experienced a rise in the unemployment rates. The rate of unemployment during this period was
higher in New Zealand than in Australia. New Zealand even posted a negative economic growth
but Australia survived and despite the great recession, it still posted a positive economic growth
but a low one. After the great recession, New Zealand and Australia unemployment rate
increased with New Zealand leading up to the year 2012. From the year 2012, the unemployment
rate in both countries has been decreasing due to better economic performance and is anticipated
to be even much lower in future.
In a nutshell, Australia faces a higher unemployment rate than New Zealand. The unemployment
rates in both countries are low averaging 6.1% and 5.5% respectively and this has made them to
be ranked among the best performing countries not only in the Asia region but also worldwide.
The unemployment rate in both countries has been decreasing for the past recent years and is
expected to be even much lower in future. The summary statistics and the graphs for the two
countries’ unemployment rate are shown below:
Unemployment rates (%)
Australia New Zealand
Mean 6.1 5.476190476
Median 5.9 5.6
Mode 8.5 6.2
Standard Deviation 1.293445 1.2024578
Paraphrase This Document
Need a fresh take? Get an instant paraphrase of this document with our AI Paraphraser
EVALUATION OF MACROECONOMIC PERFORMANCE OF AUSTRALIA AND NEW ZEALAND 8
Sample Variance 1.673 1.445904762
Range 4.3 4.6
Minimum 4.2 3.3
Maximum 8.5 7.9
Sum 128.1 115
Count 21 21
1990 1995 2000 2005 2010 2015 2020
0
1
2
3
4
5
6
7
8
9
Unemployment rates in Australia and New Zealand
Australia
New Zealand
Year
Unemployment rates (%)
Relationship between the cash rate and the official cash rate
Interest rate refers to the amount charged (which is actually the percentage of the principal
amount) to the borrower by the lender for the use of the borrowed asset. It is the amount charged
to the investors for the use of borrowed money from banks. A higher interest rate discourages
investment while on the other hand a lower interest rate encourages investment (Archer, Brookes
& Reddell, 2009, p.51).
The following is the summary statistics for the interest rates (%) for Australia and New Zealand:
Australia New Zealand
Mean 5.057143 5.676190476
Standard Error 0.323932 0.492510805
Median 5 5.7
EVALUATION OF MACROECONOMIC PERFORMANCE OF AUSTRALIA AND NEW ZEALAND 9
Mode 5 5.7
Standard Deviation 1.484443 2.256968046
Range 5.4 6.6
Minimum 2.3 2.7
Maximum 7.7 9.3
Sum 106.2 119.2
Count 21 21
Generally, the interest rates for Australia and New Zealand have been high for the past years
averaging at 5.06% and 5.68% respectively. New Zealand has been undergoing higher interest
rates as compared to Australia. The interest rates have been decreasing over the period 1995 to
2015.
As the interest rates in Australia move, interest rates in New Zealand also move. For the past
years as the interest rates of Australia decreased, the interest rates of New Zealand also
decreased. This is due to the fact that every country tries its best to foster economic growth and
any change in the other country’s interest rates may negatively affect its economic growth if not
well adjusted.
For the past decade, the monetary policy has been tighter in Australia as compared to New
Zealand (Ellis & Lewis, 2010, p.308). Australia’s interest rates have been kept lower than those
of New Zealand and even today as the interest rates for Australia stand at 1.5%, those of New
Zealand stand at 1.75% which is a bit higher. The graph for the relationship is shown below:
⊘ This is a preview!⊘
Do you want full access?
Subscribe today to unlock all pages.
Trusted by 1+ million students worldwide
1 out of 16
Related Documents


Your All-in-One AI-Powered Toolkit for Academic Success.
+13062052269
info@desklib.com
Available 24*7 on WhatsApp / Email
![[object Object]](/_next/static/media/star-bottom.7253800d.svg)
Unlock your academic potential
Copyright © 2020–2026 A2Z Services. All Rights Reserved. Developed and managed by ZUCOL.