Hypothesis Test of Obesity Rates: Analysis of Australian Health Survey

Verified

Added on  2023/06/11

|5
|764
|269
Homework Assignment
AI Summary
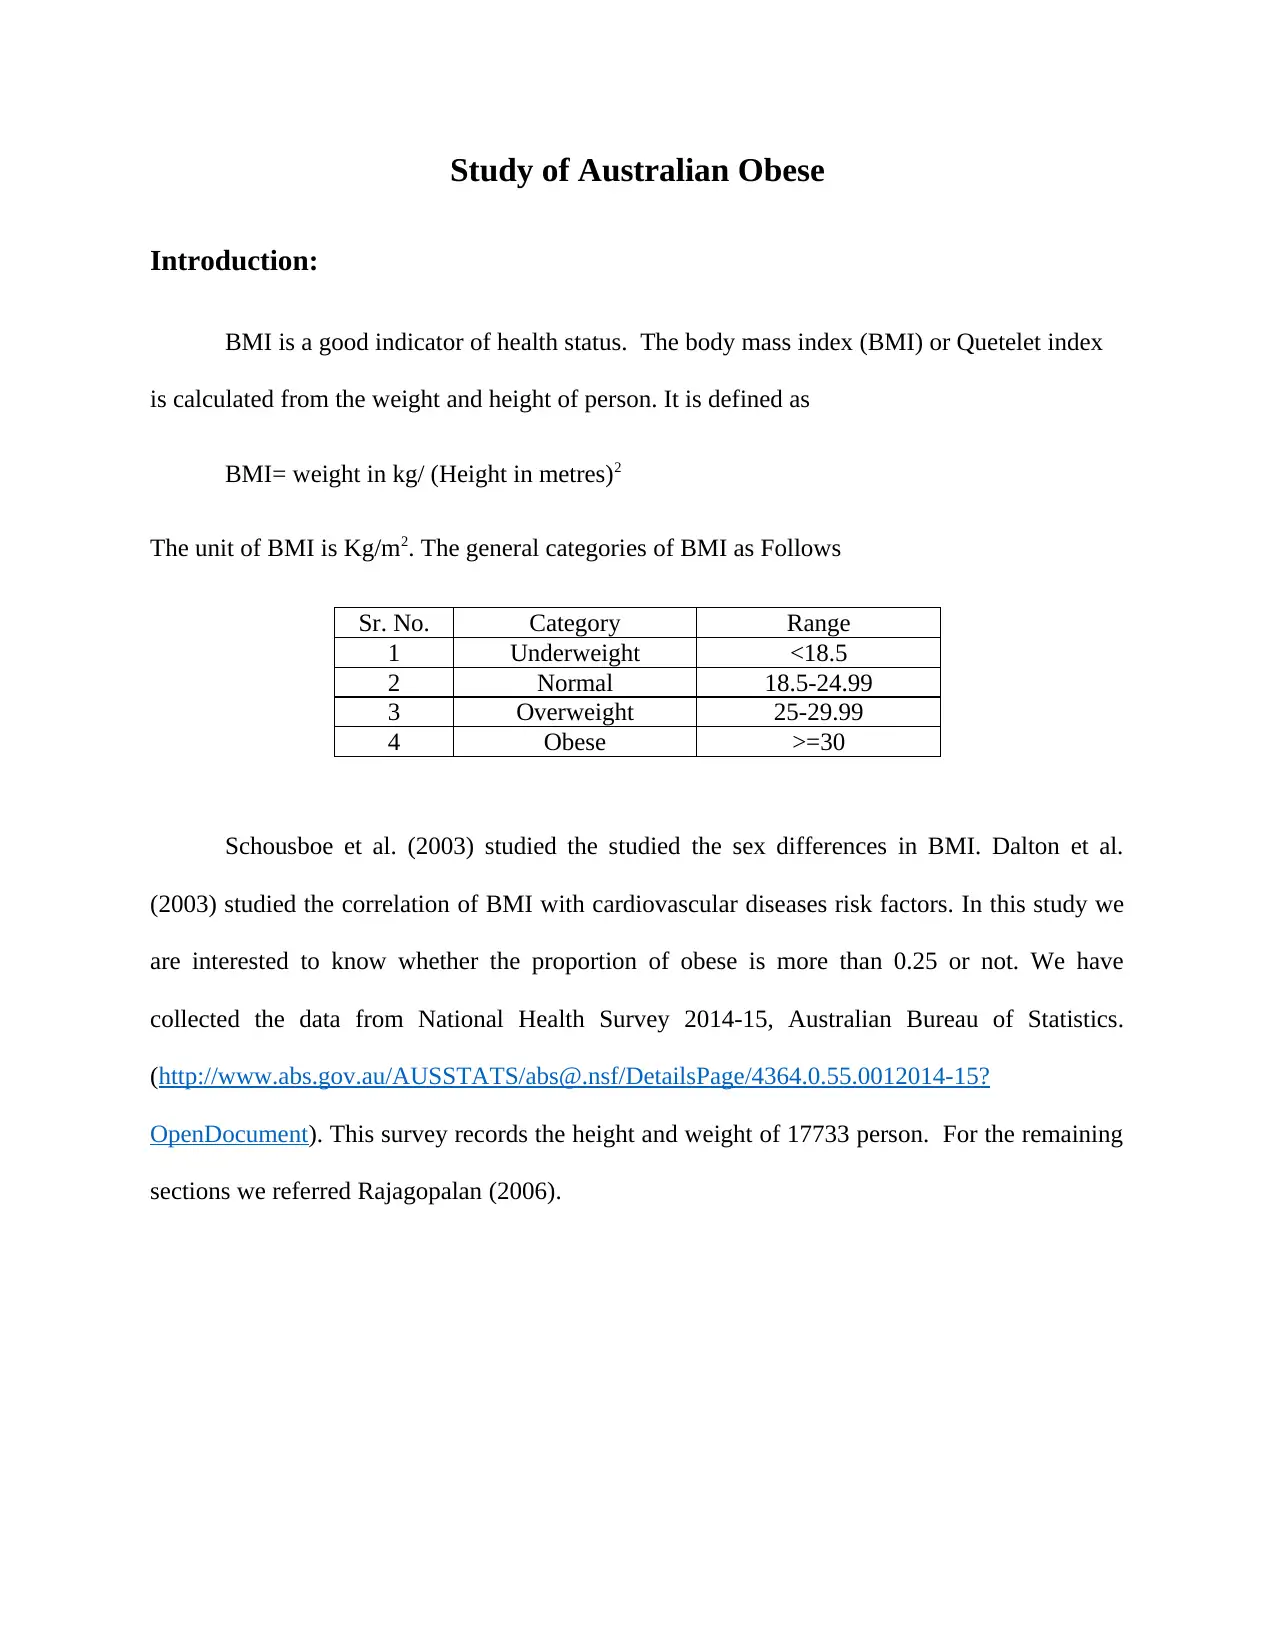
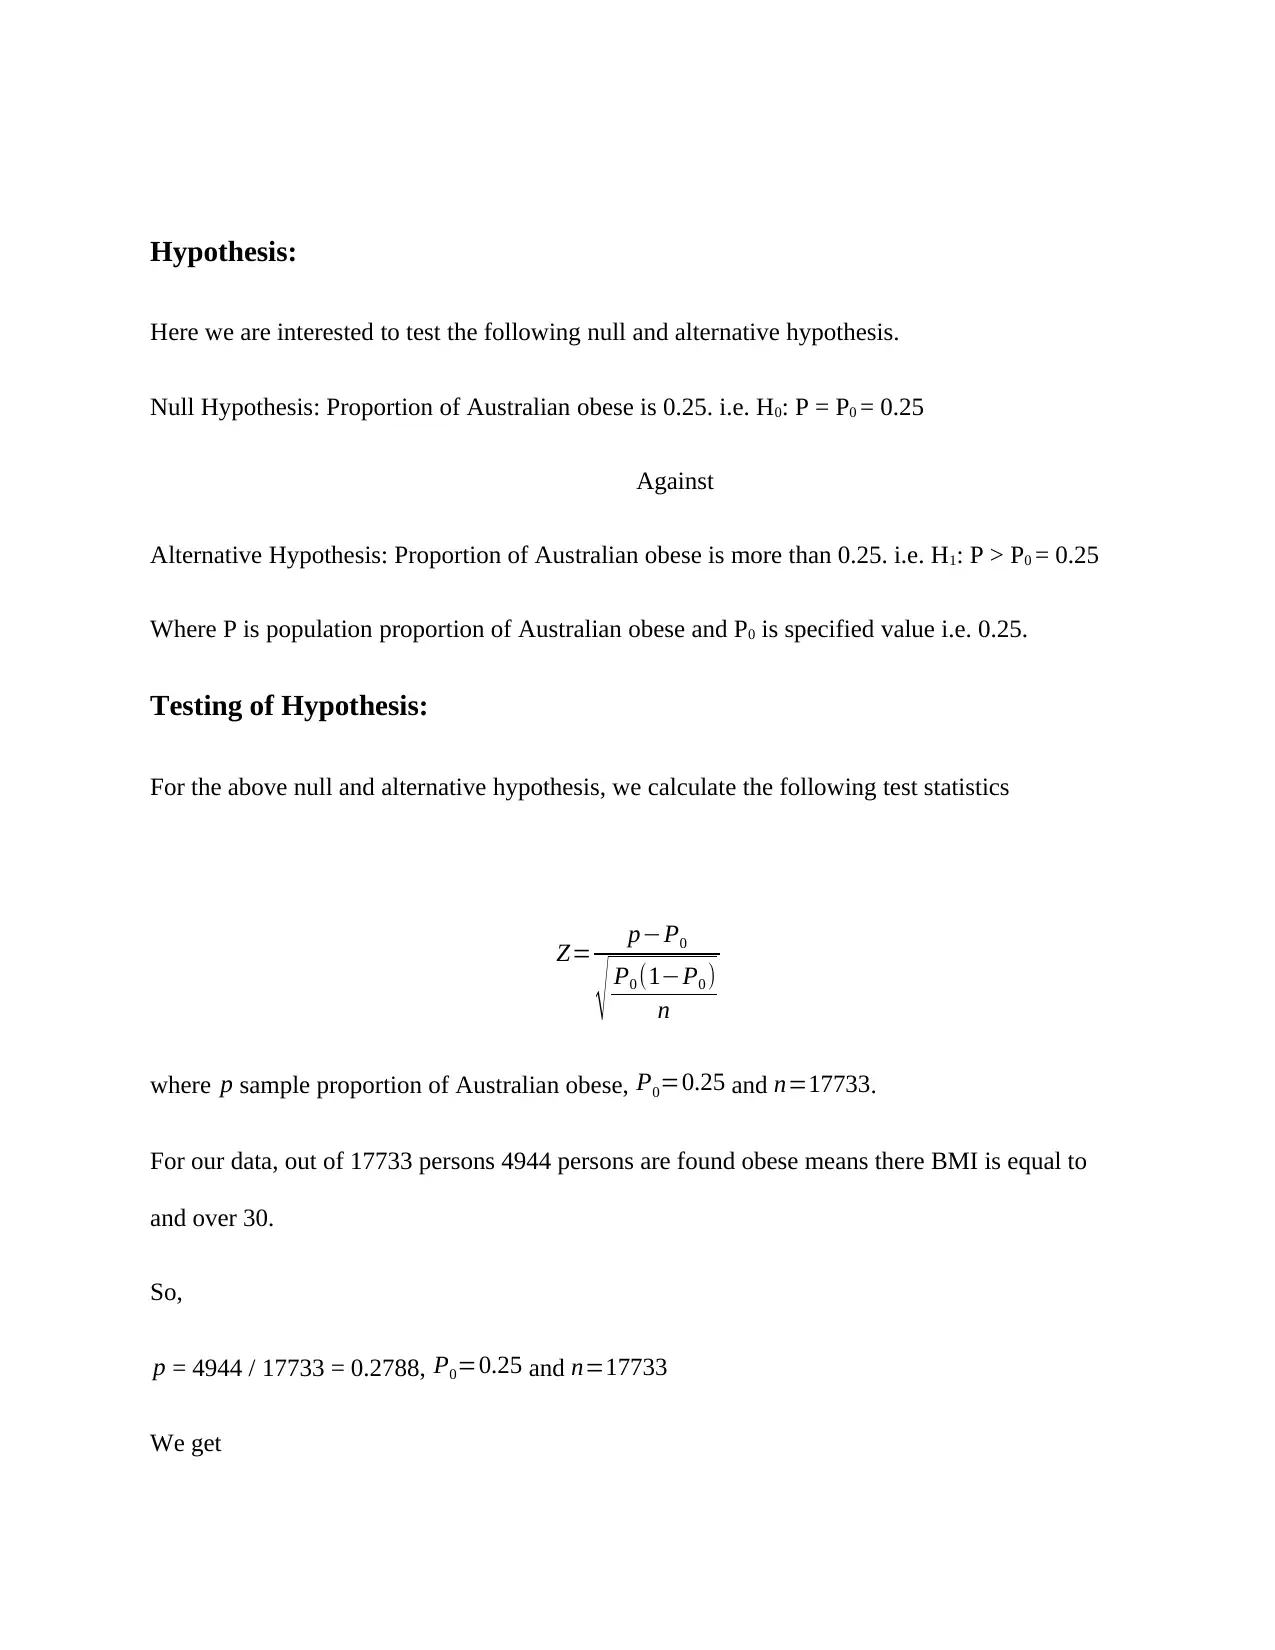
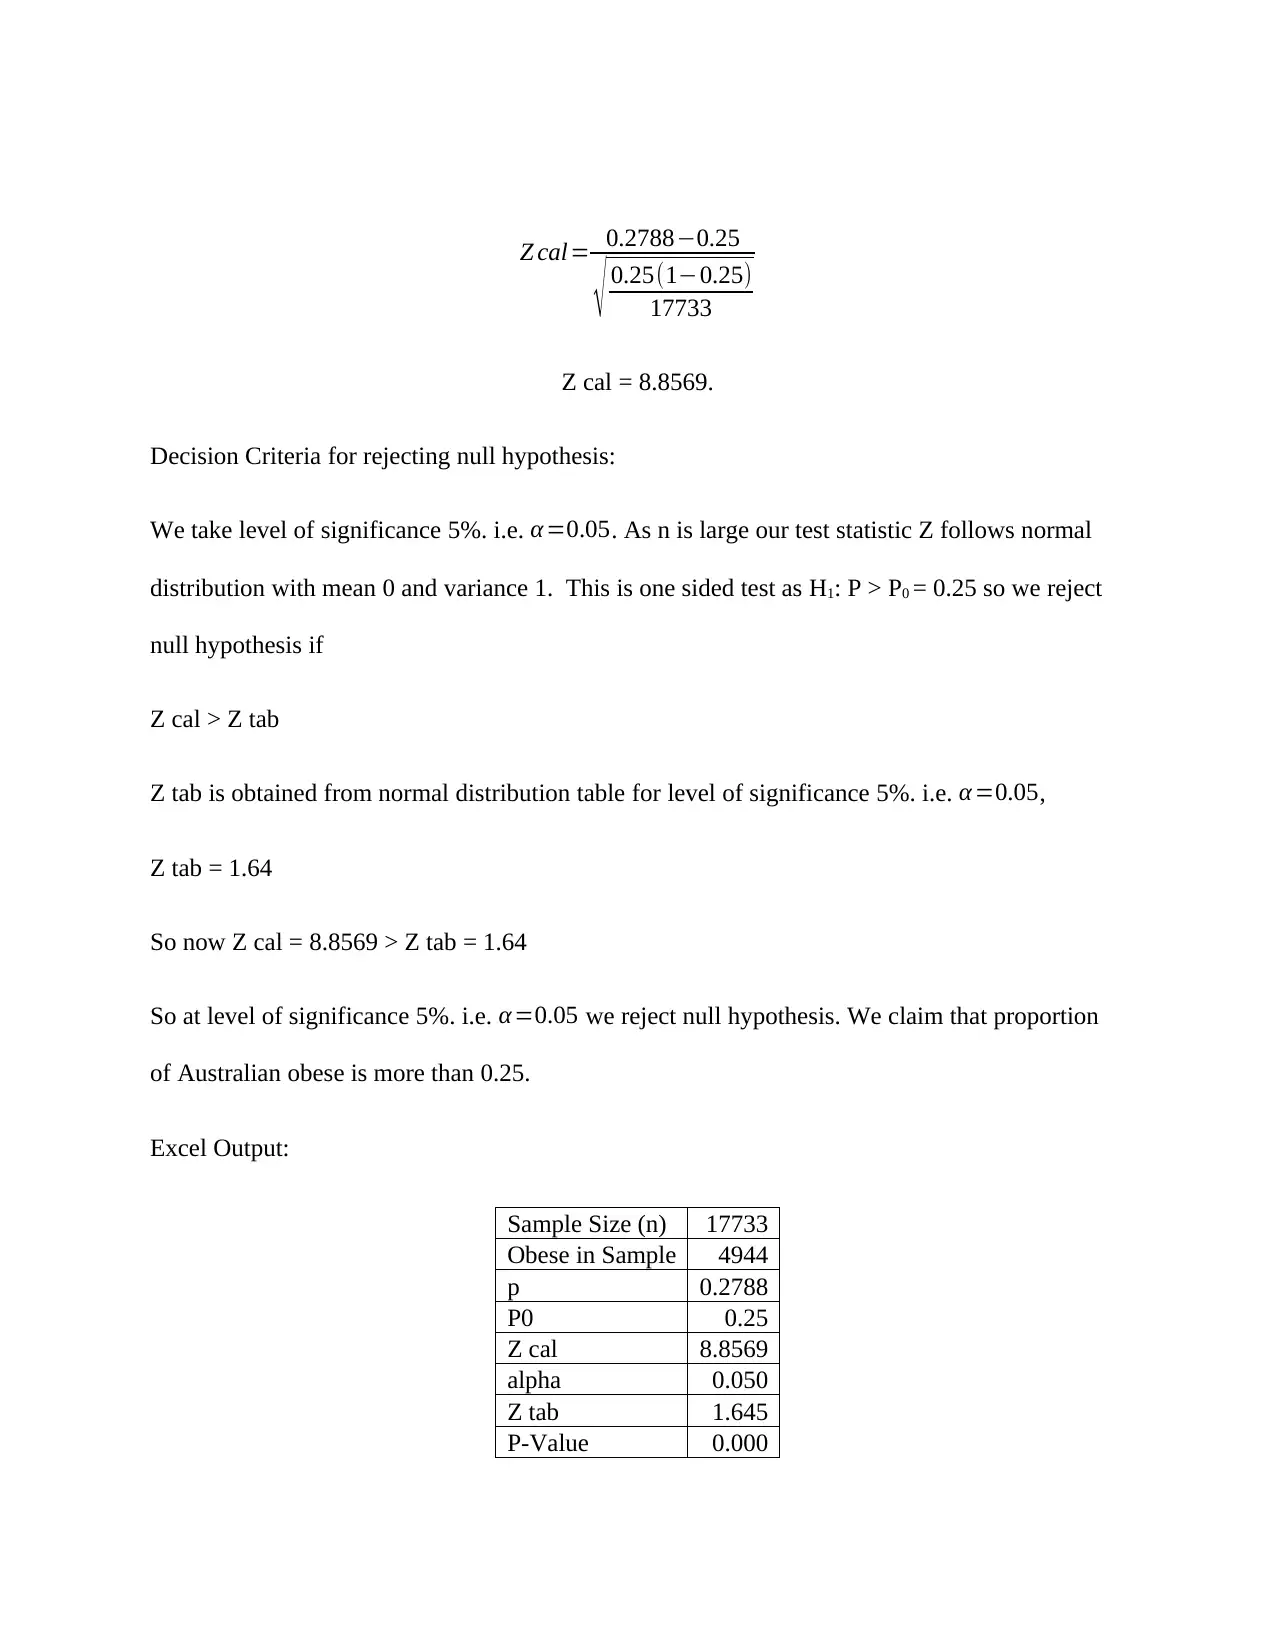
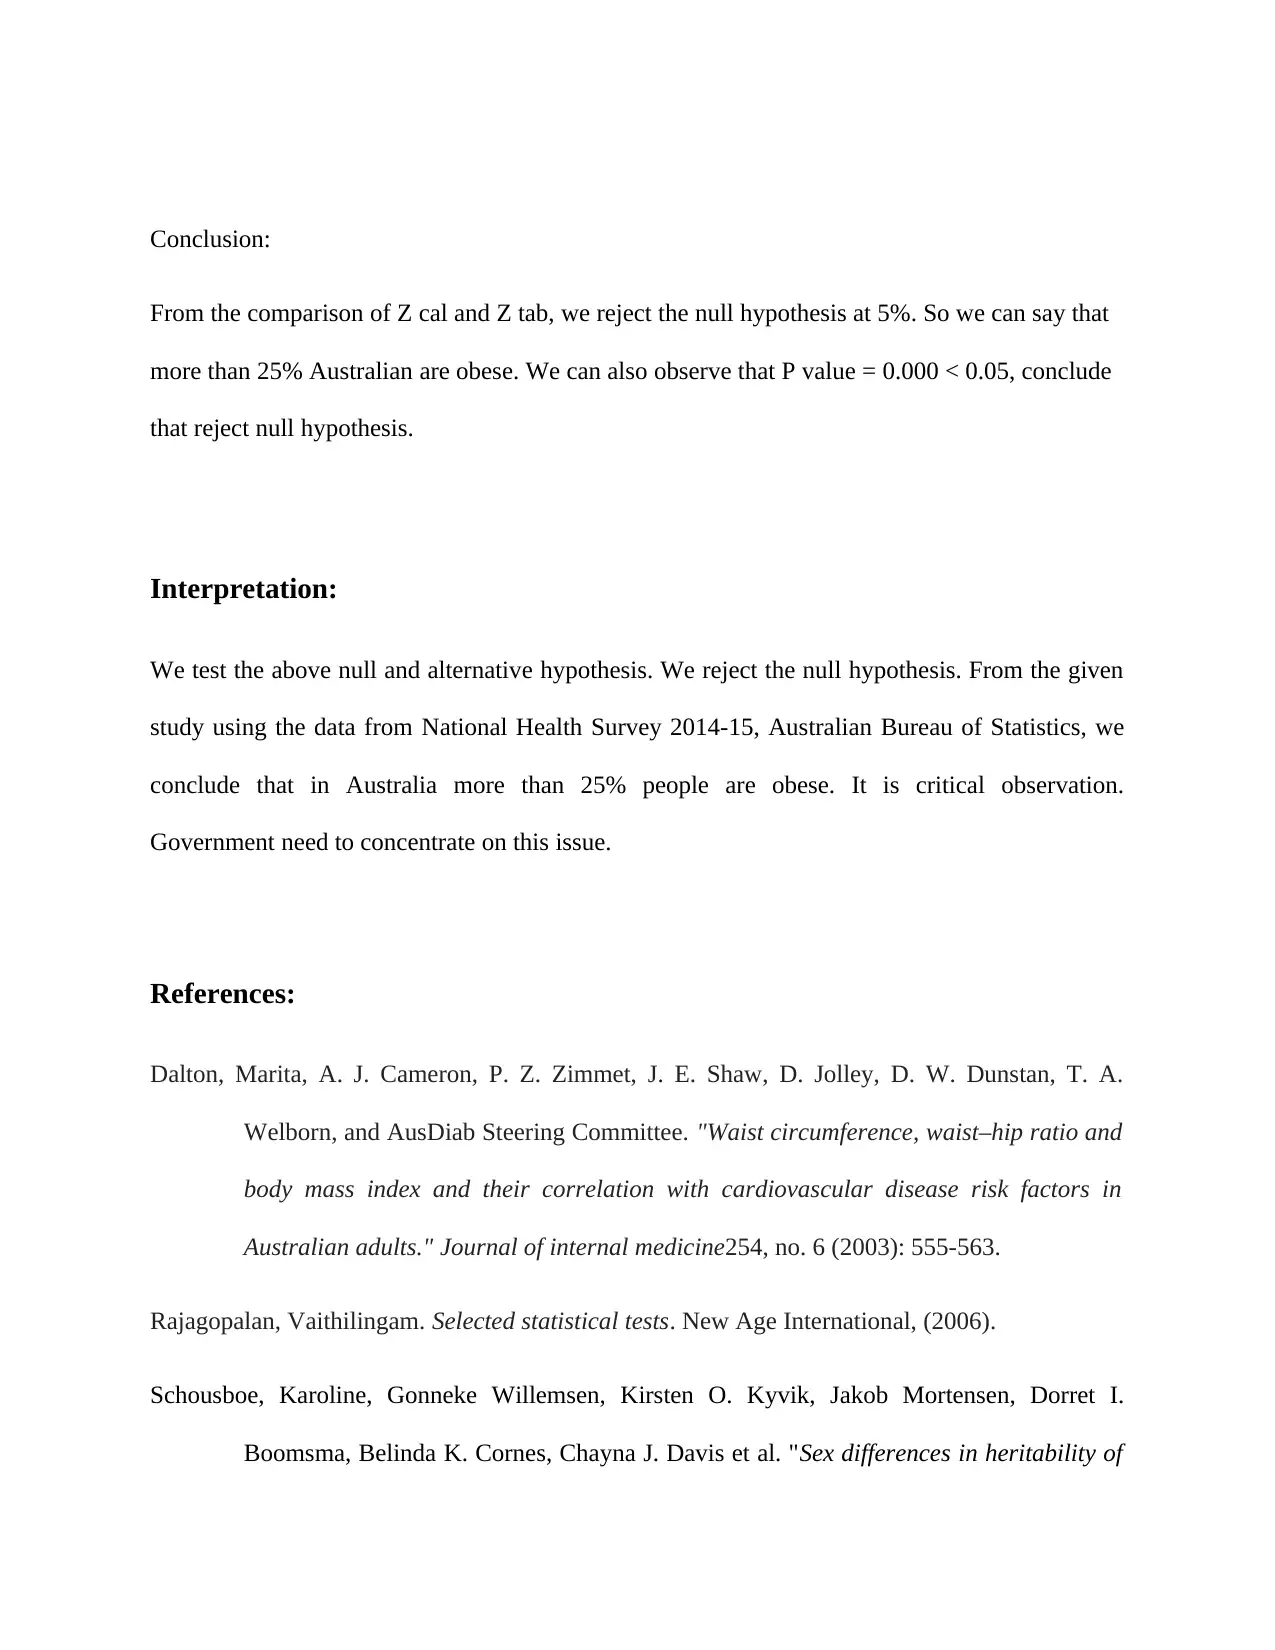
This assignment presents a statistical hypothesis test to determine if the proportion of obese individuals in Australia exceeds 25%, utilizing data from the National Health Survey 2014-15 conducted by the Australian Bureau of Statistics. The study formulates null and alternative hypotheses, calculates a Z-test statistic based on sample data (where 4944 out of 17733 individuals were classified as obese), and compares the calculated Z-value to a critical Z-value at a 5% significance level. The results lead to the rejection of the null hypothesis, concluding that the proportion of obese Australians is significantly greater than 25%. The assignment includes an Excel output summarizing the statistical calculations and emphasizes the critical implications of these findings for public health interventions in Australia. It references relevant academic literature to support the analysis and interpretation of the results.
Document Page
Study of Australian Obese
Introduction:
BMI is a good indicator of health status. The body mass index (BMI) or Quetelet index
is calculated from the weight and height of person. It is defined as
BMI= weight in kg/ (Height in metres)2
The unit of BMI is Kg/m2. The general categories of BMI as Follows
Sr. No. Category Range
1 Underweight <18.5
2 Normal 18.5-24.99
3 Overweight 25-29.99
4 Obese >=30
Schousboe et al. (2003) studied the studied the sex differences in BMI. Dalton et al.
(2003) studied the correlation of BMI with cardiovascular diseases risk factors. In this study we
are interested to know whether the proportion of obese is more than 0.25 or not. We have
collected the data from National Health Survey 2014-15, Australian Bureau of Statistics.
(http://www.abs.gov.au/AUSSTATS/abs@.nsf/DetailsPage/4364.0.55.0012014-15?
OpenDocument). This survey records the height and weight of 17733 person. For the remaining
sections we referred Rajagopalan (2006).
tabler-icon-diamond-filled.svg

Paraphrase This Document

Need a fresh take? Get an instant paraphrase of this document with our AI Paraphraser
Document Page
Hypothesis:
Here we are interested to test the following null and alternative hypothesis.
Null Hypothesis: Proportion of Australian obese is 0.25. i.e. H0: P = P0 = 0.25
Against
Alternative Hypothesis: Proportion of Australian obese is more than 0.25. i.e. H1: P > P0 = 0.25
Where P is population proportion of Australian obese and P0 is specified value i.e. 0.25.
Testing of Hypothesis:
For the above null and alternative hypothesis, we calculate the following test statistics
Z= pP0
P0 (1P0 )
n
where p sample proportion of Australian obese, P0=0.25 and n=17733.
For our data, out of 17733 persons 4944 persons are found obese means there BMI is equal to
and over 30.
So,
p = 4944 / 17733 = 0.2788, P0=0.25 and n=17733
We get
Document Page
Z cal= 0.27880.25
0.25(10.25)
17733
Z cal = 8.8569.
Decision Criteria for rejecting null hypothesis:
We take level of significance 5%. i.e. α=0.05. As n is large our test statistic Z follows normal
distribution with mean 0 and variance 1. This is one sided test as H1: P > P0 = 0.25 so we reject
null hypothesis if
Z cal > Z tab
Z tab is obtained from normal distribution table for level of significance 5%. i.e. α =0.05,
Z tab = 1.64
So now Z cal = 8.8569 > Z tab = 1.64
So at level of significance 5%. i.e. α=0.05 we reject null hypothesis. We claim that proportion
of Australian obese is more than 0.25.
Excel Output:
Sample Size (n) 17733
Obese in Sample 4944
p 0.2788
P0 0.25
Z cal 8.8569
alpha 0.050
Z tab 1.645
P-Value 0.000
Document Page
Conclusion:
From the comparison of Z cal and Z tab, we reject the null hypothesis at 5%. So we can say that
more than 25% Australian are obese. We can also observe that P value = 0.000 < 0.05, conclude
that reject null hypothesis.
Interpretation:
We test the above null and alternative hypothesis. We reject the null hypothesis. From the given
study using the data from National Health Survey 2014-15, Australian Bureau of Statistics, we
conclude that in Australia more than 25% people are obese. It is critical observation.
Government need to concentrate on this issue.
References:
Dalton, Marita, A. J. Cameron, P. Z. Zimmet, J. E. Shaw, D. Jolley, D. W. Dunstan, T. A.
Welborn, and AusDiab Steering Committee. "Waist circumference, waist–hip ratio and
body mass index and their correlation with cardiovascular disease risk factors in
Australian adults." Journal of internal medicine254, no. 6 (2003): 555-563.
Rajagopalan, Vaithilingam. Selected statistical tests. New Age International, (2006).
Schousboe, Karoline, Gonneke Willemsen, Kirsten O. Kyvik, Jakob Mortensen, Dorret I.
Boomsma, Belinda K. Cornes, Chayna J. Davis et al. "Sex differences in heritability of
tabler-icon-diamond-filled.svg

Paraphrase This Document

Need a fresh take? Get an instant paraphrase of this document with our AI Paraphraser
Document Page
BMI: a comparative study of results from twin studies in eight countries." Twin
Research and Human Genetics 6, no. 5 (2003): 409-421.
chevron_up_icon
1 out of 5
circle_padding
hide_on_mobile
zoom_out_icon
[object Object]