Australian Petrol Price Analysis: Correlation with Crude Oil Prices
VerifiedAdded on 2023/04/21
|12
|2353
|62
Report
AI Summary
This report analyzes the trends and relationship between crude oil and petrol prices in Australia from 2001 to 2018. It investigates whether increases in petrol prices are justified by crude oil price fluctuations or driven by market greed. The analysis includes time series graphs, descriptive statistics, and correlation coefficients to evaluate the connection between the two variables. The findings indicate a positive correlation between crude oil and petrol prices, with petrol prices increasing at a faster rate than crude oil. The report also discusses the implications of these trends, suggesting potential government interventions like revising exercise duties and encouraging retailer competition. Limitations of the study and suggestions for future research, such as incorporating statistical tests and considering other influencing factors, are also discussed. Desklib provides access to similar solved assignments and past papers for students.
Running head: BUSINESS DATA ANALYSIS AND INTERPRETATION
Business Data Analysis and Interpretation
Name of the Student
Name of the University
Course ID
Business Data Analysis and Interpretation
Name of the Student
Name of the University
Course ID
Paraphrase This Document
Need a fresh take? Get an instant paraphrase of this document with our AI Paraphraser
1BUSINESS DATA ANALYSIS AND INTERPRETATION
Table of Contents
Introduction................................................................................................................................2
Background............................................................................................................................2
Aim and objectives.................................................................................................................2
Context.......................................................................................................................................2
World wide.............................................................................................................................2
Australia.................................................................................................................................3
Methodology..............................................................................................................................3
Data collection.......................................................................................................................3
Analysis strategy....................................................................................................................3
Analysis Results.........................................................................................................................4
Question 1..............................................................................................................................4
Question 2..............................................................................................................................4
Question 3..............................................................................................................................5
Question 4..............................................................................................................................6
Question 5..............................................................................................................................7
Question 6..............................................................................................................................9
Discussions and Conclusions.....................................................................................................9
Academic contribution...........................................................................................................9
Practical implications/recommendations.............................................................................10
Limitations and future work.................................................................................................10
References................................................................................................................................11
2BUSINESS DATA ANALYSIS AND INTERPRETATION
Introduction
Background
Petrol is a product that is used by most of the Australians. As this is one necessary
item used every day, people are very sensitive to change in petrol prices. The problem is
severe when fuels become more expensive (Wang et al., 2016). Several factors explain the
variation in crude oil and petrol price in the national and international market. Change in
petrol price is associated with a change crude oil price (Liao, Shi & Xu, 2018).
Aim and objectives
The paper investigates whether the increase in petrol price in Australia is fair or it is
the result of greed of petrol traders. This is done by analyzing the correlation between crude
oil and price. The objective is to evaluate the trend in crude oil and petrol prices and the
extent to which petrol price is related with crude oil price.
Context
World wide
In the world market, oil is a commodity that tends to experience most fluctuation. The
most remarkable increase in world price occurred between middle of 2003 and middle of
2008. The surge in oil price was resulted from a disruption in supply of oil along with
increase in demand worldwide (Baumeister & Kilian, 2016) The global economic expansion
pushed up oil demand especially from Asian economies. Another view explaining fluctuation
in world oil price point out that speculative position of financial trade in the oil market causes
instability in oil price trend (Gao et al., 2017).
⊘ This is a preview!⊘
Do you want full access?
Subscribe today to unlock all pages.
Trusted by 1+ million students worldwide
3BUSINESS DATA ANALYSIS AND INTERPRETATION
Australia
In Australia both crude oil and petrol price fluctuate widely. The price of oil though is
one major factor affecting petrol price, there are however several other factors affecting
petrol price (Chiroma, Abdulkareem & Herawan, 2015) A report published by Australian
Competition and Commission, several reasons are revealed for fluctuating petrol prices.
These include imbalances in demand and supply, fluctuation in relative value of dollar, petrol
price cycles and competition in local market (abc.net.au, 2018).
Methodology
Data collection
In order to evaluate trend in crude oil and petrol price monthly data are collected. The
paper uses secondary data for the analysis. The chosen sample period for analysis is from
2001 to 2018.
Analysis strategy
Data are analyzed using statistical software package Excel. The trend in prices are
observed using time series graph (Plonsky, 2015). Descriptive statistics are analyzed to
summarize the data. In order to evaluate the relation between crude oil price and petrol price
scatter plot, correlation coefficient and time series graphs are used.
Paraphrase This Document
Need a fresh take? Get an instant paraphrase of this document with our AI Paraphraser
4BUSINESS DATA ANALYSIS AND INTERPRETATION
Analysis Results
Question 1
1/1/2001
10/1/2001
7/1/2002
4/1/2003
1/1/2004
10/1/2004
7/1/2005
4/1/2006
1/1/2007
10/1/2007
7/1/2008
4/1/2009
1/1/2010
10/1/2010
7/1/2011
4/1/2012
1/1/2013
10/1/2013
7/1/2014
4/1/2015
1/1/2016
10/1/2016
7/1/2017
4/1/2018
0
20
40
60
80
100
120
140
160
180
Trend in crude oil and petrol price
oil_audollar petrol_price
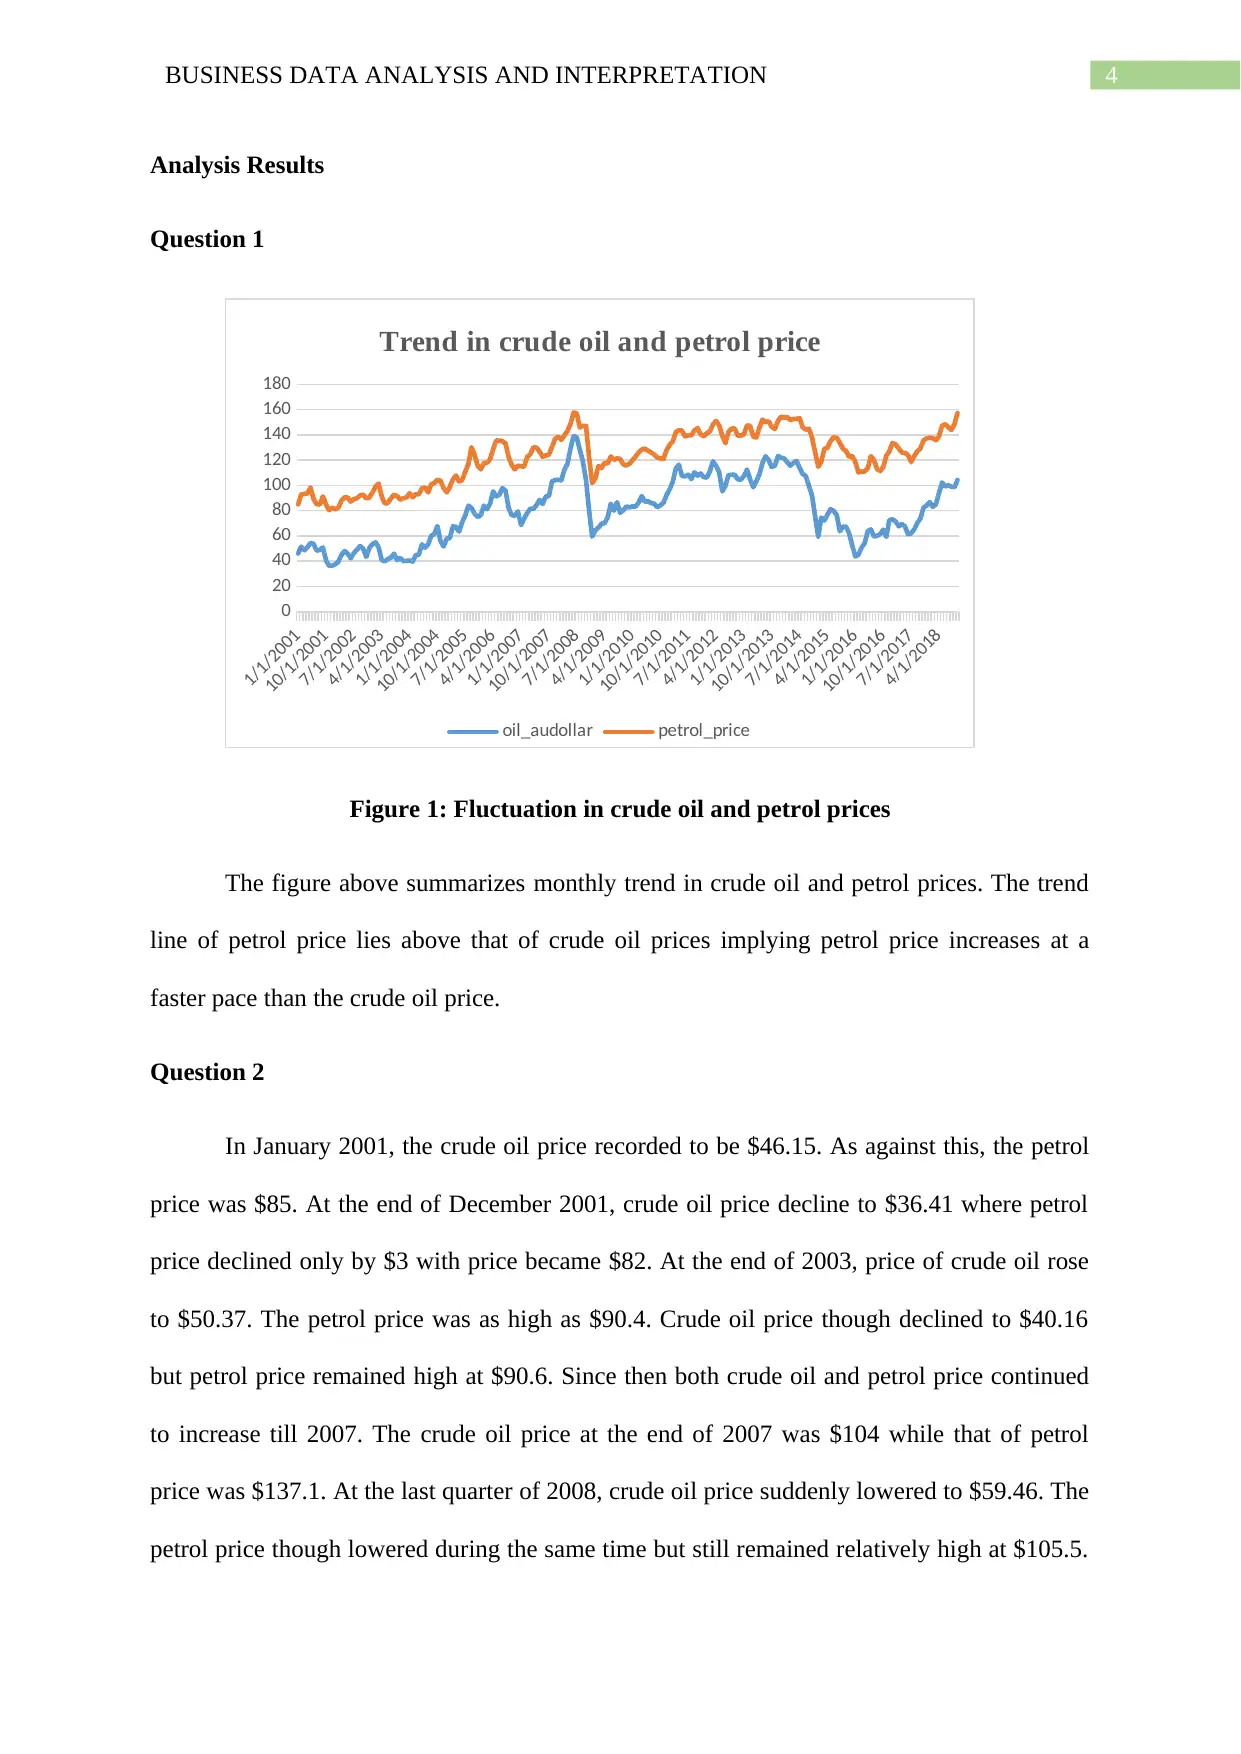
Figure 1: Fluctuation in crude oil and petrol prices
The figure above summarizes monthly trend in crude oil and petrol prices. The trend
line of petrol price lies above that of crude oil prices implying petrol price increases at a
faster pace than the crude oil price.
Question 2
In January 2001, the crude oil price recorded to be $46.15. As against this, the petrol
price was $85. At the end of December 2001, crude oil price decline to $36.41 where petrol
price declined only by $3 with price became $82. At the end of 2003, price of crude oil rose
to $50.37. The petrol price was as high as $90.4. Crude oil price though declined to $40.16
but petrol price remained high at $90.6. Since then both crude oil and petrol price continued
to increase till 2007. The crude oil price at the end of 2007 was $104 while that of petrol
price was $137.1. At the last quarter of 2008, crude oil price suddenly lowered to $59.46. The
petrol price though lowered during the same time but still remained relatively high at $105.5.
Analysis Results
Question 1
1/1/2001
10/1/2001
7/1/2002
4/1/2003
1/1/2004
10/1/2004
7/1/2005
4/1/2006
1/1/2007
10/1/2007
7/1/2008
4/1/2009
1/1/2010
10/1/2010
7/1/2011
4/1/2012
1/1/2013
10/1/2013
7/1/2014
4/1/2015
1/1/2016
10/1/2016
7/1/2017
4/1/2018
0
20
40
60
80
100
120
140
160
180
Trend in crude oil and petrol price
oil_audollar petrol_price
Figure 1: Fluctuation in crude oil and petrol prices
The figure above summarizes monthly trend in crude oil and petrol prices. The trend
line of petrol price lies above that of crude oil prices implying petrol price increases at a
faster pace than the crude oil price.
Question 2
In January 2001, the crude oil price recorded to be $46.15. As against this, the petrol
price was $85. At the end of December 2001, crude oil price decline to $36.41 where petrol
price declined only by $3 with price became $82. At the end of 2003, price of crude oil rose
to $50.37. The petrol price was as high as $90.4. Crude oil price though declined to $40.16
but petrol price remained high at $90.6. Since then both crude oil and petrol price continued
to increase till 2007. The crude oil price at the end of 2007 was $104 while that of petrol
price was $137.1. At the last quarter of 2008, crude oil price suddenly lowered to $59.46. The
petrol price though lowered during the same time but still remained relatively high at $105.5.
5BUSINESS DATA ANALYSIS AND INTERPRETATION
Both crude oil and petrol price recovered since 2009 and continued to increase till 2013. The
two consecutive years of 2014 and 2015 experienced a decline in crude oil and petrol price
due to different global and international events. From 2016 onwards, price again started to
regain. In the last quarter of 2018, crude oil price was $104.29 while petrol price was $157.3.
Question 3
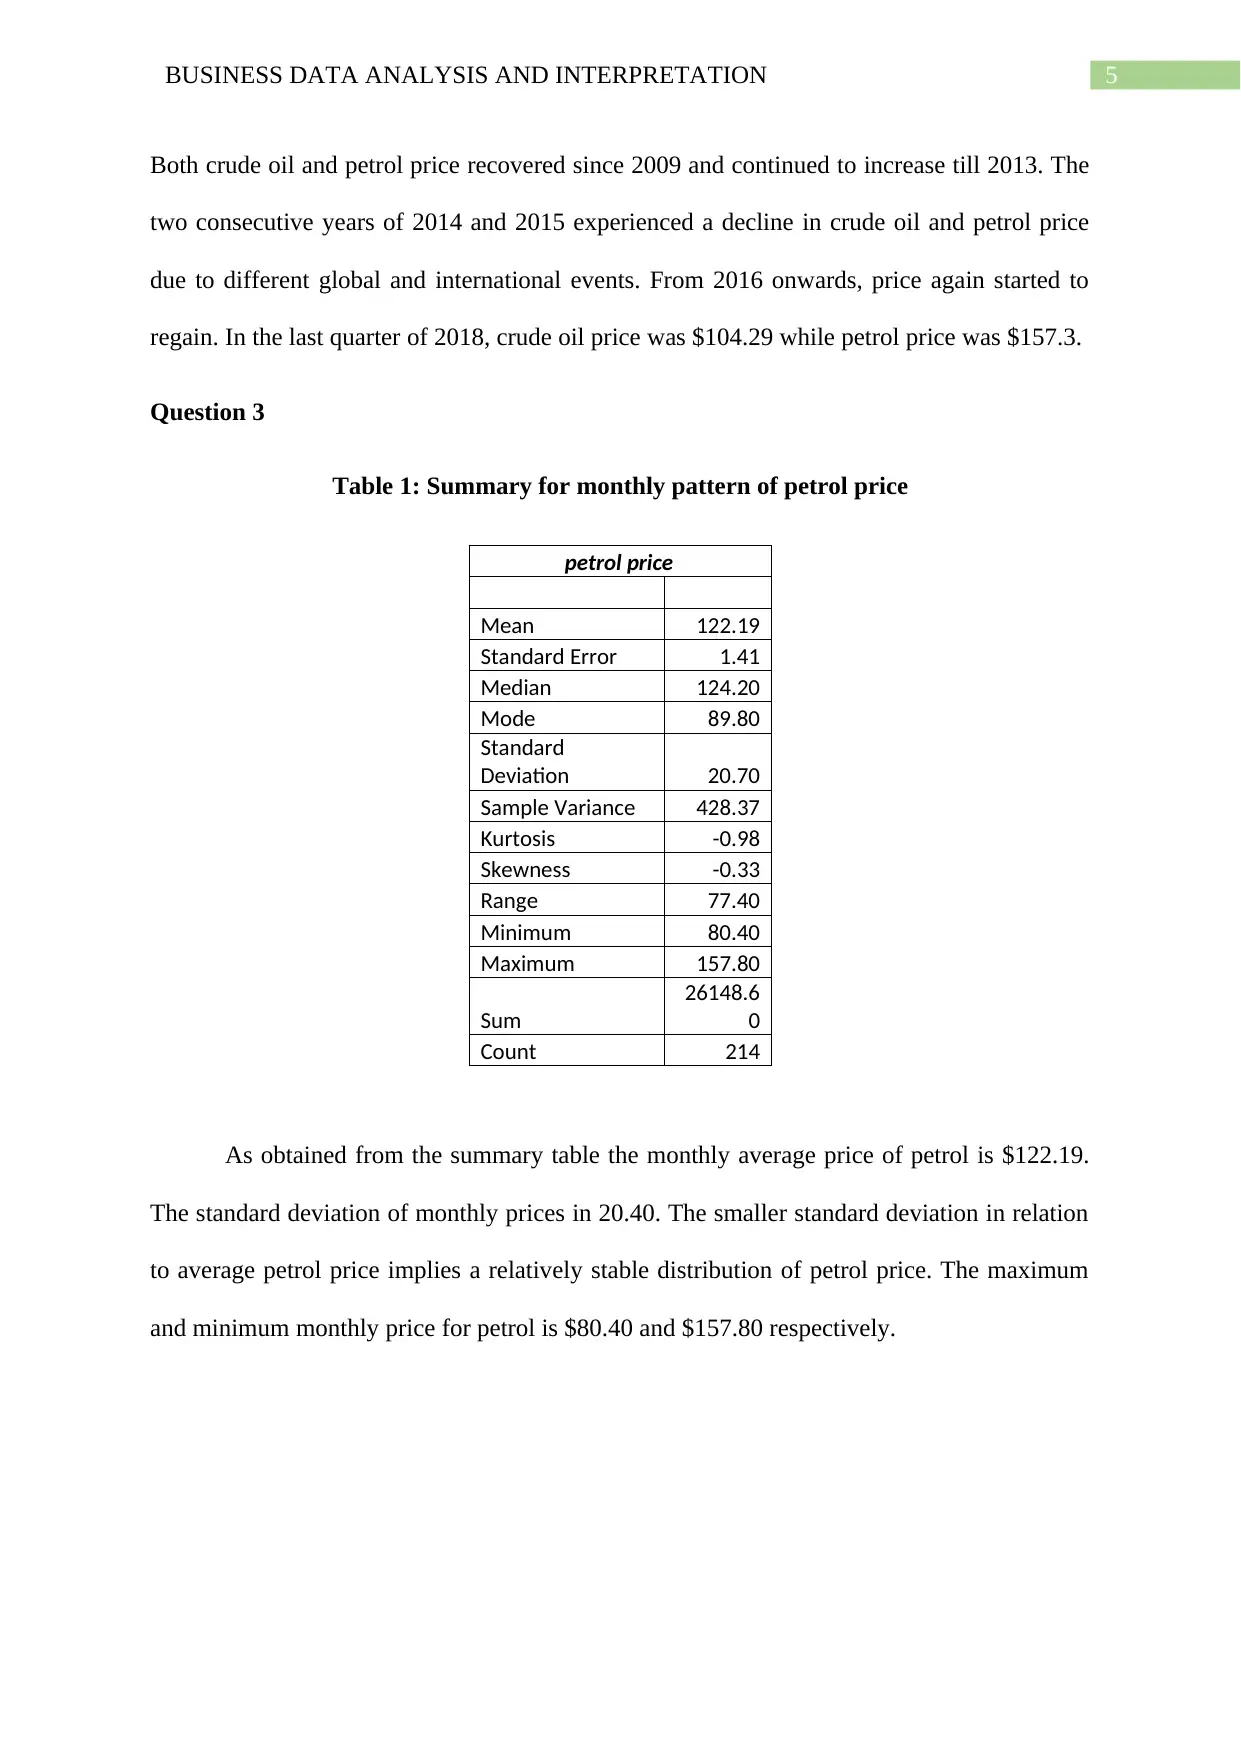
Table 1: Summary for monthly pattern of petrol price
petrol price
Mean 122.19
Standard Error 1.41
Median 124.20
Mode 89.80
Standard
Deviation 20.70
Sample Variance 428.37
Kurtosis -0.98
Skewness -0.33
Range 77.40
Minimum 80.40
Maximum 157.80
Sum
26148.6
0
Count 214
As obtained from the summary table the monthly average price of petrol is $122.19.
The standard deviation of monthly prices in 20.40. The smaller standard deviation in relation
to average petrol price implies a relatively stable distribution of petrol price. The maximum
and minimum monthly price for petrol is $80.40 and $157.80 respectively.
Both crude oil and petrol price recovered since 2009 and continued to increase till 2013. The
two consecutive years of 2014 and 2015 experienced a decline in crude oil and petrol price
due to different global and international events. From 2016 onwards, price again started to
regain. In the last quarter of 2018, crude oil price was $104.29 while petrol price was $157.3.
Question 3
Table 1: Summary for monthly pattern of petrol price
petrol price
Mean 122.19
Standard Error 1.41
Median 124.20
Mode 89.80
Standard
Deviation 20.70
Sample Variance 428.37
Kurtosis -0.98
Skewness -0.33
Range 77.40
Minimum 80.40
Maximum 157.80
Sum
26148.6
0
Count 214
As obtained from the summary table the monthly average price of petrol is $122.19.
The standard deviation of monthly prices in 20.40. The smaller standard deviation in relation
to average petrol price implies a relatively stable distribution of petrol price. The maximum
and minimum monthly price for petrol is $80.40 and $157.80 respectively.
⊘ This is a preview!⊘
Do you want full access?
Subscribe today to unlock all pages.
Trusted by 1+ million students worldwide
6BUSINESS DATA ANALYSIS AND INTERPRETATION
1/1/2001
10/1/2001
7/1/2002
4/1/2003
1/1/2004
10/1/2004
7/1/2005
4/1/2006
1/1/2007
10/1/2007
7/1/2008
4/1/2009
1/1/2010
10/1/2010
7/1/2011
4/1/2012
1/1/2013
10/1/2013
7/1/2014
4/1/2015
1/1/2016
10/1/2016
7/1/2017
4/1/2018
0
20
40
60
80
100
120
140
160
180
Trend in Petrol Price
Figure 2: Monthly pattern of petrol price
The figure above shows an overall upward rising trend in monthly petrol price.
Question 4
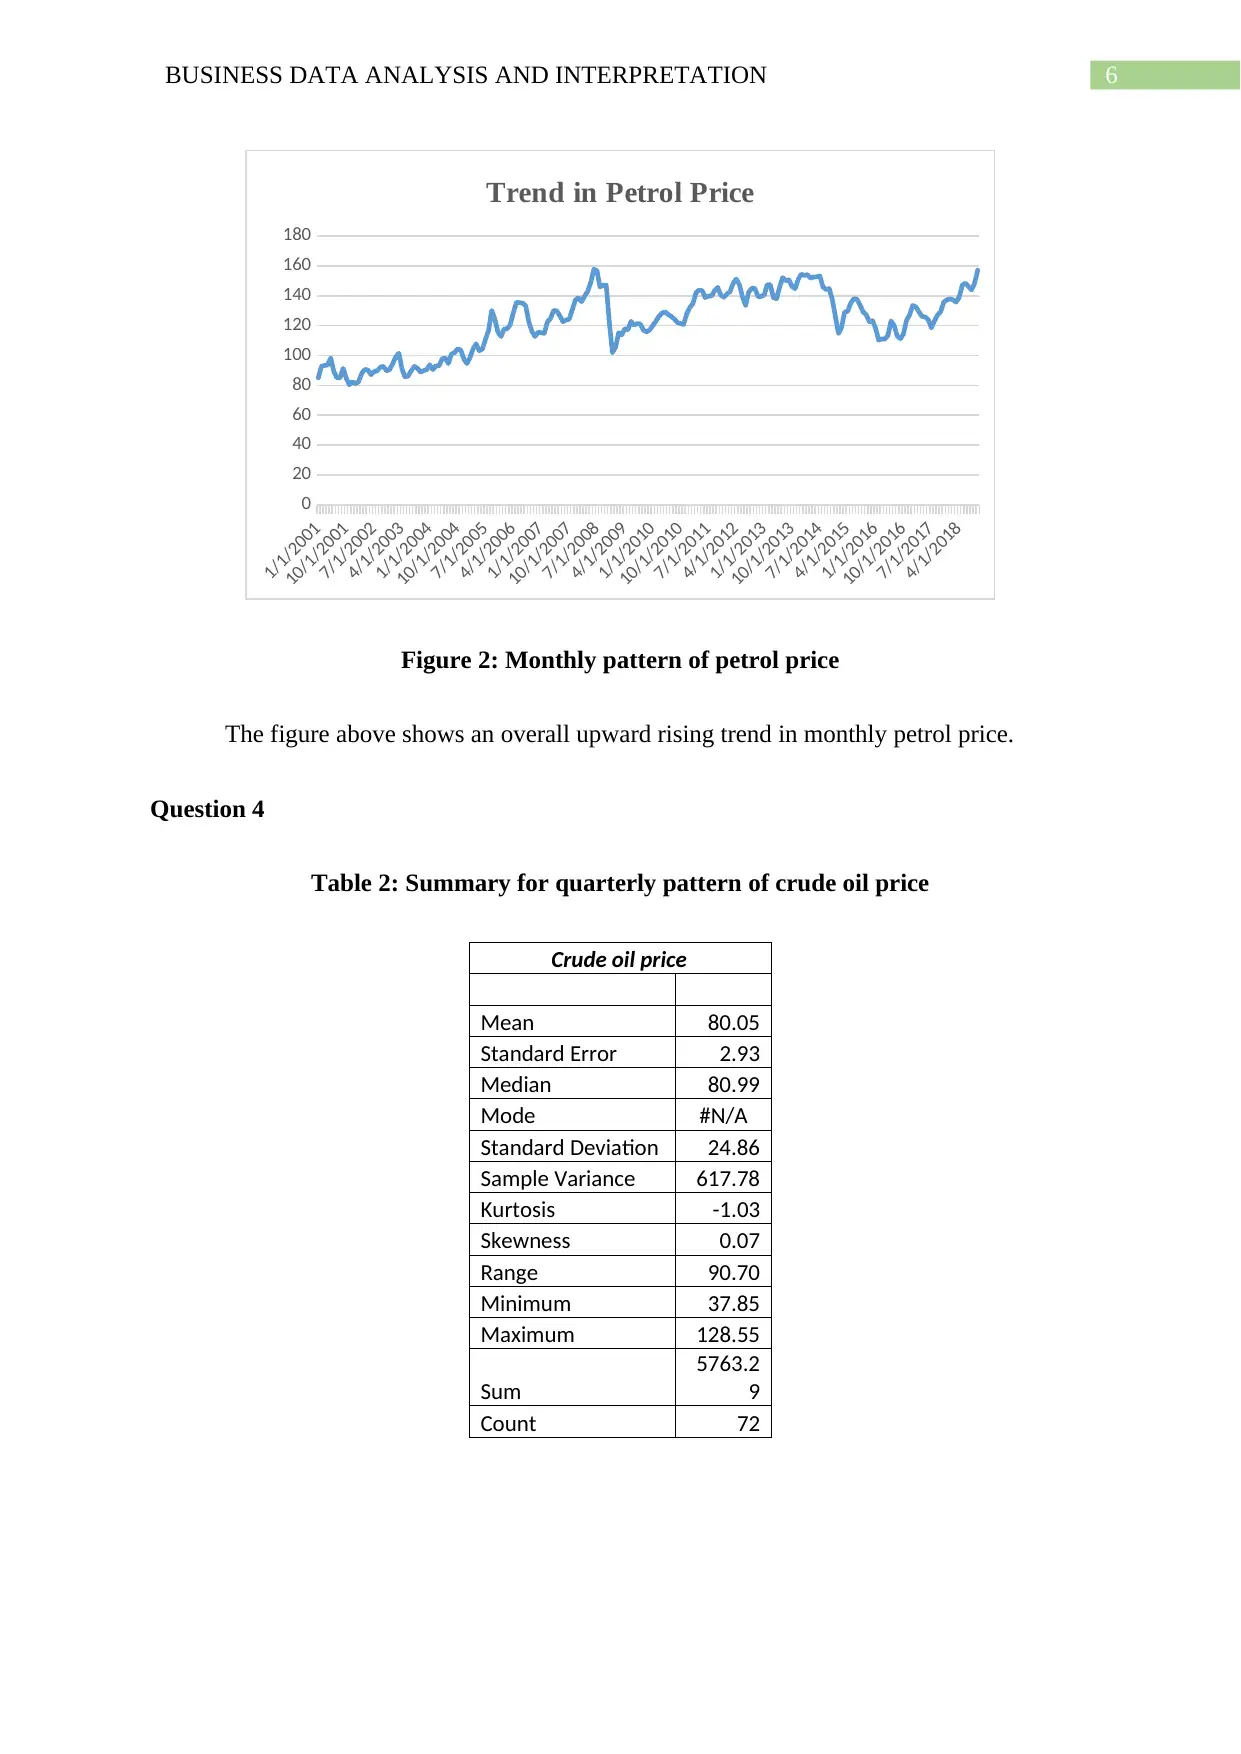
Table 2: Summary for quarterly pattern of crude oil price
Crude oil price
Mean 80.05
Standard Error 2.93
Median 80.99
Mode #N/A
Standard Deviation 24.86
Sample Variance 617.78
Kurtosis -1.03
Skewness 0.07
Range 90.70
Minimum 37.85
Maximum 128.55
Sum
5763.2
9
Count 72
1/1/2001
10/1/2001
7/1/2002
4/1/2003
1/1/2004
10/1/2004
7/1/2005
4/1/2006
1/1/2007
10/1/2007
7/1/2008
4/1/2009
1/1/2010
10/1/2010
7/1/2011
4/1/2012
1/1/2013
10/1/2013
7/1/2014
4/1/2015
1/1/2016
10/1/2016
7/1/2017
4/1/2018
0
20
40
60
80
100
120
140
160
180
Trend in Petrol Price
Figure 2: Monthly pattern of petrol price
The figure above shows an overall upward rising trend in monthly petrol price.
Question 4
Table 2: Summary for quarterly pattern of crude oil price
Crude oil price
Mean 80.05
Standard Error 2.93
Median 80.99
Mode #N/A
Standard Deviation 24.86
Sample Variance 617.78
Kurtosis -1.03
Skewness 0.07
Range 90.70
Minimum 37.85
Maximum 128.55
Sum
5763.2
9
Count 72
Paraphrase This Document
Need a fresh take? Get an instant paraphrase of this document with our AI Paraphraser
7BUSINESS DATA ANALYSIS AND INTERPRETATION
The quarterly average of price of crude oil is $80.05. The standard deviation is 24.86.
The smaller standard deviation implies a smaller coefficient of variation and hence, a stable
distribution.
1st_2001
4th_2001
3rd_2002
2nd_2003
1st_2004
4th_2004
3rd_2005
2nd_2006
1st_2007
4th_2007
3rd_2008
2nd_2009
1st_2010
4th_2010
3rd_2011
2nd_2012
1st_2013
4th_2013
3rd_2014
2nd_2015
1st_2016
4th_2016
3rd_2017
2nd_2018
0
20
40
60
80
100
120
140
Crude oil price
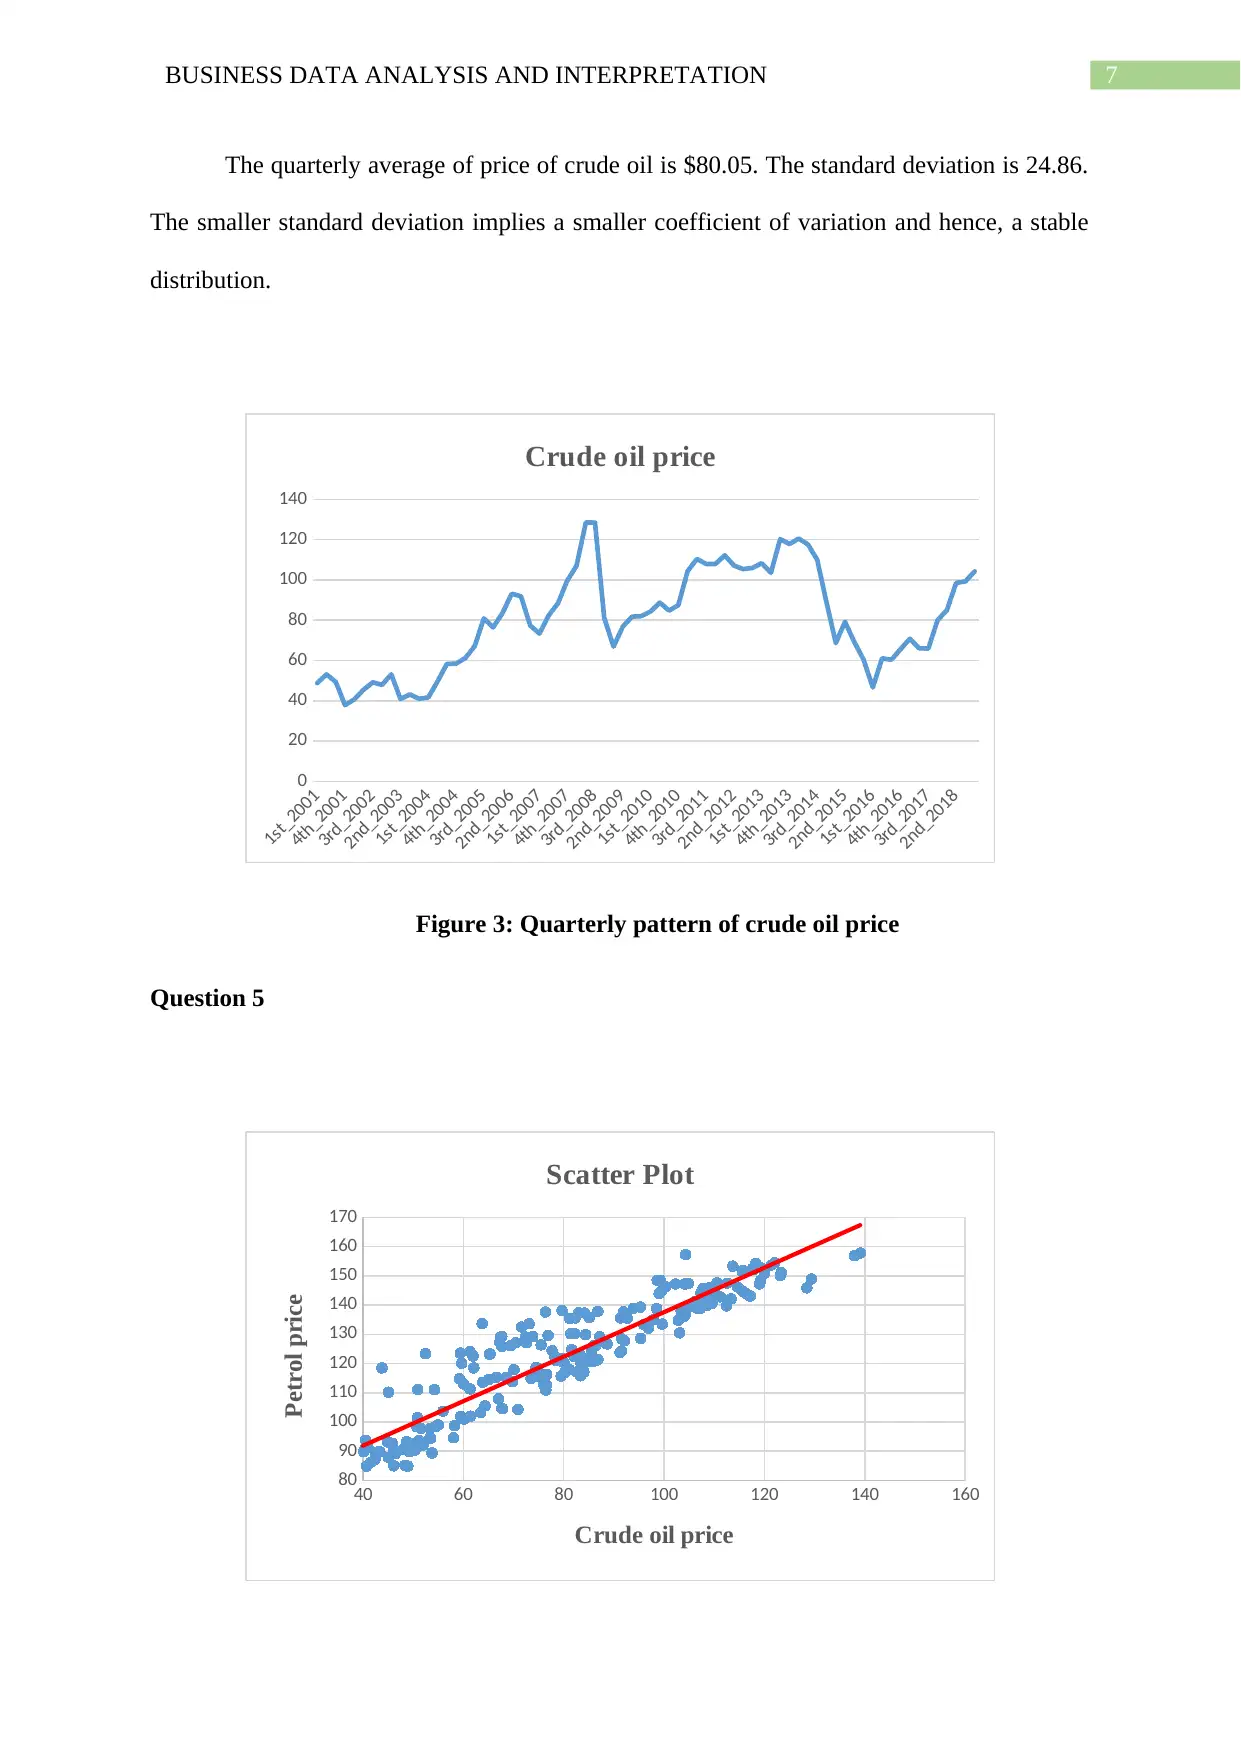
Figure 3: Quarterly pattern of crude oil price
Question 5
40 60 80 100 120 140 160
80
90
100
110
120
130
140
150
160
170
Scatter Plot
Crude oil price
Petrol price
The quarterly average of price of crude oil is $80.05. The standard deviation is 24.86.
The smaller standard deviation implies a smaller coefficient of variation and hence, a stable
distribution.
1st_2001
4th_2001
3rd_2002
2nd_2003
1st_2004
4th_2004
3rd_2005
2nd_2006
1st_2007
4th_2007
3rd_2008
2nd_2009
1st_2010
4th_2010
3rd_2011
2nd_2012
1st_2013
4th_2013
3rd_2014
2nd_2015
1st_2016
4th_2016
3rd_2017
2nd_2018
0
20
40
60
80
100
120
140
Crude oil price
Figure 3: Quarterly pattern of crude oil price
Question 5
40 60 80 100 120 140 160
80
90
100
110
120
130
140
150
160
170
Scatter Plot
Crude oil price
Petrol price
8BUSINESS DATA ANALYSIS AND INTERPRETATION
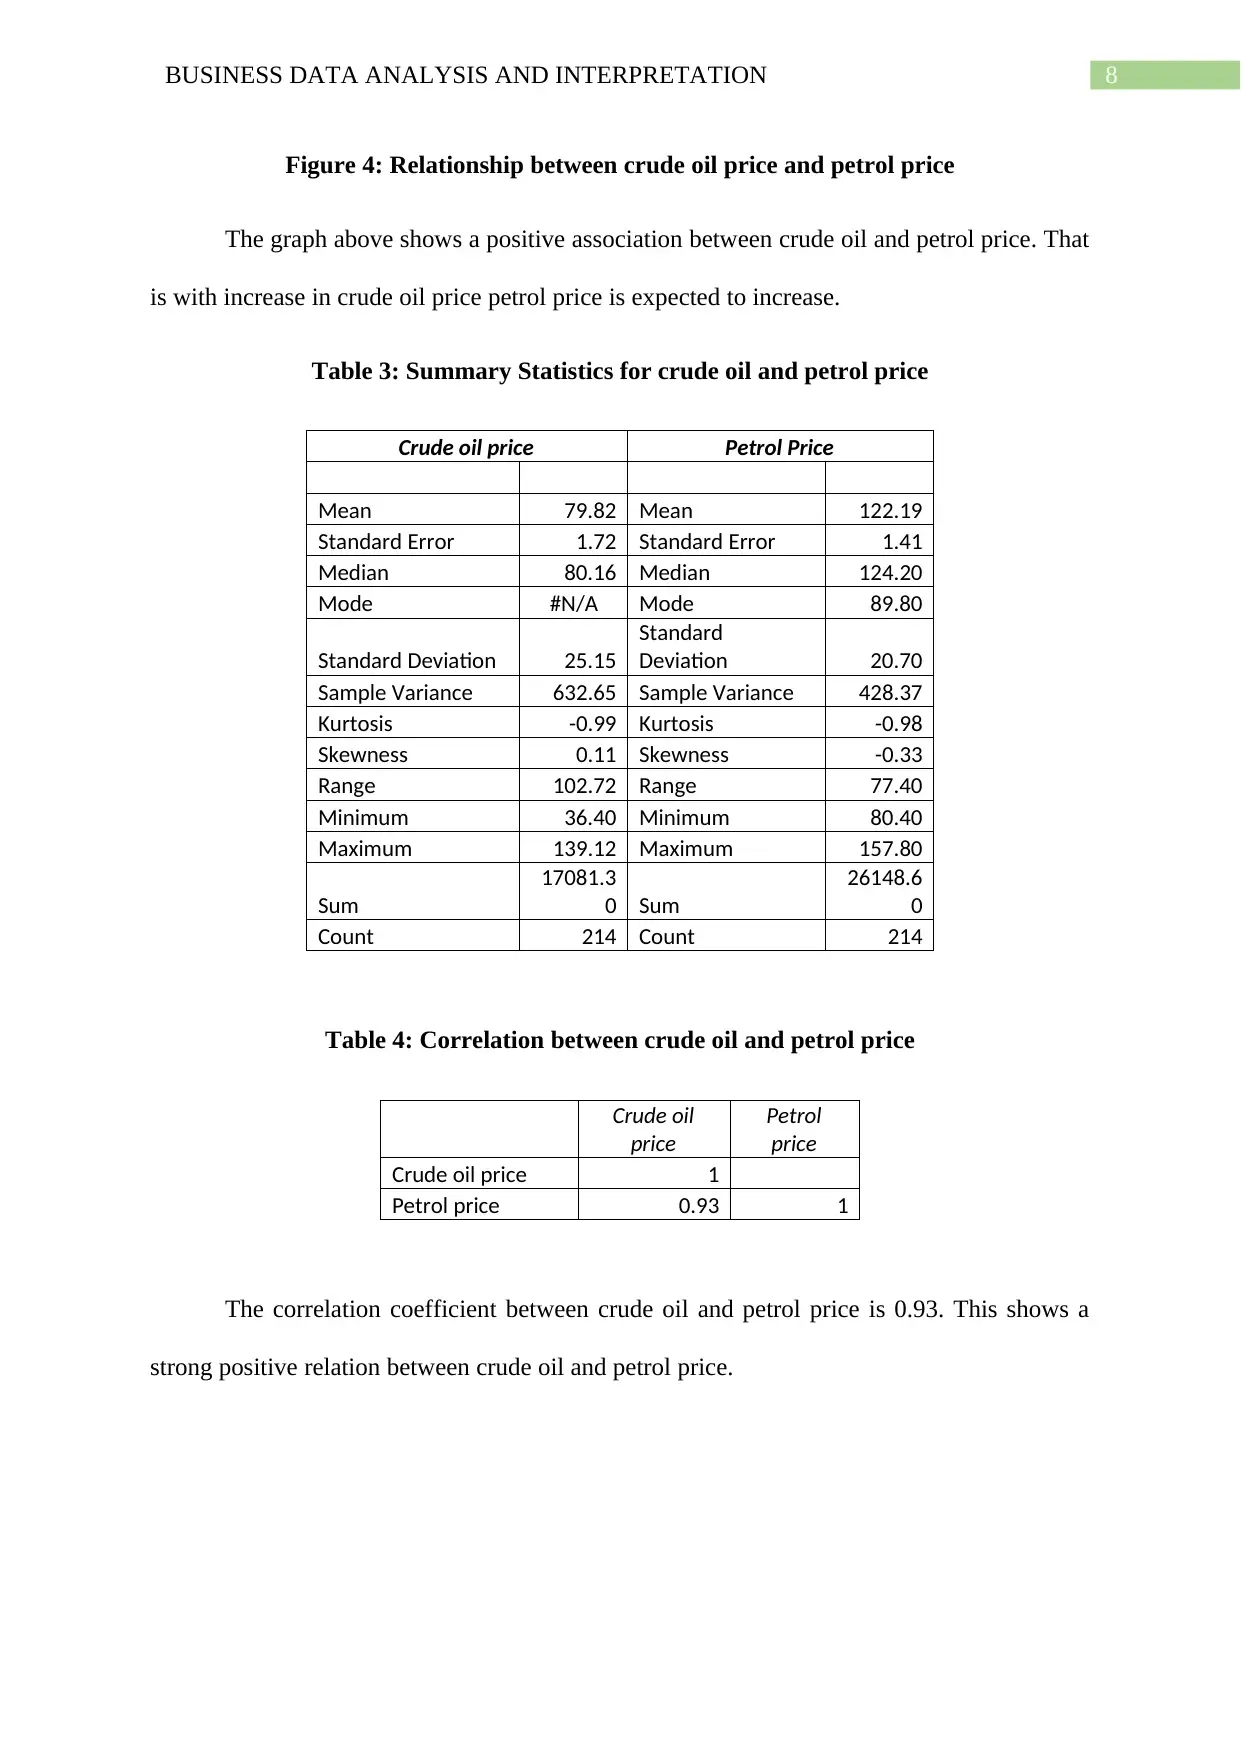
Figure 4: Relationship between crude oil price and petrol price
The graph above shows a positive association between crude oil and petrol price. That
is with increase in crude oil price petrol price is expected to increase.
Table 3: Summary Statistics for crude oil and petrol price
Crude oil price Petrol Price
Mean 79.82 Mean 122.19
Standard Error 1.72 Standard Error 1.41
Median 80.16 Median 124.20
Mode #N/A Mode 89.80
Standard Deviation 25.15
Standard
Deviation 20.70
Sample Variance 632.65 Sample Variance 428.37
Kurtosis -0.99 Kurtosis -0.98
Skewness 0.11 Skewness -0.33
Range 102.72 Range 77.40
Minimum 36.40 Minimum 80.40
Maximum 139.12 Maximum 157.80
Sum
17081.3
0 Sum
26148.6
0
Count 214 Count 214
Table 4: Correlation between crude oil and petrol price
Crude oil
price
Petrol
price
Crude oil price 1
Petrol price 0.93 1
The correlation coefficient between crude oil and petrol price is 0.93. This shows a
strong positive relation between crude oil and petrol price.
⊘ This is a preview!⊘
Do you want full access?
Subscribe today to unlock all pages.
Trusted by 1+ million students worldwide
9BUSINESS DATA ANALYSIS AND INTERPRETATION
Question 6
40.00 50.00 60.00 70.00 80.00 90.00 100.00 110.00 120.00
80.00
90.00
100.00
110.00
120.00
130.00
140.00
150.00
160.00
Scatter Plot
Crude oil price
Petrol price
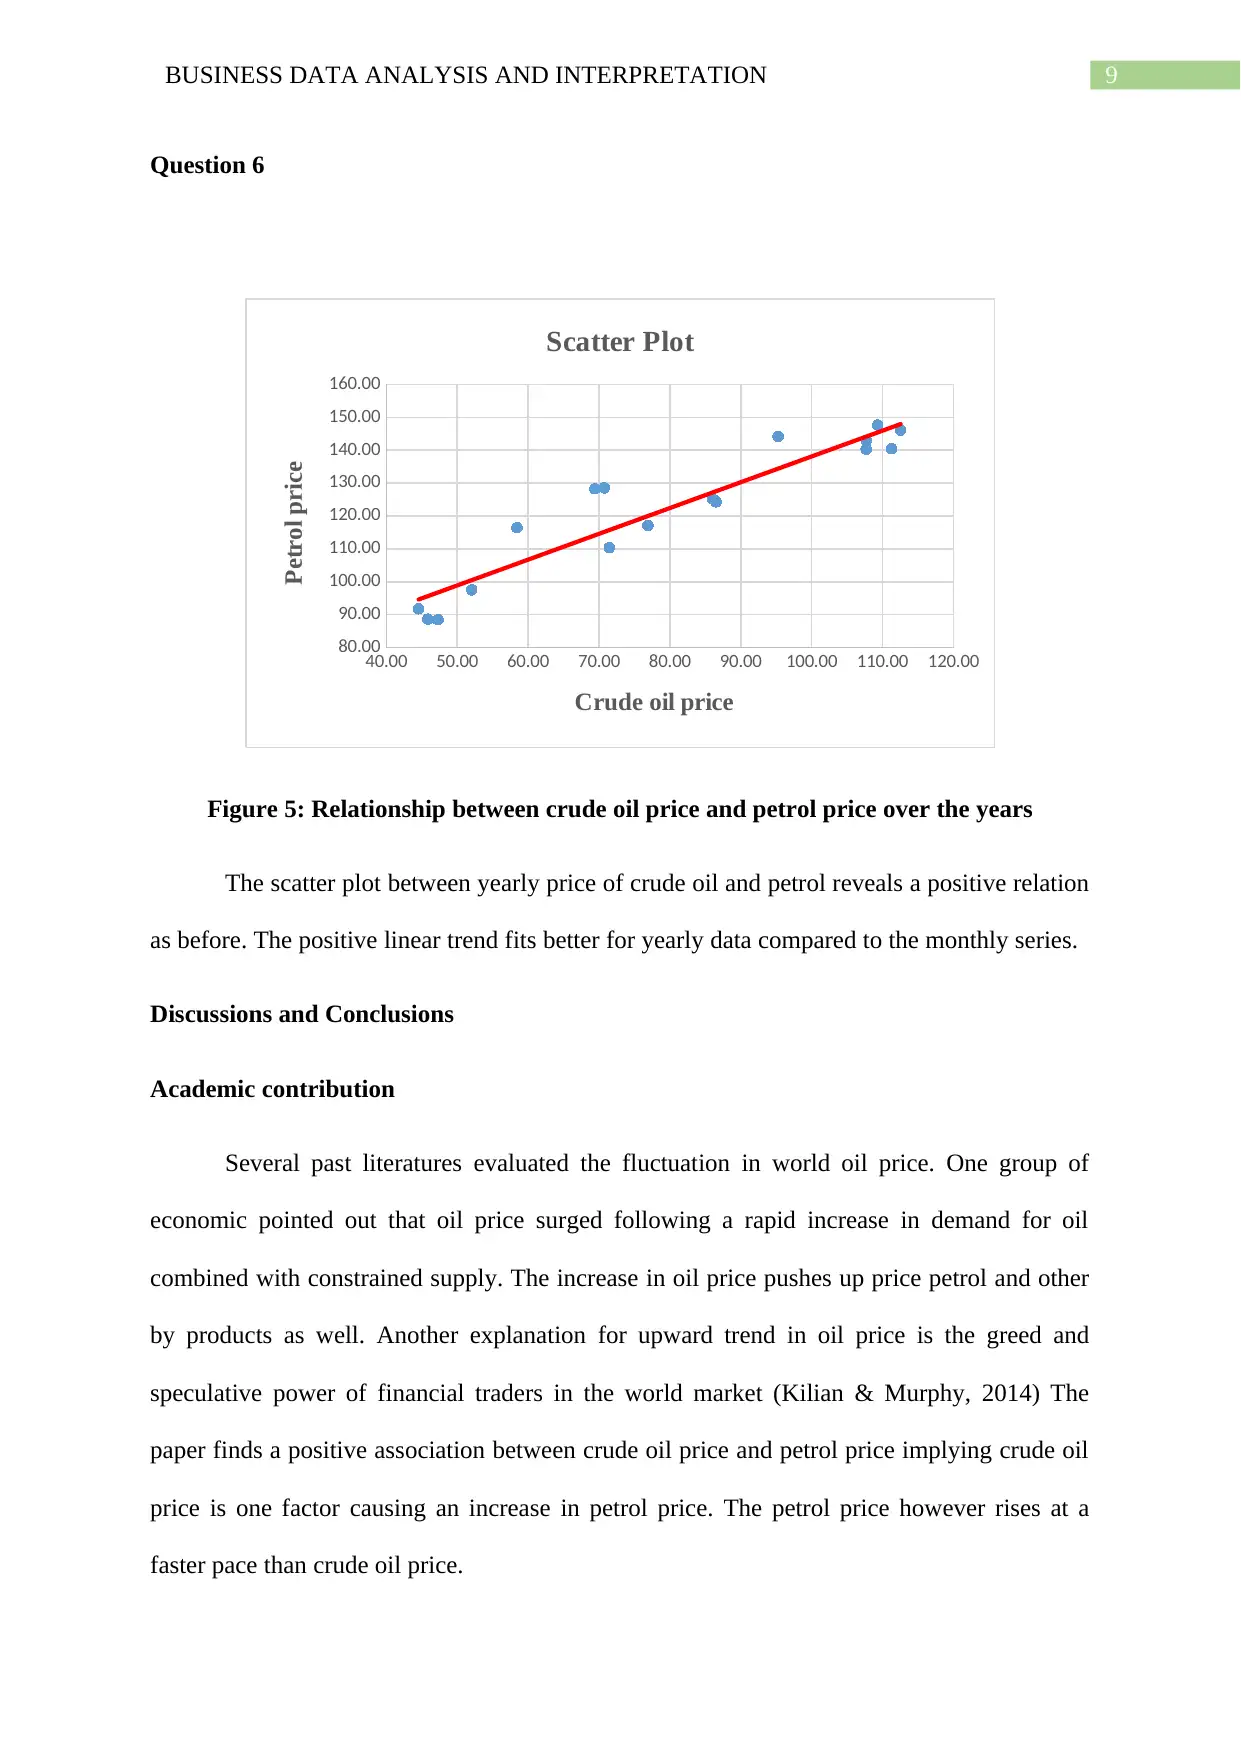
Figure 5: Relationship between crude oil price and petrol price over the years
The scatter plot between yearly price of crude oil and petrol reveals a positive relation
as before. The positive linear trend fits better for yearly data compared to the monthly series.
Discussions and Conclusions
Academic contribution
Several past literatures evaluated the fluctuation in world oil price. One group of
economic pointed out that oil price surged following a rapid increase in demand for oil
combined with constrained supply. The increase in oil price pushes up price petrol and other
by products as well. Another explanation for upward trend in oil price is the greed and
speculative power of financial traders in the world market (Kilian & Murphy, 2014) The
paper finds a positive association between crude oil price and petrol price implying crude oil
price is one factor causing an increase in petrol price. The petrol price however rises at a
faster pace than crude oil price.
Question 6
40.00 50.00 60.00 70.00 80.00 90.00 100.00 110.00 120.00
80.00
90.00
100.00
110.00
120.00
130.00
140.00
150.00
160.00
Scatter Plot
Crude oil price
Petrol price
Figure 5: Relationship between crude oil price and petrol price over the years
The scatter plot between yearly price of crude oil and petrol reveals a positive relation
as before. The positive linear trend fits better for yearly data compared to the monthly series.
Discussions and Conclusions
Academic contribution
Several past literatures evaluated the fluctuation in world oil price. One group of
economic pointed out that oil price surged following a rapid increase in demand for oil
combined with constrained supply. The increase in oil price pushes up price petrol and other
by products as well. Another explanation for upward trend in oil price is the greed and
speculative power of financial traders in the world market (Kilian & Murphy, 2014) The
paper finds a positive association between crude oil price and petrol price implying crude oil
price is one factor causing an increase in petrol price. The petrol price however rises at a
faster pace than crude oil price.
Paraphrase This Document
Need a fresh take? Get an instant paraphrase of this document with our AI Paraphraser
10BUSINESS DATA ANALYSIS AND INTERPRETATION
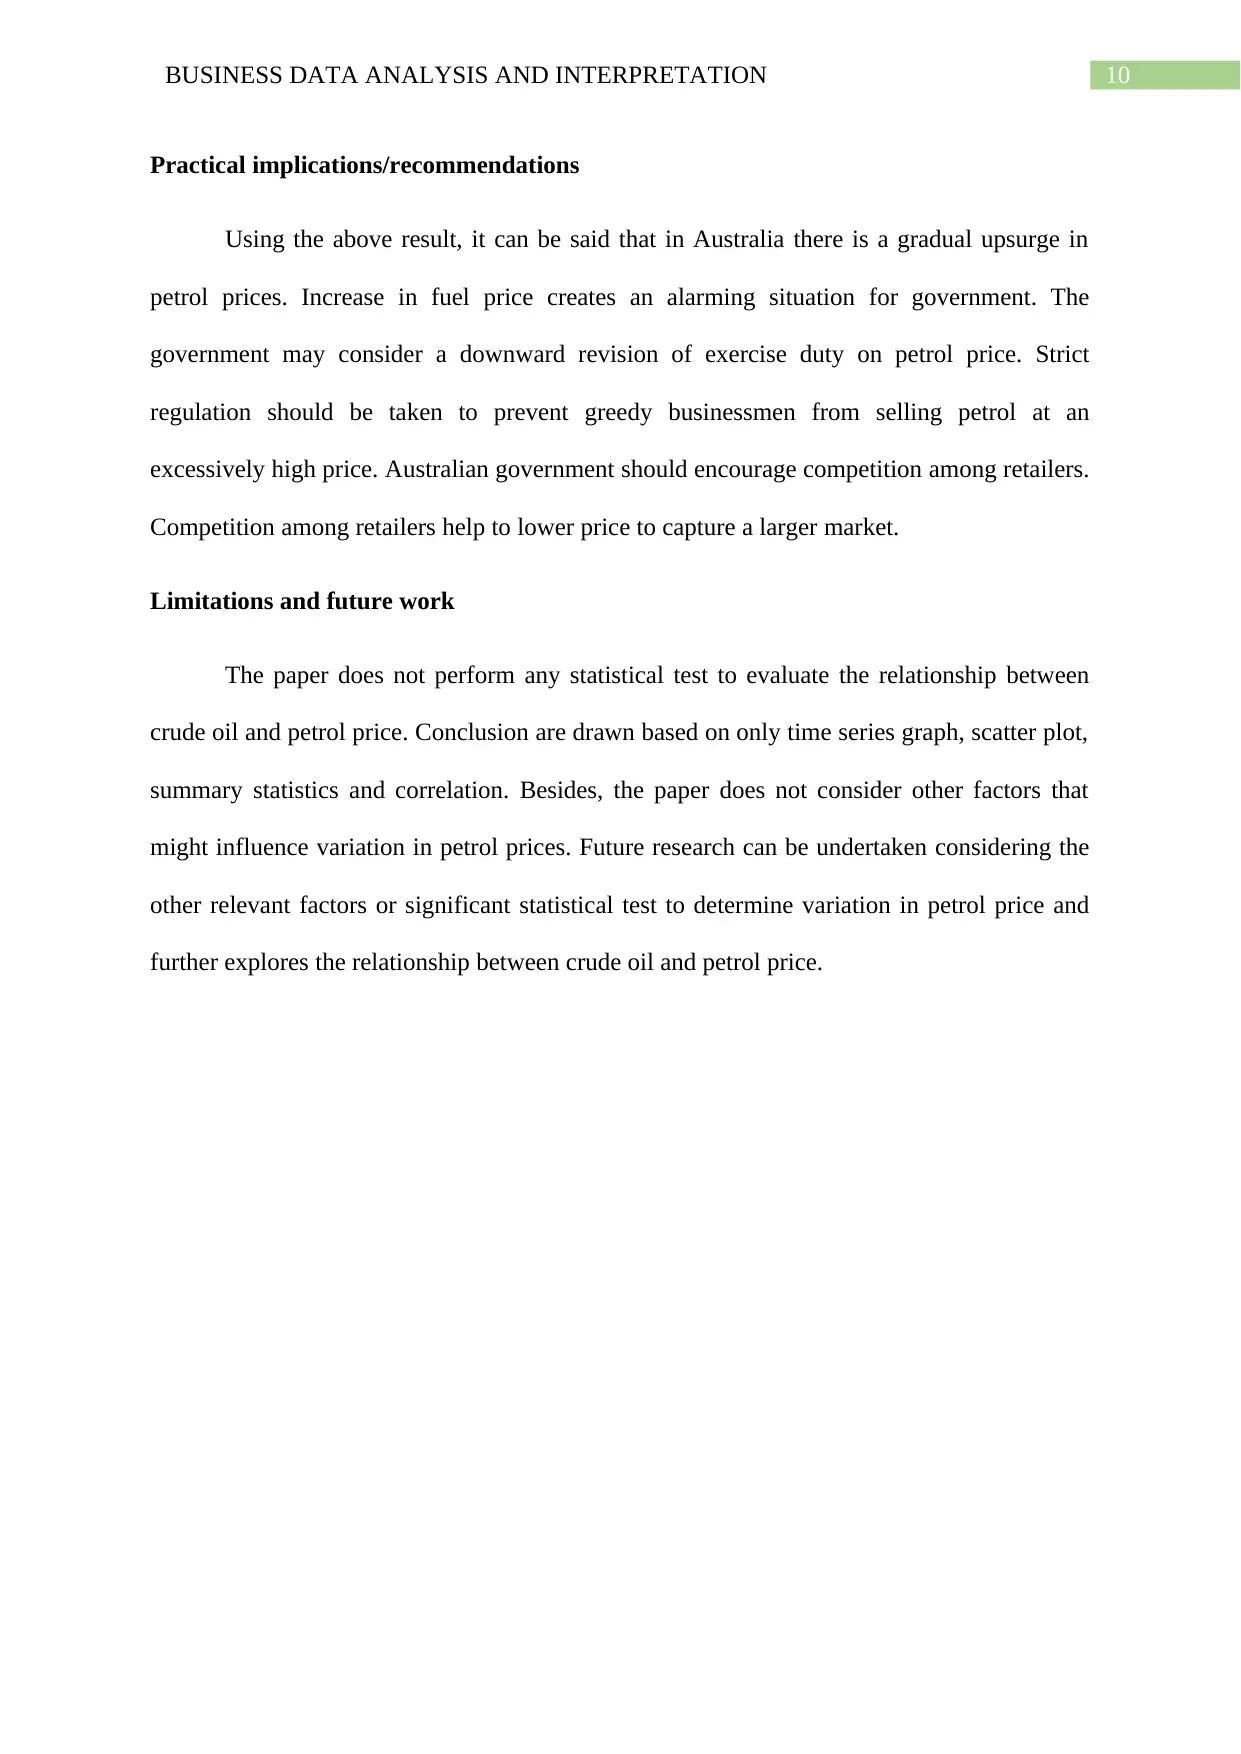
Practical implications/recommendations
Using the above result, it can be said that in Australia there is a gradual upsurge in
petrol prices. Increase in fuel price creates an alarming situation for government. The
government may consider a downward revision of exercise duty on petrol price. Strict
regulation should be taken to prevent greedy businessmen from selling petrol at an
excessively high price. Australian government should encourage competition among retailers.
Competition among retailers help to lower price to capture a larger market.
Limitations and future work
The paper does not perform any statistical test to evaluate the relationship between
crude oil and petrol price. Conclusion are drawn based on only time series graph, scatter plot,
summary statistics and correlation. Besides, the paper does not consider other factors that
might influence variation in petrol prices. Future research can be undertaken considering the
other relevant factors or significant statistical test to determine variation in petrol price and
further explores the relationship between crude oil and petrol price.
11BUSINESS DATA ANALYSIS AND INTERPRETATION
References
abc.net.au. (2018). Why do petrol prices fluctuate from city to city, day to day?. Retrieved
from https://www.abc.net.au/news/2015-01-07/why-do-petrol-prices-fluctuate-
around-the-country/6004866
Baumeister, C., & Kilian, L. (2016). Forty years of oil price fluctuations: Why the price of oil
may still surprise us. Journal of Economic Perspectives, 30(1), 139-60.
Chiroma, H., Abdulkareem, S., & Herawan, T. (2015). Evolutionary Neural Network model
for West Texas Intermediate crude oil price prediction. Applied Energy, 142, 266-273.
Gao, X., Fang, W., An, F., & Wang, Y. (2017). Detecting method for crude oil price
fluctuation mechanism under different periodic time series. Applied energy, 192, 201-
212.
Kilian, L., & Murphy, D. P. (2014). The role of inventories and speculative trading in the
global market for crude oil. Journal of Applied Econometrics, 29(3), 454-478.
Liao, J., Shi, Y., & Xu, X. (2018). Why Is the Correlation between Crude Oil Prices and the
US Dollar Exchange Rate Time-Varying?—Explanations Based on the Role of Key
Mediators. International Journal of Financial Studies, 6(3), 61.
Plonsky, L. (2015). Advancing quantitative methods in second language research. Routledge.
Wang, M., Chen, Y., Tian, L., Jiang, S., Tian, Z., & Du, R. (2016). Fluctuation behavior
analysis of international crude oil and gasoline price based on complex network
perspective. Applied Energy, 175, 109-127.
⊘ This is a preview!⊘
Do you want full access?
Subscribe today to unlock all pages.
Trusted by 1+ million students worldwide
1 out of 12
Related Documents


Your All-in-One AI-Powered Toolkit for Academic Success.
+13062052269
info@desklib.com
Available 24*7 on WhatsApp / Email
![[object Object]](/_next/static/media/star-bottom.7253800d.svg)
Unlock your academic potential
Copyright © 2020–2026 A2Z Services. All Rights Reserved. Developed and managed by ZUCOL.