Tax Policy in Australia: Analysis and International System Comparison
VerifiedAdded on 2022/08/25
|10
|1719
|21
Report
AI Summary
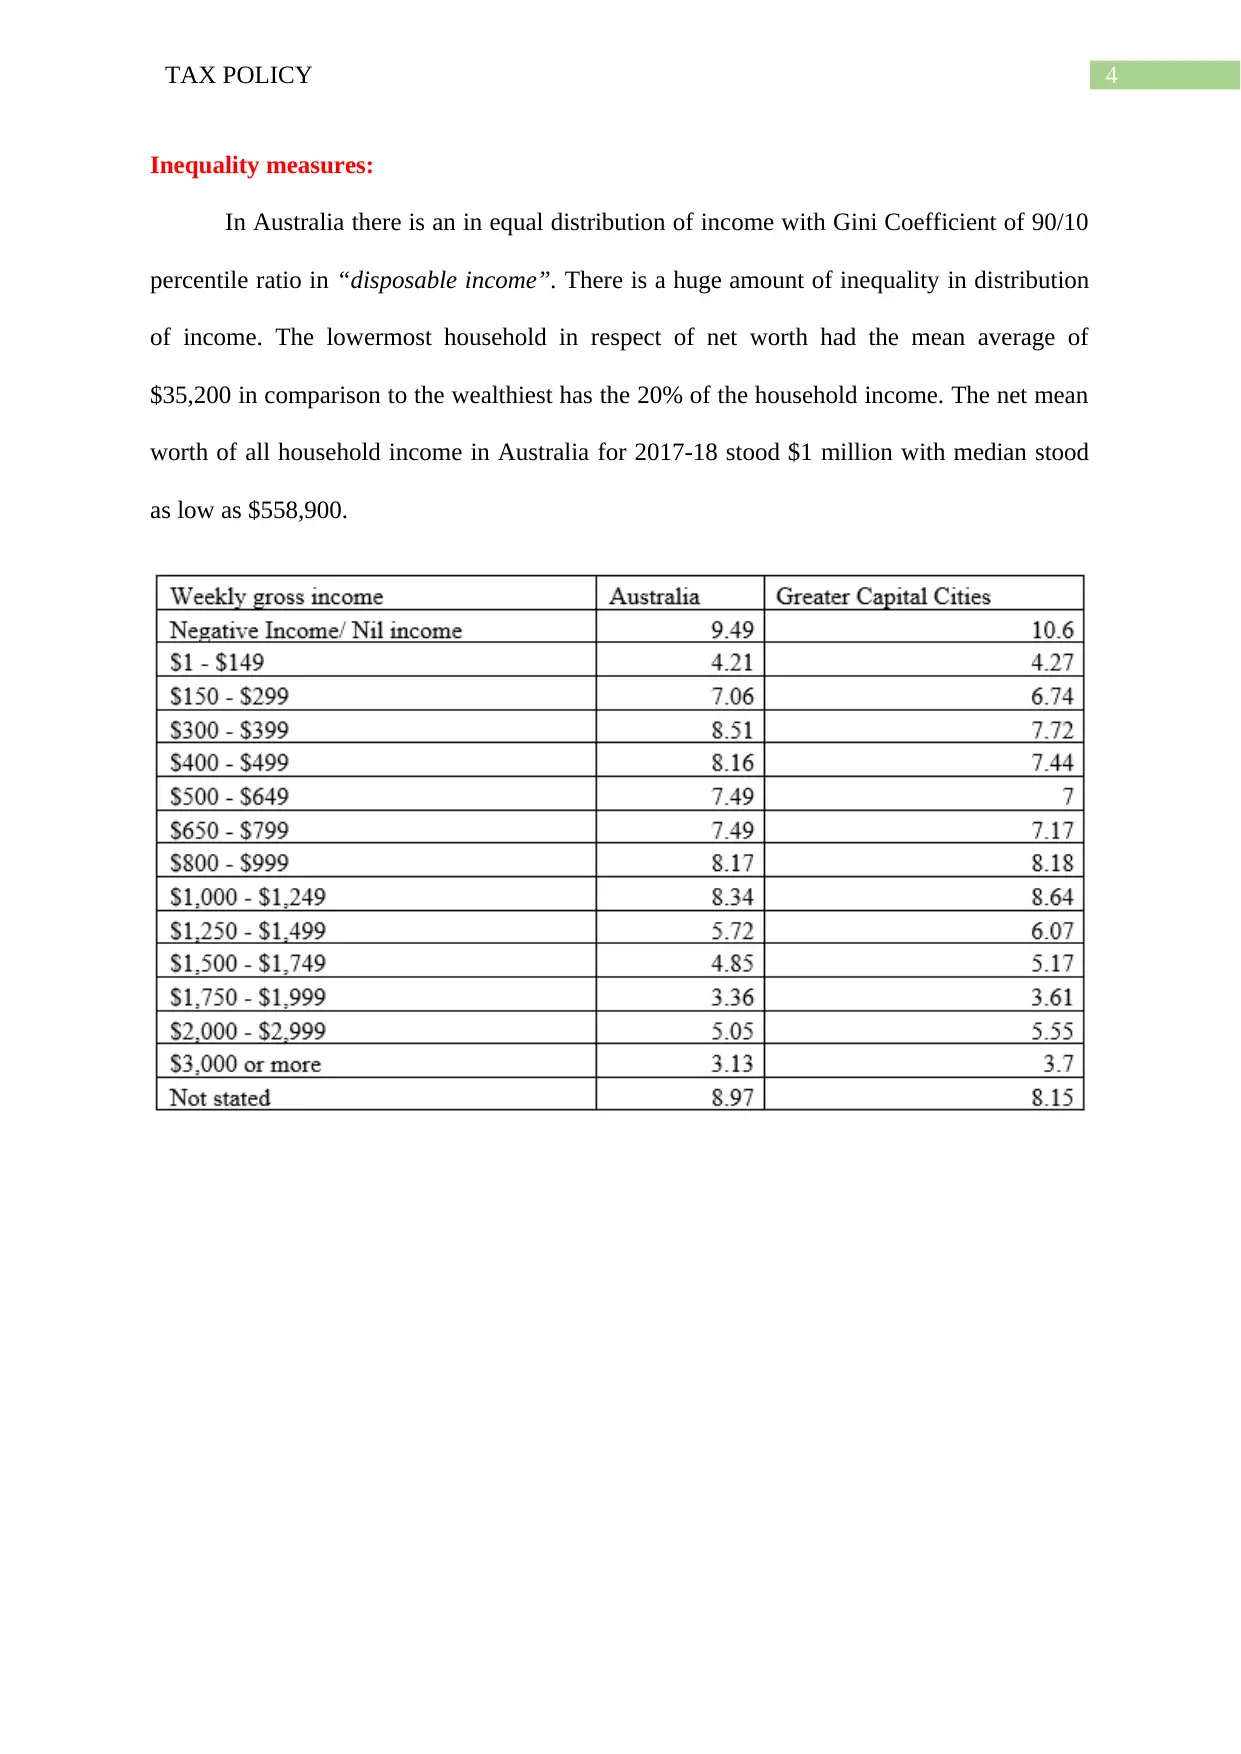
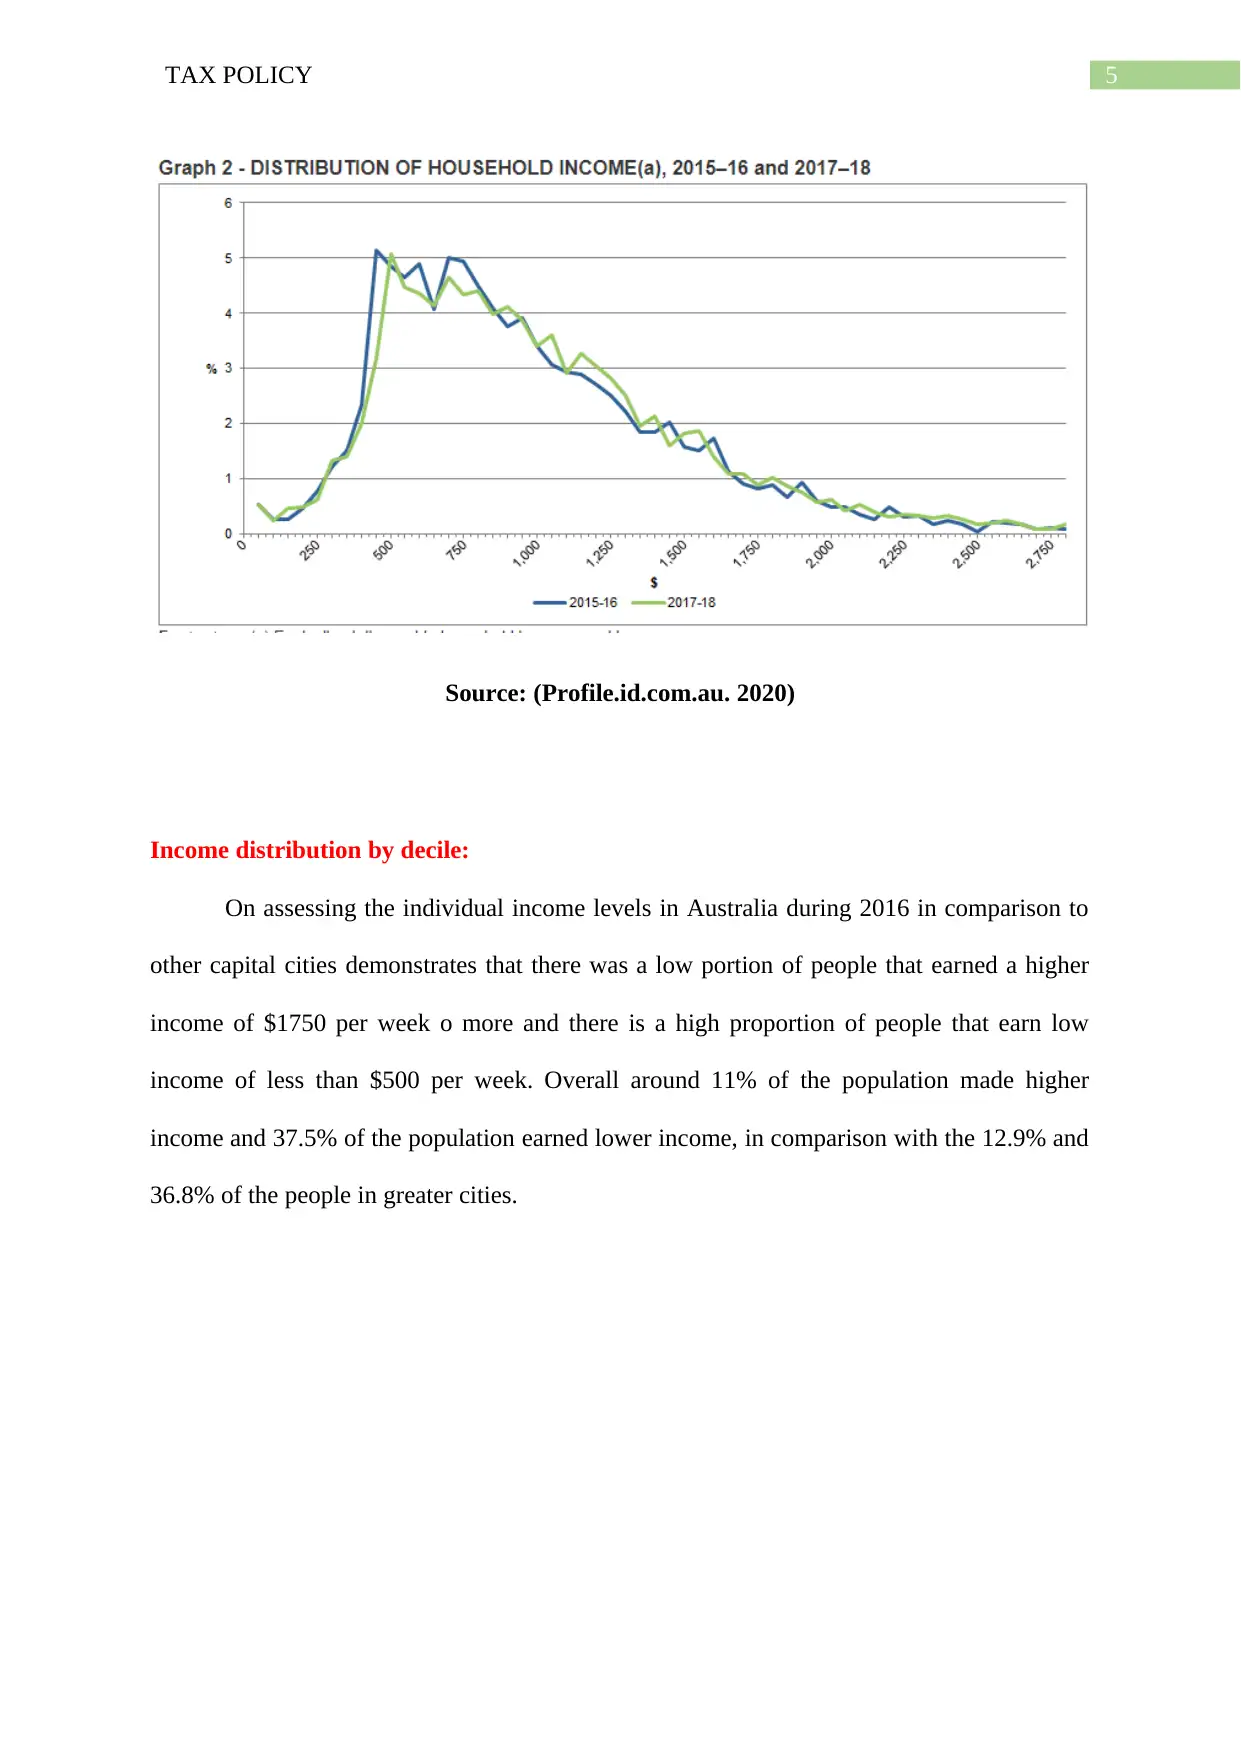
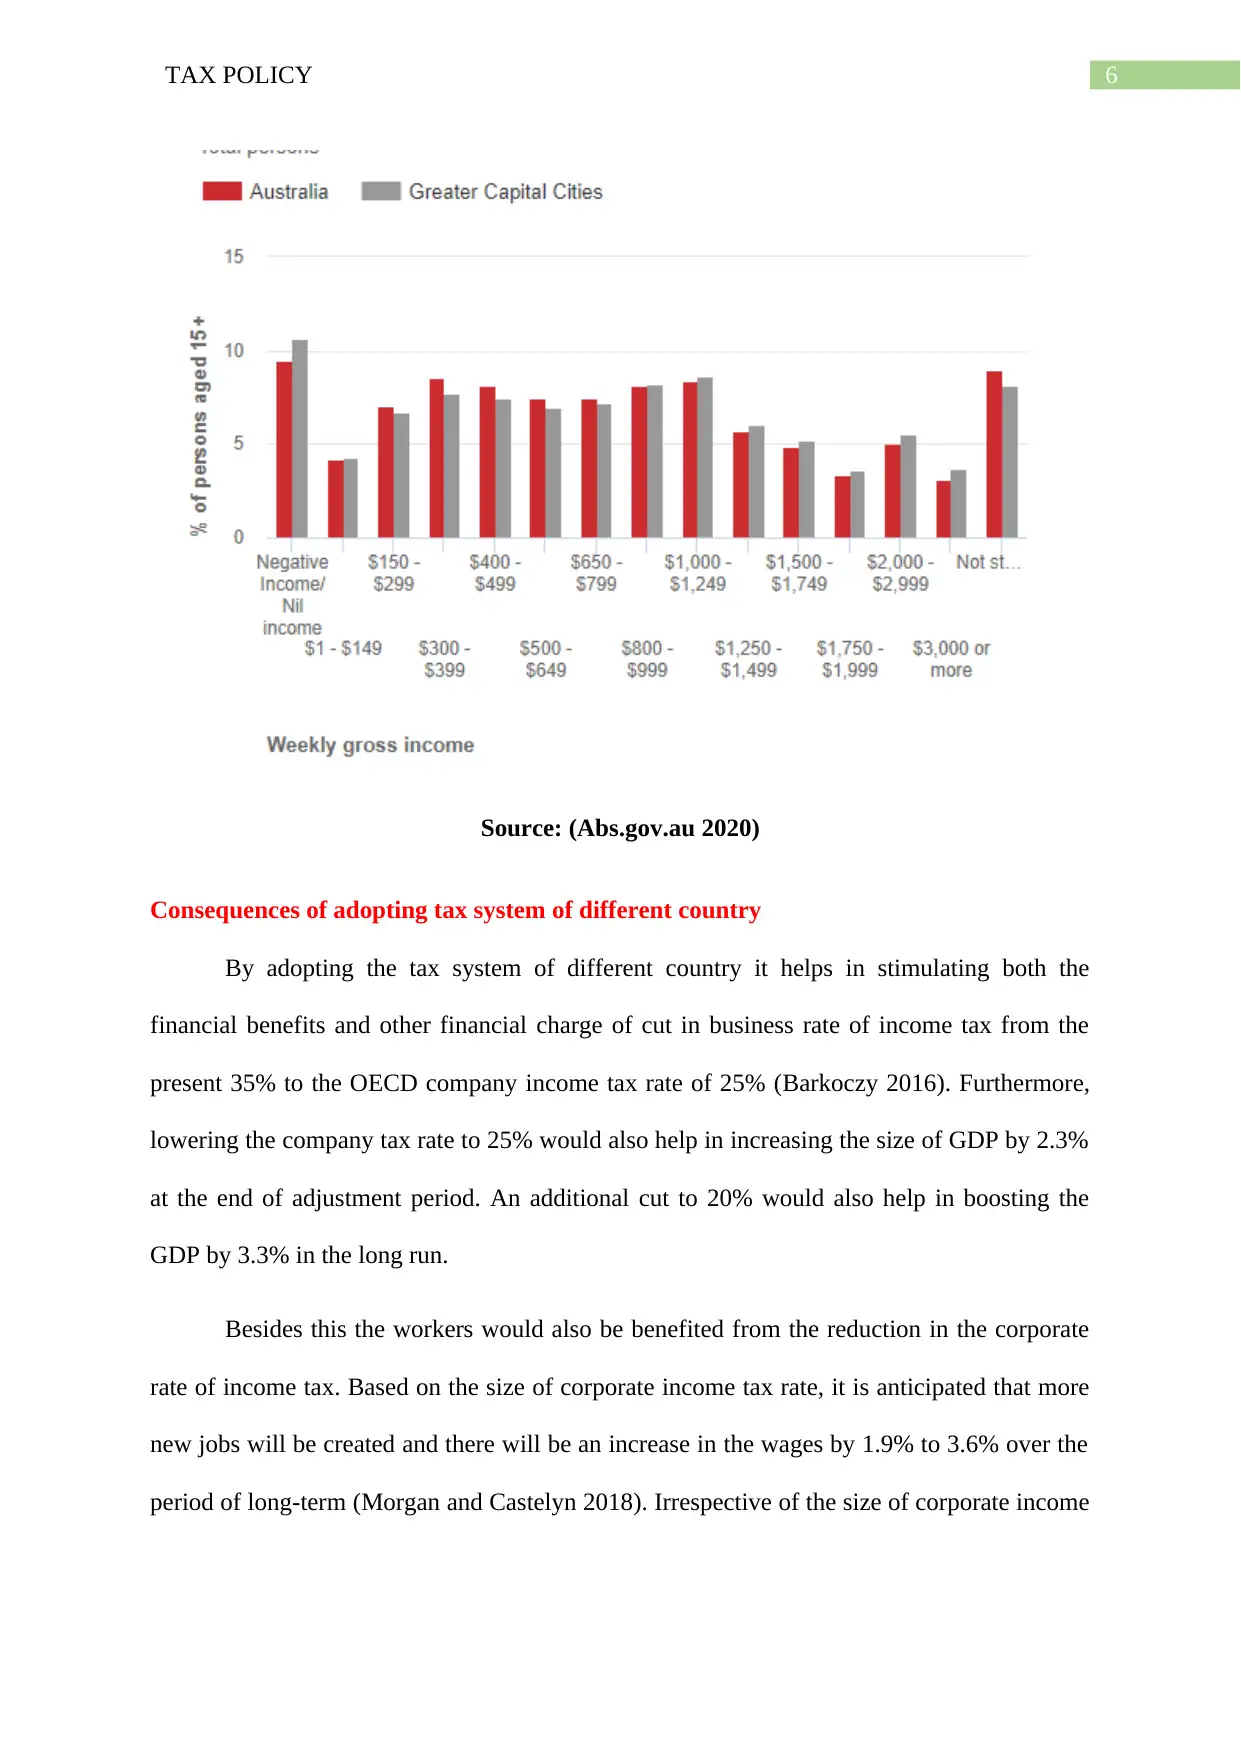
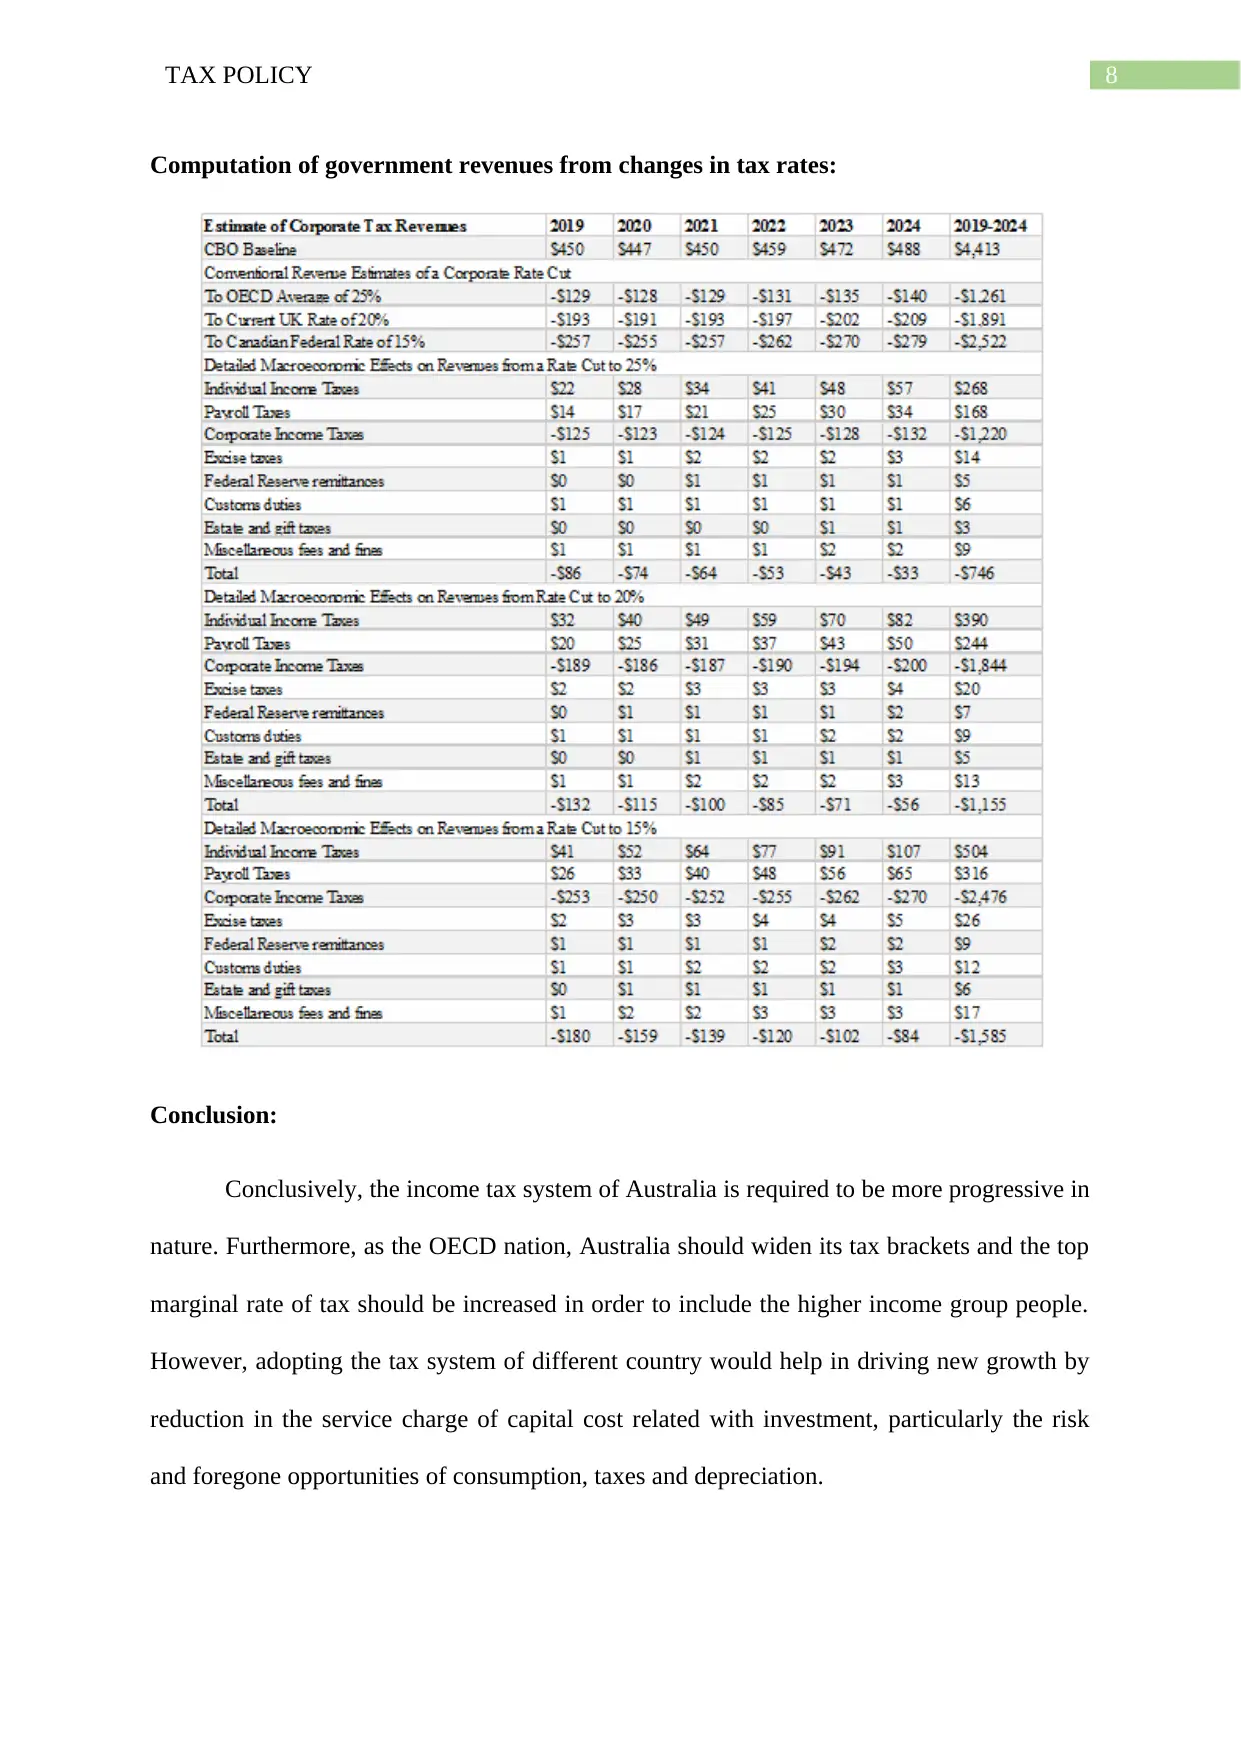
This report provides an analysis of Australia's tax policy, examining its key features and comparing it to international standards. It begins with an overview of the Australian tax system, including income tax rates and revenue sources, and assesses its fairness through measures of inequality such as the Gini coefficient. The report then explores the potential consequences of adopting a different country's tax system, considering the impact on GDP, employment, and government revenue. It also includes a simulation exercise to compute government revenues from changes in tax rates. The report concludes that Australia's income tax system needs to be more progressive, and it suggests that adopting another country's tax system could reduce the cost of capital and boost the economy. The study uses data from the OECD and other sources to support its findings. The report is a comprehensive analysis of Australia's taxation system.

Running head: TAX POLICY
Tax Policy
Name of the Student
Name of the University
Authors Note
Course ID
Tax Policy
Name of the Student
Name of the University
Authors Note
Course ID
Paraphrase This Document
Need a fresh take? Get an instant paraphrase of this document with our AI Paraphraser

1TAX POLICY
Table of Contents
Introduction:...............................................................................................................................2
Taxation in Australia..................................................................................................................2
Inequality measures:...................................................................................................................3
Income distribution by decile:....................................................................................................5
Consequences of adopting tax system of different country.......................................................5
Computation of government revenues from changes in tax rates:.............................................7
References:.................................................................................................................................8

2TAX POLICY
Introduction:
There are times when several countries look into their tax policies, this policy sets out
the assessment regarding the efficiency and effect of Australia’s taxation rule. Presently
Australia has the comparatively higher marginal income tax rate of 45 per cent, however it
does cuts in the lower income level of $180,000. Despite the fact that Henry Review formed a
tax reformation to raise debate as what principles should reinforce the taxation system of
Australia, this argument cannot be considered new (Taylor et al. 2017). A fair tax system
usually has both the vertical and horizontal equity. This means that majority of the people
must pay the highest amount of tax. As per the OECD, an effective tax system represents the
one where the compliance cost for taxpayer and managerial costs for authorities are lowest.
The study will assess the tax system of Australia and the consequences involved in adopting
the taxation system of another country.
Taxation in Australia
As per the data of OECD, the overall tax liability of Australia as compared to other
OECD nation is relatively low. The total tax collection of Australia was fifth from the other
34 countries and accounts for 25.6% of the current Australia’s GDP. As argued by Miller and
Oats (2016) the total amount of revenues collected by government of Australia is neither
inadequate nor surplus and further suggest that there is hardly any convincing instance for
claiming that Australia has the highest amount of overall tax levels.
Even though the general level of tax proceeds in Australia is lower as compared to
other OECD states, it cannot be considered that Australia’s taxation system is fair, effective
or simple. In Australia different income types are levied taxes contradictorily and a larger
part of Australia’s tax revenues is obtained from the wages and salary (Rohatgi 2015). In the
year 2015 approximately 57.1% of the tax revenue in Australia is produced from levying
⊘ This is a preview!⊘
Do you want full access?
Subscribe today to unlock all pages.

Trusted by 1+ million students worldwide

3TAX POLICY
taxes on income and profits. This liability is greater than 33.2% from other OECD nations
and also states that it has the second highest burden on wages and wage earners apart from
rest of OECD nations. More importantly, Australian government derives 38.6 percent of tax
revenues from personal income of individuals.
Despite the fact that the Australian government is dedicated towards keeping the
progressive income tax system, there is a big concern that surrounds fairness of the present
tax scheme. One of the important concerns is to lower the middle income earnings who face
the disadvantage from the modifications in the marginal income tax rate (Kane 2015). During
the end of 2015, the “marginal tax rate” on income for an individual on average weekly
wages (AWE) has increased to 37%, whereas the rate of income tax for the higher revenue
earners stood 45% only. From the period 1998 to 2015, Australia’s marginal rate of tax on
income for the high income recipients has declined from 68 percent to 45 percent. While the
“marginal tax rate” on income for “average weekly earners” has increased from 30 % to
37% and their average rate of tax has increased from 17% to 22% of their revenue. This only
contributes to the unfair tax system and further contributes to disincentive for the lower to
middle income wage earners to work and simply effects their premise for progressive tax
system
Income threshold Rate (%) Tax Payable
$0 to $18,200 0 Nil
$18,201 to $37,000 19 19c for each beyond $18,200
$37,001 to $90,000 32.5 $3,572 + 32.5% over $37,000
$90,001 to $180,000 37 $20,797 + 37% of over $90,000
$180,000 and above 45 $54096 + 45% of over $180,000
Table 1: Representing household income tax rates
Paraphrase This Document
Need a fresh take? Get an instant paraphrase of this document with our AI Paraphraser

4TAX POLICY
Inequality measures:
In Australia there is an in equal distribution of income with Gini Coefficient of 90/10
percentile ratio in “disposable income”. There is a huge amount of inequality in distribution
of income. The lowermost household in respect of net worth had the mean average of
$35,200 in comparison to the wealthiest has the 20% of the household income. The net mean
worth of all household income in Australia for 2017-18 stood $1 million with median stood
as low as $558,900.

5TAX POLICY
Source: (Profile.id.com.au. 2020)
Income distribution by decile:
On assessing the individual income levels in Australia during 2016 in comparison to
other capital cities demonstrates that there was a low portion of people that earned a higher
income of $1750 per week o more and there is a high proportion of people that earn low
income of less than $500 per week. Overall around 11% of the population made higher
income and 37.5% of the population earned lower income, in comparison with the 12.9% and
36.8% of the people in greater cities.
⊘ This is a preview!⊘
Do you want full access?
Subscribe today to unlock all pages.

Trusted by 1+ million students worldwide

6TAX POLICY
Source: (Abs.gov.au 2020)
Consequences of adopting tax system of different country
By adopting the tax system of different country it helps in stimulating both the
financial benefits and other financial charge of cut in business rate of income tax from the
present 35% to the OECD company income tax rate of 25% (Barkoczy 2016). Furthermore,
lowering the company tax rate to 25% would also help in increasing the size of GDP by 2.3%
at the end of adjustment period. An additional cut to 20% would also help in boosting the
GDP by 3.3% in the long run.
Besides this the workers would also be benefited from the reduction in the corporate
rate of income tax. Based on the size of corporate income tax rate, it is anticipated that more
new jobs will be created and there will be an increase in the wages by 1.9% to 3.6% over the
period of long-term (Morgan and Castelyn 2018). Irrespective of the size of corporate income
Paraphrase This Document
Need a fresh take? Get an instant paraphrase of this document with our AI Paraphraser

7TAX POLICY
tax rate, a bigger GDP would help in translating in higher after tax income for the taxpayers
up and down the income scale.
As stated by (Woellner et al. 2016) by making use of conventional scoring, cutting
down the corporate rate of income tax by 25, 20 or 15 % will cost the government $1.2, $1.8
and $2.5 trillion in the next ten years. Nevertheless, by making use of more realistic
assumption cutting the corporate rate of income tax would help in increasing the GDP size,
their cost may be close to $746 billion, $1trillion and $1.5 trillion in the next decade.
Adopting the different countries taxation system would not only cut down the corporate rate
of income tax but it will help in boosting the economic growth and benefit among the
workers (Blakelock and King 2017). A reduced rate of corporate tax would assist in reducing
the cost of capital, which would in turn help in boosting the investment in the economy.

8TAX POLICY
Computation of government revenues from changes in tax rates:
Conclusion:
Conclusively, the income tax system of Australia is required to be more progressive in
nature. Furthermore, as the OECD nation, Australia should widen its tax brackets and the top
marginal rate of tax should be increased in order to include the higher income group people.
However, adopting the tax system of different country would help in driving new growth by
reduction in the service charge of capital cost related with investment, particularly the risk
and foregone opportunities of consumption, taxes and depreciation.
⊘ This is a preview!⊘
Do you want full access?
Subscribe today to unlock all pages.

Trusted by 1+ million students worldwide

9TAX POLICY
References:
Barkoczy, S., 2016. Foundations of taxation law 2016. OUP Catalogue.
Blakelock, S. and King, P., 2017. Taxation law: The advance of ATO data
matching. Proctor, The, 37(6), p.18.
Kane, M.A., 2015. A defense of source rules in international taxation. Yale J. on Reg., 32,
p.311.
Miller, A. and Oats, L., 2016. Principles of international taxation. Bloomsbury Publishing.
Morgan, A. and Castelyn, D., 2018. Taxation Education in Secondary Schools. J.
Australasian Tax Tchrs. Ass'n, 13, p.307.
Rohatgi, R., 2015. Basic international taxation (Vol. 1). Richmond Law & Tax.
Taylor, J., Walpole, M., Burton, M., Ciro, T. and Murray, I., 2017. Understanding Taxation
Law 2018. LexisNexis Butterworths.
Woellner, R., Barkoczy, S., Murphy, S., Evans, C. and Pinto, D., 2016. Australian Taxation
Law 2016. OUP Catalogue.
Abs.gov.au. (2020). 6523.0 - Household Income and Wealth, Australia, 2017-18. [online]
Available at:
https://www.abs.gov.au/ausstats/abs@.nsf/Lookup/by%20Subject/6523.0~2017-18~Main
%20Features~Distribution%20of%20Household%20Income%20and%20Wealth~6
[Accessed 14 Jan. 2020].
Profile.id.com.au. (2020). Individual income | Australia | Community profile. [online]
Available at: https://profile.id.com.au/australia/individual-income [Accessed 14 Jan. 2020].
1 out of 10
Related Documents

Your All-in-One AI-Powered Toolkit for Academic Success.
+13062052269
info@desklib.com
Available 24*7 on WhatsApp / Email
Unlock your academic potential
Copyright © 2020–2025 A2Z Services. All Rights Reserved. Developed and managed by ZUCOL.