ECO3BWE Semester 2: Australia's Trade and Structural Change Analysis
VerifiedAdded on 2022/10/02
|13
|2627
|38
Report
AI Summary
This report analyzes the international trade transformations experienced by Australia since the 1970s, focusing on the shifts in trade partners, the changing composition of exports, and the impact of globalization. It defines structural transformation in the context of international markets and evaluates how Australia has managed its economic restructuring through government policies and market-based developments. The report also examines revealed comparative advantage (RCA) for selected industries in Australia, comparing data from 1978, 1998, and 2018 to identify trends and patterns in export specialization. The analysis includes RCA calculations for ten industries, providing insights into Australia's comparative advantages and disadvantages over time. The analysis covers Alcoholic beverage, Spices, Perfumery, cosmetics, dentifrices; Paper and paperboard; Fertilizers manufactured; Animal/vegetable Oils & fats, processed; Pearls and precious and semi precious; Cutlery; Glass and Textile yarn and thread.
Running head: BUSINESS IN THE WORLD ECONOMY
BUSINESS IN THE WORLD ECONOMY
Name of the student
Name of the University
Author Note
BUSINESS IN THE WORLD ECONOMY
Name of the student
Name of the University
Author Note
Paraphrase This Document
Need a fresh take? Get an instant paraphrase of this document with our AI Paraphraser
1BUSINESS IN THE WORLD ECONOMY
Table of Contents
Answer 1a........................................................................................................................................2
Answer 1b........................................................................................................................................3
Answer 1c........................................................................................................................................4
Answer 2a........................................................................................................................................5
Answer 2b........................................................................................................................................9
References......................................................................................................................................11
2BUSINESS IN THE WORLD ECONOMY
Answer 1a
Australia, as a nation, has been greatly exposed towards international trade starting from
the years of 1970s. With time, the global trade associates along with the investment partners of
the country have gradually shifted from the West towards Asia. The global two-way trade of
Australia reached to about $735 billion in 2016-2017, which accounted nearly 40% of the
economy (Publications.industry.gov.au 2019).
During the initial years of 1990s, the Australian economy experienced a high level of
trade fluctuation when the two-way global trade of the nation fell abruptly from being a great
trade expose, which accounted near about 50% of GDP (Gross Domestic Product) share
(Publications.industry.gov.au 2019). At that period, Australia used to export a very limited range
of mostly the agricultural products to the markets of British Empire (United Kingdom), with the
major exports like gold, wool, butter and wheat. Spikes in the international trade, as the
consequence of the great World Wars, showed the potential of the export economy of Australia.
Instead of having a trading capacity beyond the global average, the country was quite slow to
embrace, the “Globalisation Mark II”. The main reasons for relatively low trade are slow
liberalization to the barriers of trade as well as huge distances from the world markets.
A significant change has been observed in the trading partner of Australia from 1970s.
From Federation up to approximately 1965, United Kingdom (UK) was the foremost Australia’s
trading partner but from 1970s, United States of America (USA) and Japan occupied the place of
UK for about 4 decades. At present, the leading Australia’s trading partners are Japan, South
Korea and China with USA still remaining at an important place. This shows that the country’s
major trading partners are from Asian region rather Western part which happed to be prior to
⊘ This is a preview!⊘
Do you want full access?
Subscribe today to unlock all pages.
Trusted by 1+ million students worldwide
3BUSINESS IN THE WORLD ECONOMY
1970s.At the beginning of 21st century, China became the most vital trade partner of the nation
that boosted the demand for Australia’s commodity resources (Publications.industry.gov.au
2019). The composition of the export sector of the economy also experienced noteworthy
changes since 1970s, which are characterized by the increased export of the service and mining
sectors and fall in the manufacturing export. However, the total mining export of Australia has
now reached beyond 50% due to rising demand of China. 3/4th of the total value service export in
the international trade includes intermediate inputs and with time, its share is escalating. Other
services comprise of merchandise trade, software development, back-office functions, legal
review and freight logistics. The competition gradually intensified in the market, encouraging
growing innovation through new services and technologies (Publications.industry.gov.au 2019).
Thus, the international trade transformations experience by Australia since 1970s,
happened in terms of more economic efficiency, changing of world trading environment,
strengthening of competition, creating further new business opportunities, availability of more
commodities at low price and finally shaping specialization patters.
Answer 1b
Structural transformation is the process of reallocating the economic activity of a country
across the three wide sectors (agricultural sector, manufacturing sector and service sector) which
leads to the modernized economic growth and development. The structural transformation leads
to huge scale resource alteration from one sector to another in an economy, necessitated by
various fundamental changes bought in the nation’s objectives and policies (Herrendorf,
Rogerson and Valentinyi 2014). More specifically, structural transformation indicates the shift of
the labors as well as other resources to high productivity from low productive economic
activities. Sustainable economic growth is inextricably related to structural transformation and
Paraphrase This Document
Need a fresh take? Get an instant paraphrase of this document with our AI Paraphraser
4BUSINESS IN THE WORLD ECONOMY
also to the growth in productivity within the sectors. In an alternative way, it can be said that the
course of structural transformation occurs continuously throughout the developmental process of
a nation.
The exposure of the country, Australia, to the global trade market has brought structural
transformation to the nation regarding business opportunity, economic efficiency and reducing
the prices of the products. With time, the nation had gradually moved towards mining and
service sectors from the agriculture and manufacturing zones. The country’s supply chain had
also lengthened over time because of the fairly strong growth of the overall factor productivity.
The shifting of the Australian economy to service sector had made the country richer by
enhancing the total level of income, characterized by the steady economic development of the
nation. Moreover, the total number of employees amplified in the sector of business services
thereby raising the total employment level of the country. Besides these structural changes, the
enhancement of Australian global (world) trade which created an additional opportunity for the
economy to export, had strengthened and intensified the competition and innovativeness in the
country’s market. The strong competitive ground and innovativeness, both, had brought new
effective technologies along with efficient services in the market (Shahiduzzaman and Alam
2014).
Answer 1c
A considerable amount of structural transformation has been experienced by the
Australian economy mainly since 1970s. The nation has managed to achieve its structural change
over the time period through the collaboration of a wide range of forces like natural force, social
and economic force. These forces are at constant work within the nation that helped the country
to manage its structural change. The way by which the nation had managed its structural
5BUSINESS IN THE WORLD ECONOMY
revolution can be grouped into two important categories. One category can be identified as
government policy associated changes and the other being the market based developments. The
Australian economy had managed to bring its structural alteration by incorporating several
government related programs and policies like infrastructural reforms, taxation programs, labor
market reform policy, competition and various other general regulatory reforms, investment
liberalization, trade liberalisation and normal government reform policies (Roness 2017). The
central market based development for managing structural alteration include discovery of new
resources, technological innovation, behavioral changes and trade as well as global specialization
(Antonelli 2014). In addition to the above mentioned ways of managing structural
transformation, the investment from the foreign countries was also a crucial driver of the
economic growth of Australia. The foreign investment helps in expanding the export
opportunities of the country by facilitating new commerce with the connections in various
different markets. Hence, the growing rate of foreign investment, since 1970s especially from the
Asian region, which accounted an investment of $3.2 trillion at the ending of 2016, can also be
considered as one of the ways that assisted Australia to manage its structural transformation.
Answer 2a
Revealed Comparative Advantage, represented as RCA, is actually an index, which is
mainly used in the international economics in order to calculate relative advantage or relative
disadvantage of a particular nation for a certain category of products or services that is evidenced
by the trade flows (Leromain and Orefice 2014). It is primarily based on Richardian concept of
comparative advantage. RCA is actually the ratio of two types of shares. The numerator of the
ratio considers the total export share of a country’s commodity in relation to the total export of
that particular country. The denominator measures the world export share of that particular
⊘ This is a preview!⊘
Do you want full access?
Subscribe today to unlock all pages.
Trusted by 1+ million students worldwide
6BUSINESS IN THE WORLD ECONOMY
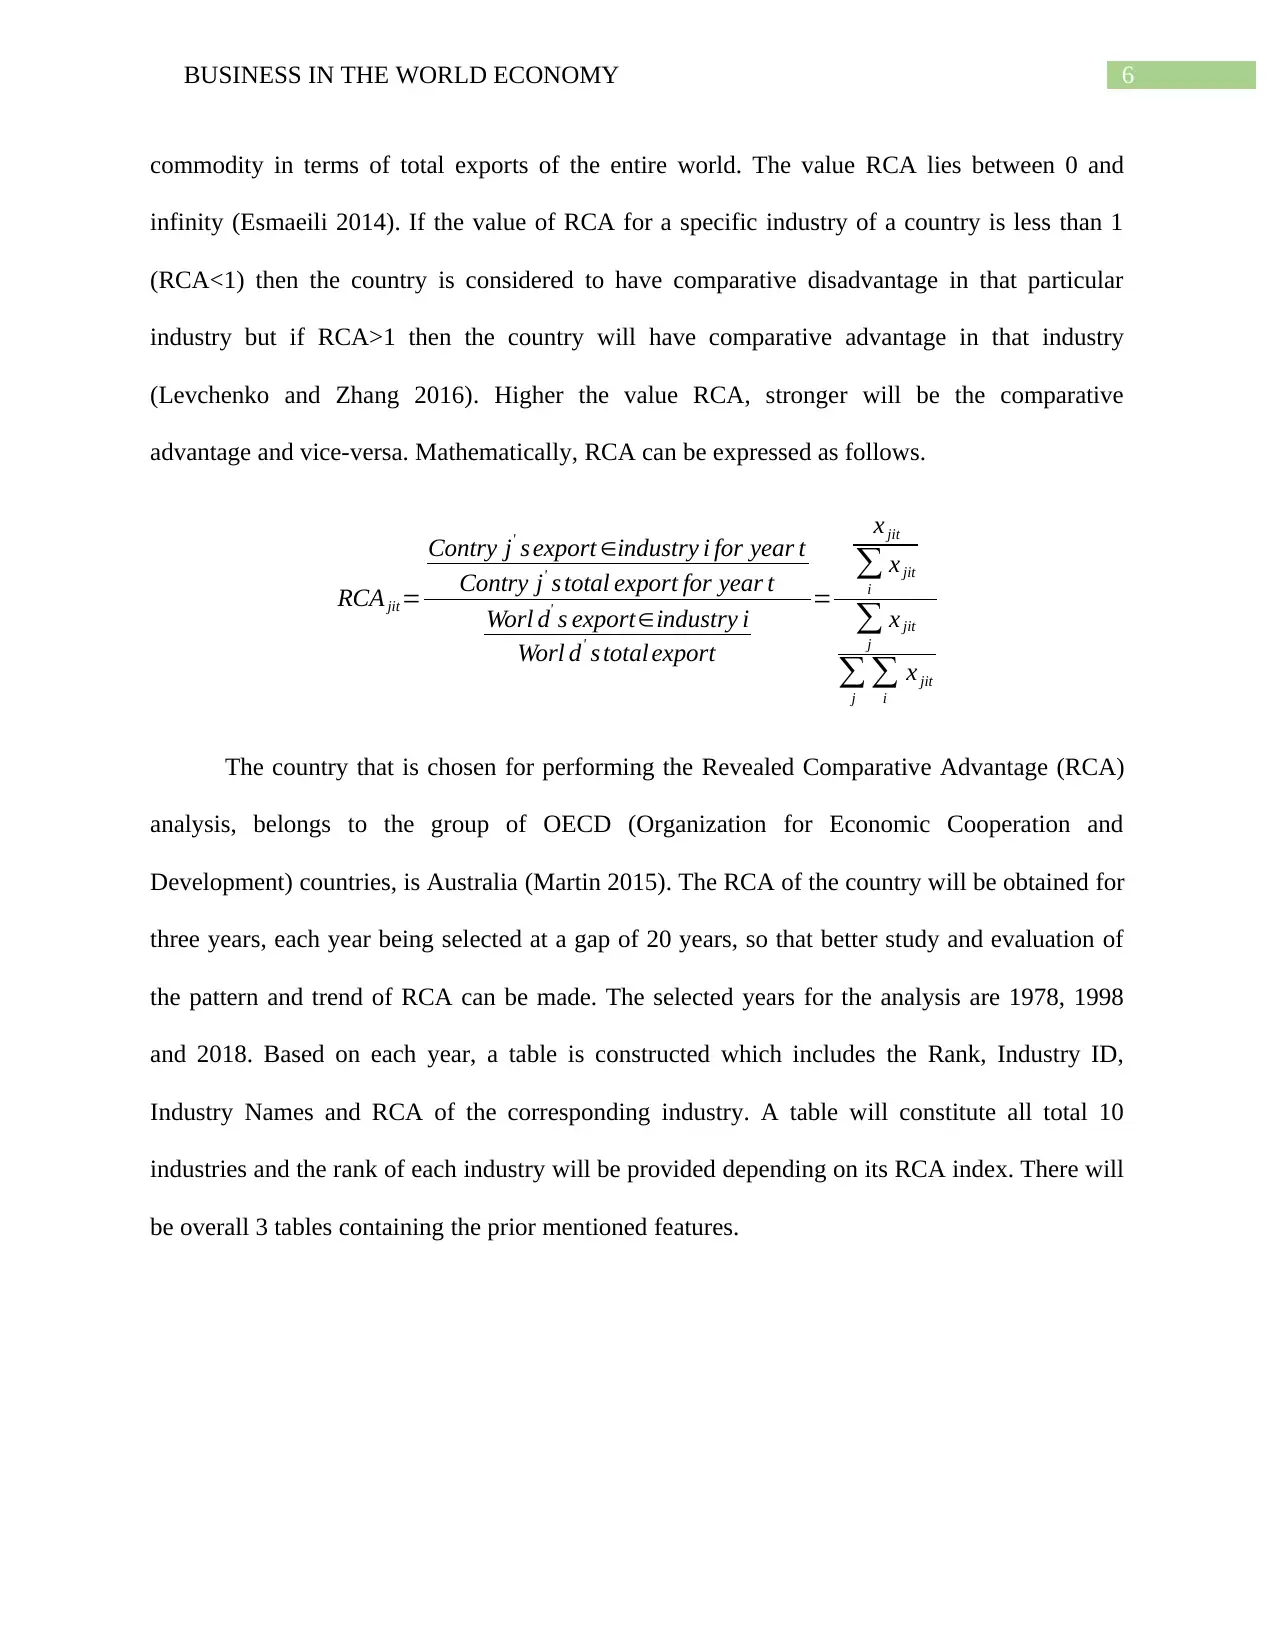
commodity in terms of total exports of the entire world. The value RCA lies between 0 and
infinity (Esmaeili 2014). If the value of RCA for a specific industry of a country is less than 1
(RCA<1) then the country is considered to have comparative disadvantage in that particular
industry but if RCA>1 then the country will have comparative advantage in that industry
(Levchenko and Zhang 2016). Higher the value RCA, stronger will be the comparative
advantage and vice-versa. Mathematically, RCA can be expressed as follows.
RCA jit =
Contry j' s export ∈industry i for year t
Contry j' s total export for year t
Worl d' s export∈industry i
Worl d' s total export
=
x jit
∑
i
x jit
∑
j
x jit
∑
j
∑
i
x jit
The country that is chosen for performing the Revealed Comparative Advantage (RCA)
analysis, belongs to the group of OECD (Organization for Economic Cooperation and
Development) countries, is Australia (Martin 2015). The RCA of the country will be obtained for
three years, each year being selected at a gap of 20 years, so that better study and evaluation of
the pattern and trend of RCA can be made. The selected years for the analysis are 1978, 1998
and 2018. Based on each year, a table is constructed which includes the Rank, Industry ID,
Industry Names and RCA of the corresponding industry. A table will constitute all total 10
industries and the rank of each industry will be provided depending on its RCA index. There will
be overall 3 tables containing the prior mentioned features.
Paraphrase This Document
Need a fresh take? Get an instant paraphrase of this document with our AI Paraphraser
7BUSINESS IN THE WORLD ECONOMY
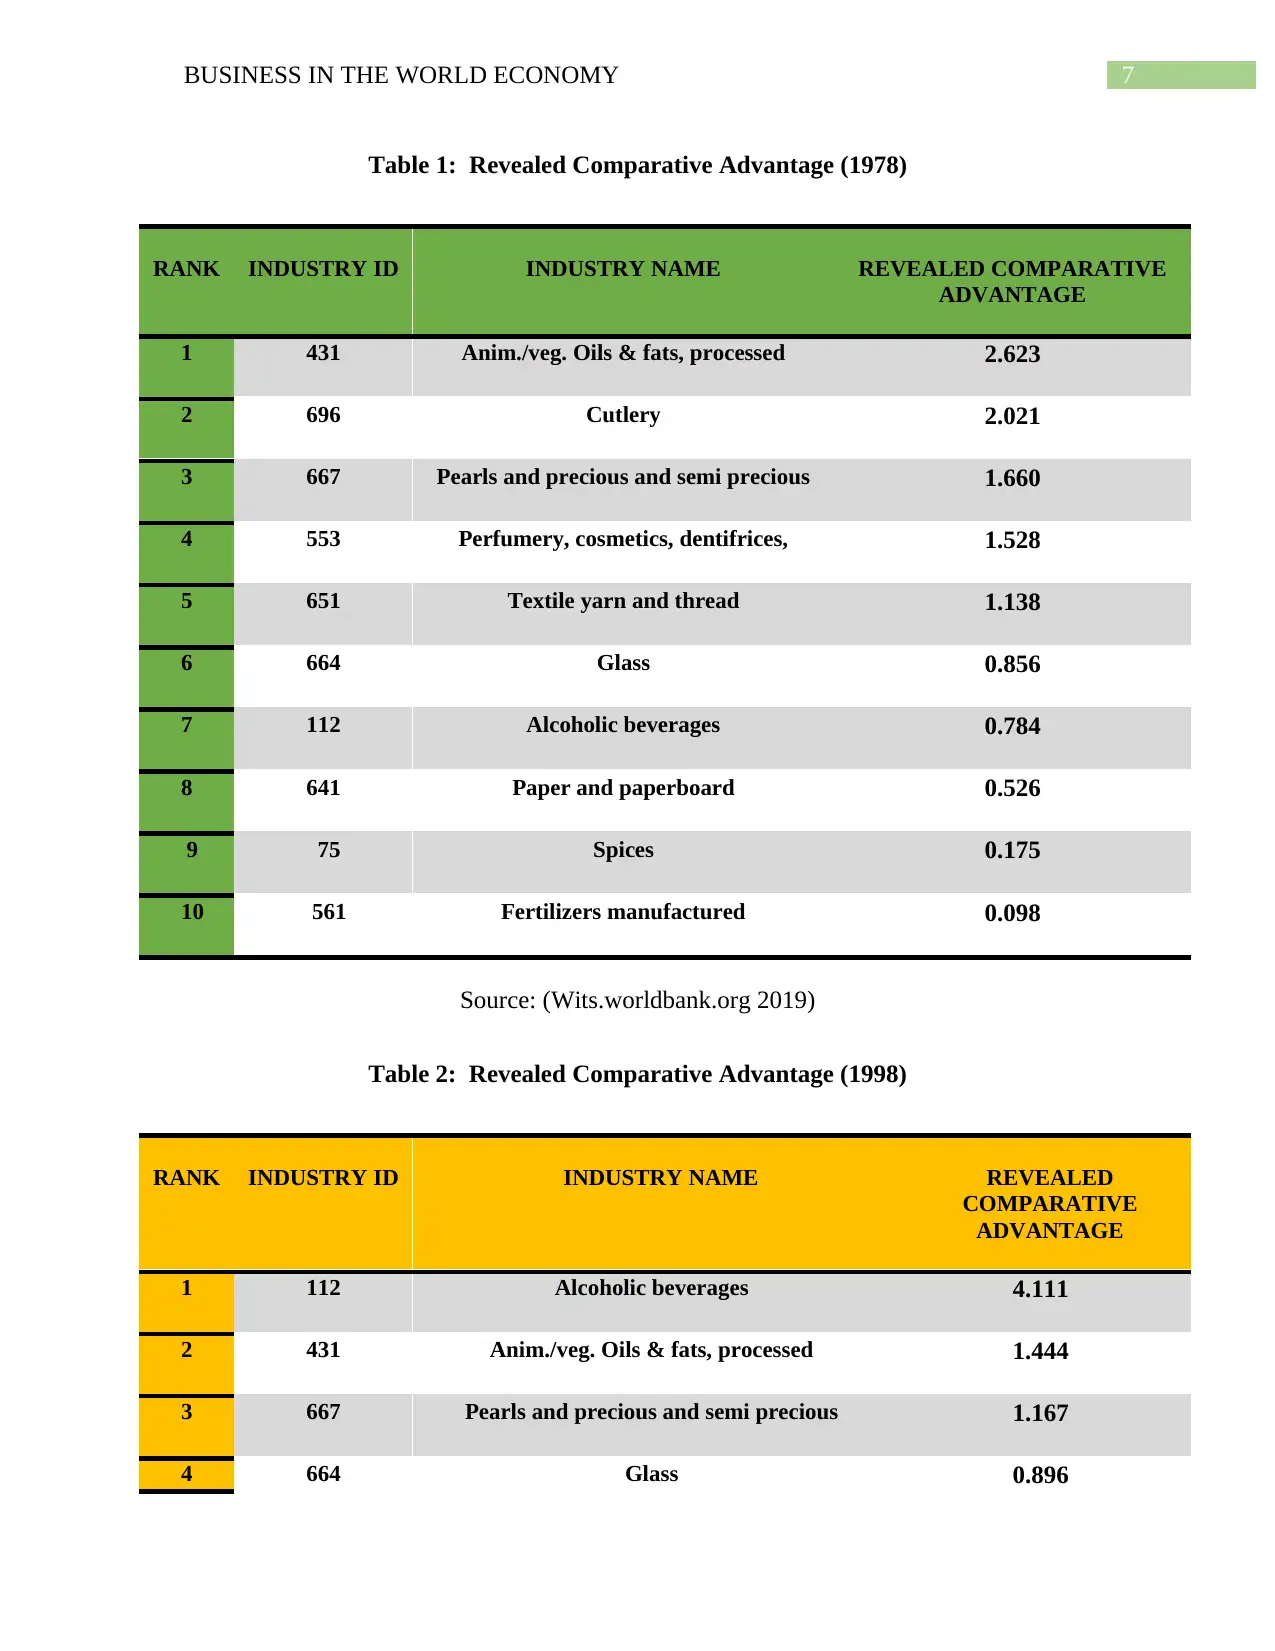
Table 1: Revealed Comparative Advantage (1978)
RANK INDUSTRY ID INDUSTRY NAME REVEALED COMPARATIVE
ADVANTAGE
1 431 Anim./veg. Oils & fats, processed 2.623
2 696 Cutlery 2.021
3 667 Pearls and precious and semi precious 1.660
4 553 Perfumery, cosmetics, dentifrices, 1.528
5 651 Textile yarn and thread 1.138
6 664 Glass 0.856
7 112 Alcoholic beverages 0.784
8 641 Paper and paperboard 0.526
9 75 Spices 0.175
10 561 Fertilizers manufactured 0.098
Source: (Wits.worldbank.org 2019)
Table 2: Revealed Comparative Advantage (1998)
RANK INDUSTRY ID INDUSTRY NAME REVEALED
COMPARATIVE
ADVANTAGE
1 112 Alcoholic beverages 4.111
2 431 Anim./veg. Oils & fats, processed 1.444
3 667 Pearls and precious and semi precious 1.167
4 664 Glass 0.896
8BUSINESS IN THE WORLD ECONOMY
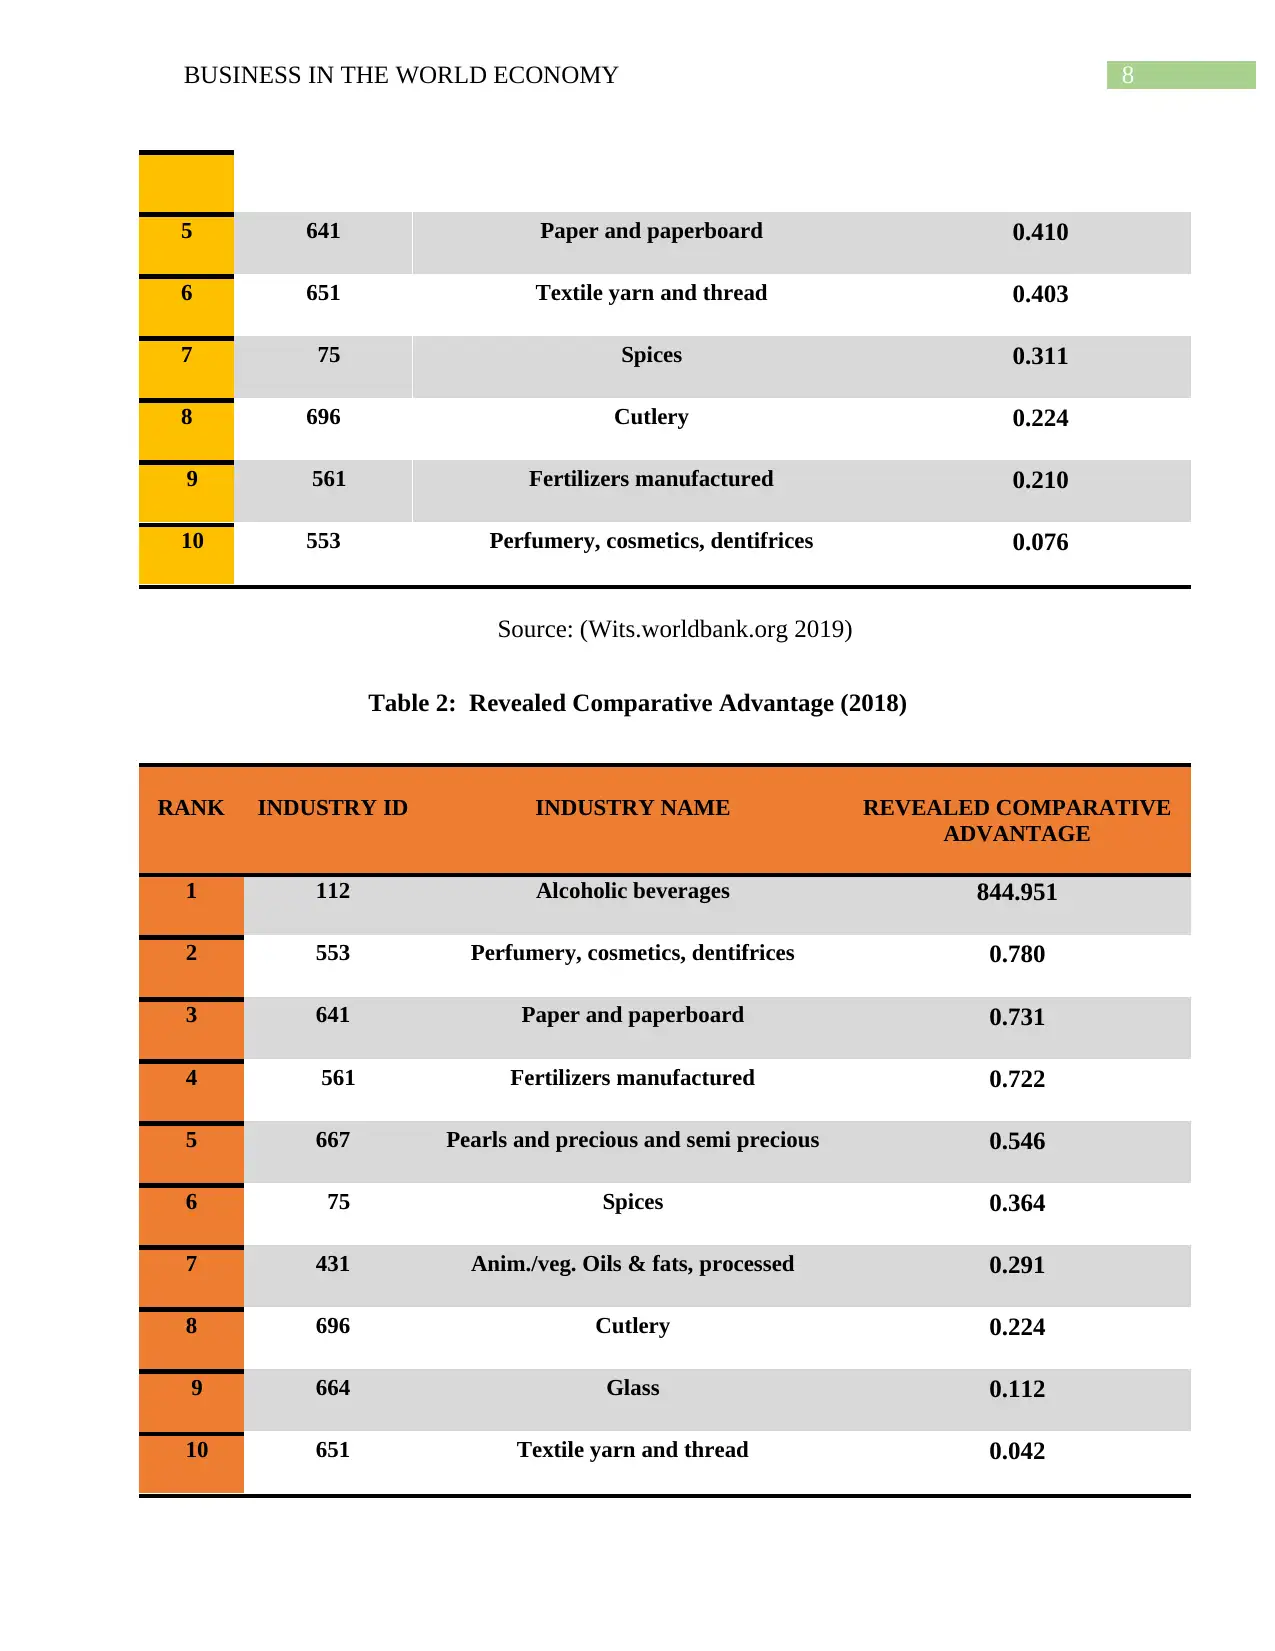
5 641 Paper and paperboard 0.410
6 651 Textile yarn and thread 0.403
7 75 Spices 0.311
8 696 Cutlery 0.224
9 561 Fertilizers manufactured 0.210
10 553 Perfumery, cosmetics, dentifrices 0.076
Source: (Wits.worldbank.org 2019)
Table 2: Revealed Comparative Advantage (2018)
RANK INDUSTRY ID INDUSTRY NAME REVEALED COMPARATIVE
ADVANTAGE
1 112 Alcoholic beverages 844.951
2 553 Perfumery, cosmetics, dentifrices 0.780
3 641 Paper and paperboard 0.731
4 561 Fertilizers manufactured 0.722
5 667 Pearls and precious and semi precious 0.546
6 75 Spices 0.364
7 431 Anim./veg. Oils & fats, processed 0.291
8 696 Cutlery 0.224
9 664 Glass 0.112
10 651 Textile yarn and thread 0.042
⊘ This is a preview!⊘
Do you want full access?
Subscribe today to unlock all pages.
Trusted by 1+ million students worldwide
9BUSINESS IN THE WORLD ECONOMY
Source: (Wits.worldbank.org 2019)
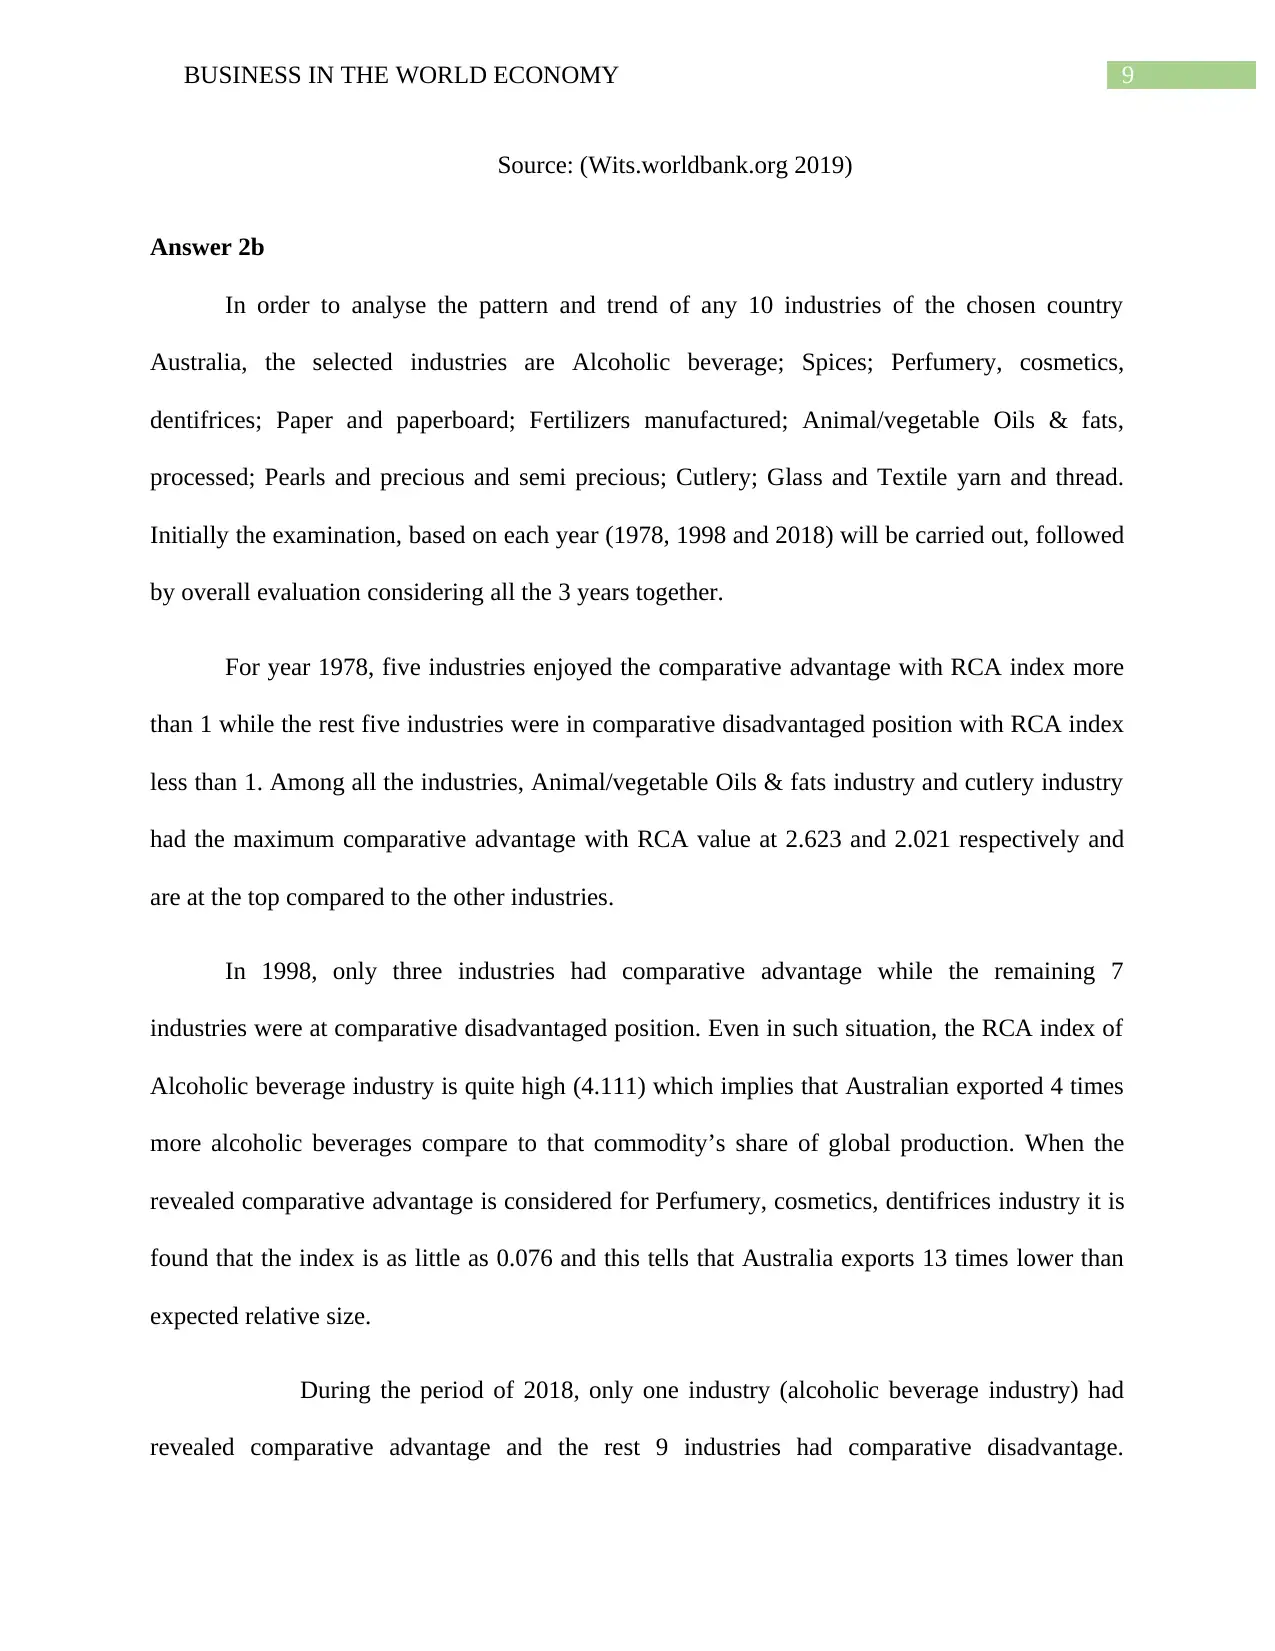
Answer 2b
In order to analyse the pattern and trend of any 10 industries of the chosen country
Australia, the selected industries are Alcoholic beverage; Spices; Perfumery, cosmetics,
dentifrices; Paper and paperboard; Fertilizers manufactured; Animal/vegetable Oils & fats,
processed; Pearls and precious and semi precious; Cutlery; Glass and Textile yarn and thread.
Initially the examination, based on each year (1978, 1998 and 2018) will be carried out, followed
by overall evaluation considering all the 3 years together.
For year 1978, five industries enjoyed the comparative advantage with RCA index more
than 1 while the rest five industries were in comparative disadvantaged position with RCA index
less than 1. Among all the industries, Animal/vegetable Oils & fats industry and cutlery industry
had the maximum comparative advantage with RCA value at 2.623 and 2.021 respectively and
are at the top compared to the other industries.
In 1998, only three industries had comparative advantage while the remaining 7
industries were at comparative disadvantaged position. Even in such situation, the RCA index of
Alcoholic beverage industry is quite high (4.111) which implies that Australian exported 4 times
more alcoholic beverages compare to that commodity’s share of global production. When the
revealed comparative advantage is considered for Perfumery, cosmetics, dentifrices industry it is
found that the index is as little as 0.076 and this tells that Australia exports 13 times lower than
expected relative size.
During the period of 2018, only one industry (alcoholic beverage industry) had
revealed comparative advantage and the rest 9 industries had comparative disadvantage.
Source: (Wits.worldbank.org 2019)
Answer 2b
In order to analyse the pattern and trend of any 10 industries of the chosen country
Australia, the selected industries are Alcoholic beverage; Spices; Perfumery, cosmetics,
dentifrices; Paper and paperboard; Fertilizers manufactured; Animal/vegetable Oils & fats,
processed; Pearls and precious and semi precious; Cutlery; Glass and Textile yarn and thread.
Initially the examination, based on each year (1978, 1998 and 2018) will be carried out, followed
by overall evaluation considering all the 3 years together.
For year 1978, five industries enjoyed the comparative advantage with RCA index more
than 1 while the rest five industries were in comparative disadvantaged position with RCA index
less than 1. Among all the industries, Animal/vegetable Oils & fats industry and cutlery industry
had the maximum comparative advantage with RCA value at 2.623 and 2.021 respectively and
are at the top compared to the other industries.
In 1998, only three industries had comparative advantage while the remaining 7
industries were at comparative disadvantaged position. Even in such situation, the RCA index of
Alcoholic beverage industry is quite high (4.111) which implies that Australian exported 4 times
more alcoholic beverages compare to that commodity’s share of global production. When the
revealed comparative advantage is considered for Perfumery, cosmetics, dentifrices industry it is
found that the index is as little as 0.076 and this tells that Australia exports 13 times lower than
expected relative size.
During the period of 2018, only one industry (alcoholic beverage industry) had
revealed comparative advantage and the rest 9 industries had comparative disadvantage.
Paraphrase This Document
Need a fresh take? Get an instant paraphrase of this document with our AI Paraphraser
10BUSINESS IN THE WORLD ECONOMY
However, the RCA index of alcoholic beverage industry is as high as 844.951 while for textile
yarn and thread industry it is as low as 0.042. The excessively high value of RCA confirms that
Australian exported 844 times more alcoholic beverages compare to that commodity’s share of
global production.
The overall comparison of all the three years together shows that the revealed
comparative advantage of Alcoholic beverage industry grew across the time. At 1978, the RCA
index of the industry was 0.784 implying that the industry was at comparative disadvantaged
position but in 1998 (over 20 years) its revealed comparative advantage rose to 4.111 and in the
next 20 years (2018) the RCA value rose by extreme to 844.951 (approximately 845). The
primary reason for the change of RCA index rapidly through the years are the changing
composition of Australia’s export goods and also the changes of the world export.
11BUSINESS IN THE WORLD ECONOMY
References
Antonelli, C., 2014. The economics of innovation, new technologies and structural change.
Routledge.
Esmaeili, A., 2014. Revealed Comparative advantage and measurement of international
competitiveness for dates.Journal of International Food & Agribusiness Marketing, 26(3),
pp.209-217.
Herrendorf, B., Rogerson, R. and Valentinyi, Á., 2014. Growth and structural transformation.
In Handbook of economic growth (Vol. 2, pp. 855-941). Elsevier.
Leromain, E. and Orefice, G., 2014. New revealed comparative advantage index: dataset and
empirical distribution.International Economics, 139, pp.48-70.
Levchenko, A.A. and Zhang, J., 2016. The evolution of comparative advantage: Measurement
and welfare implications. Journal of Monetary Economics, 78, pp.96-111.
Martin, J.P., 2015. Activation and active labour market policies in OECD countries: stylised
facts and evidence on their effectiveness. IZA Journal of Labor Policy, 4(1), p.4.
Publications.industry.gov.au (2019). [online] Publications.industry.gov.au. Available at:
https://publications.industry.gov.au/publications/industryinsightsjune2018/documents/
IndustryInsights_2_2018_Chapter1_ONLINE.pdf [Accessed 4 Oct. 2019].
Roness, P.G., 2017. Types of state organizations: Arguments, doctrines and changes beyond new
public management. InTranscending new public management (pp. 77-100). Routledge.
Shahiduzzaman, M. and Alam, K., 2014. Information technology and its changing roles to
economic growth and productivity in Australia. Telecommunications Policy, 38(2), pp.125-135.
⊘ This is a preview!⊘
Do you want full access?
Subscribe today to unlock all pages.
Trusted by 1+ million students worldwide
1 out of 13
Related Documents


Your All-in-One AI-Powered Toolkit for Academic Success.
+13062052269
info@desklib.com
Available 24*7 on WhatsApp / Email
![[object Object]](/_next/static/media/star-bottom.7253800d.svg)
Unlock your academic potential
Copyright © 2020–2026 A2Z Services. All Rights Reserved. Developed and managed by ZUCOL.