Detailed Analysis of Australia's Labor Force: Unemployment Rates

Verified

Added on  2023/06/15

|6
|1577
|182
Homework Assignment
AI Summary
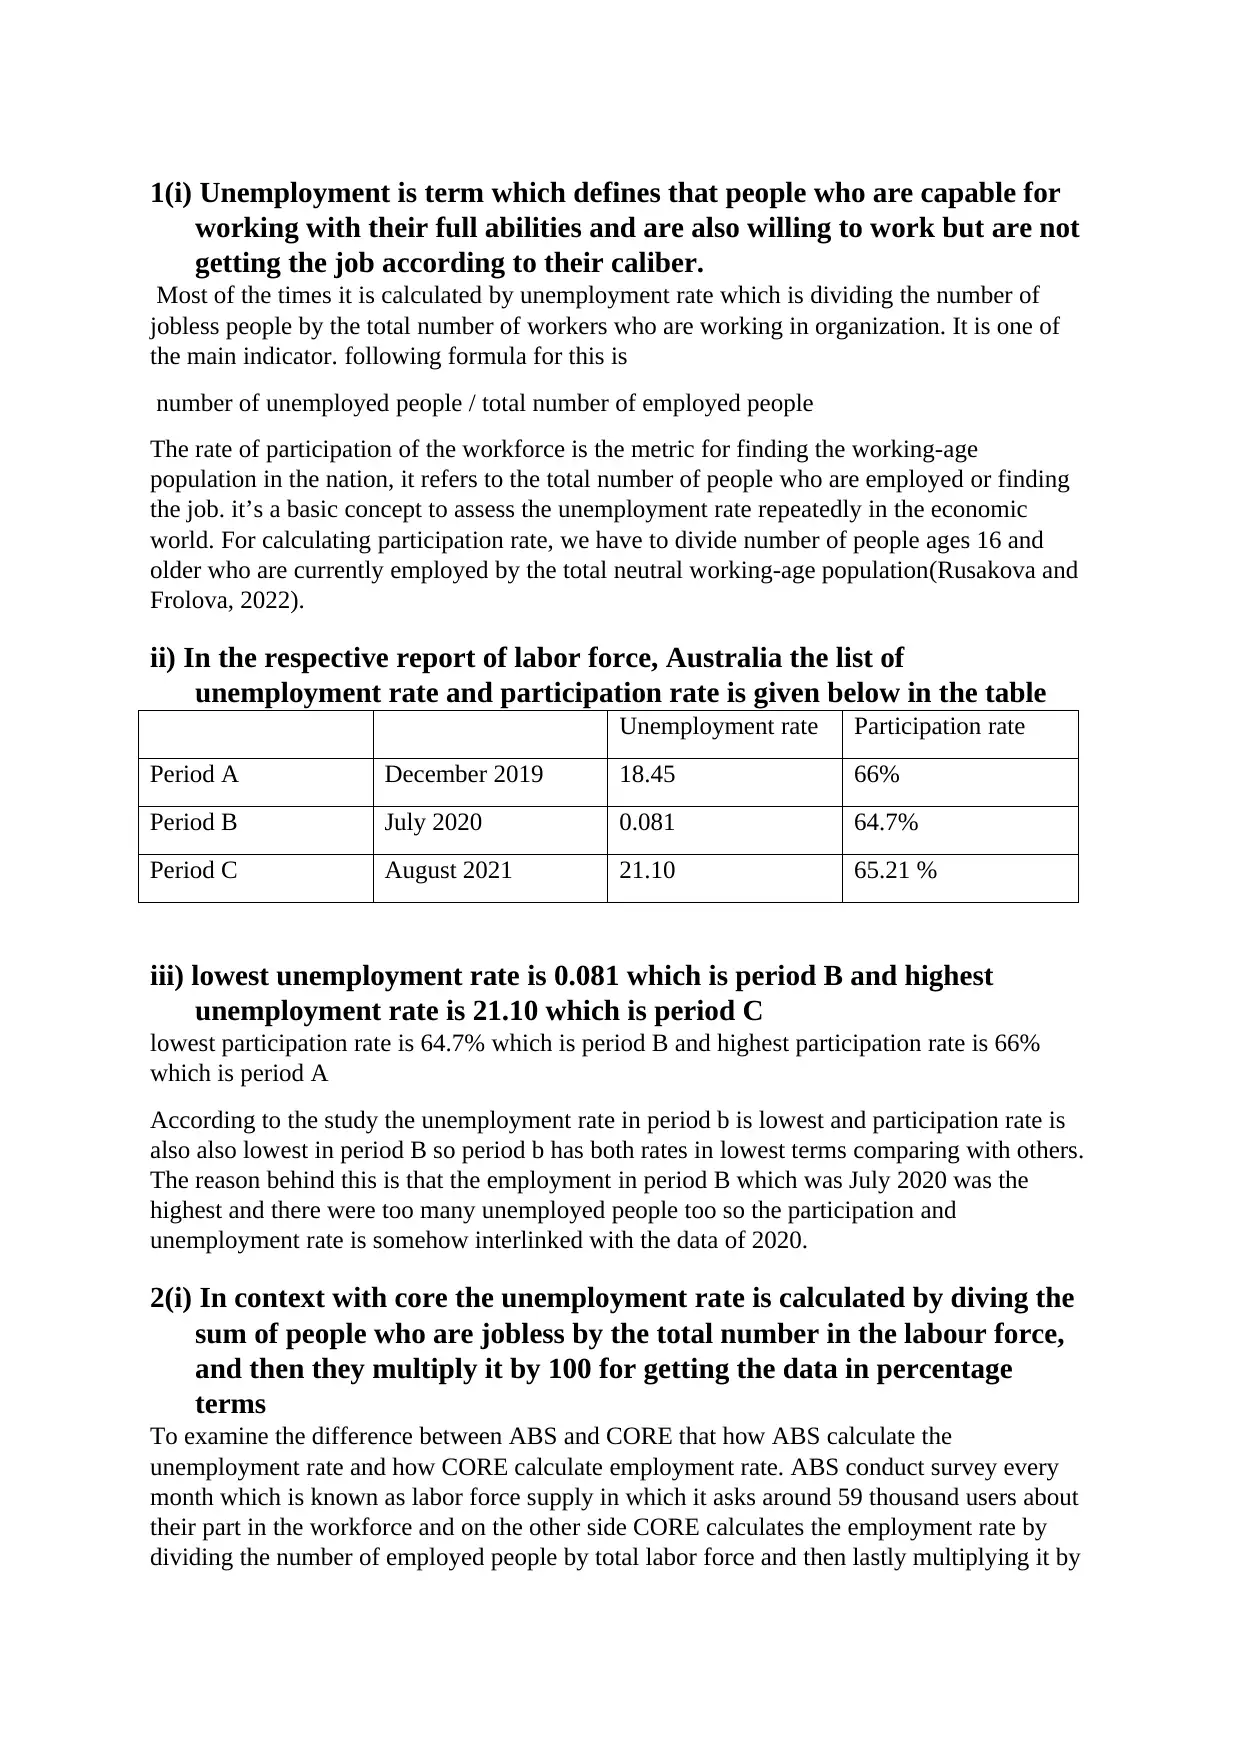
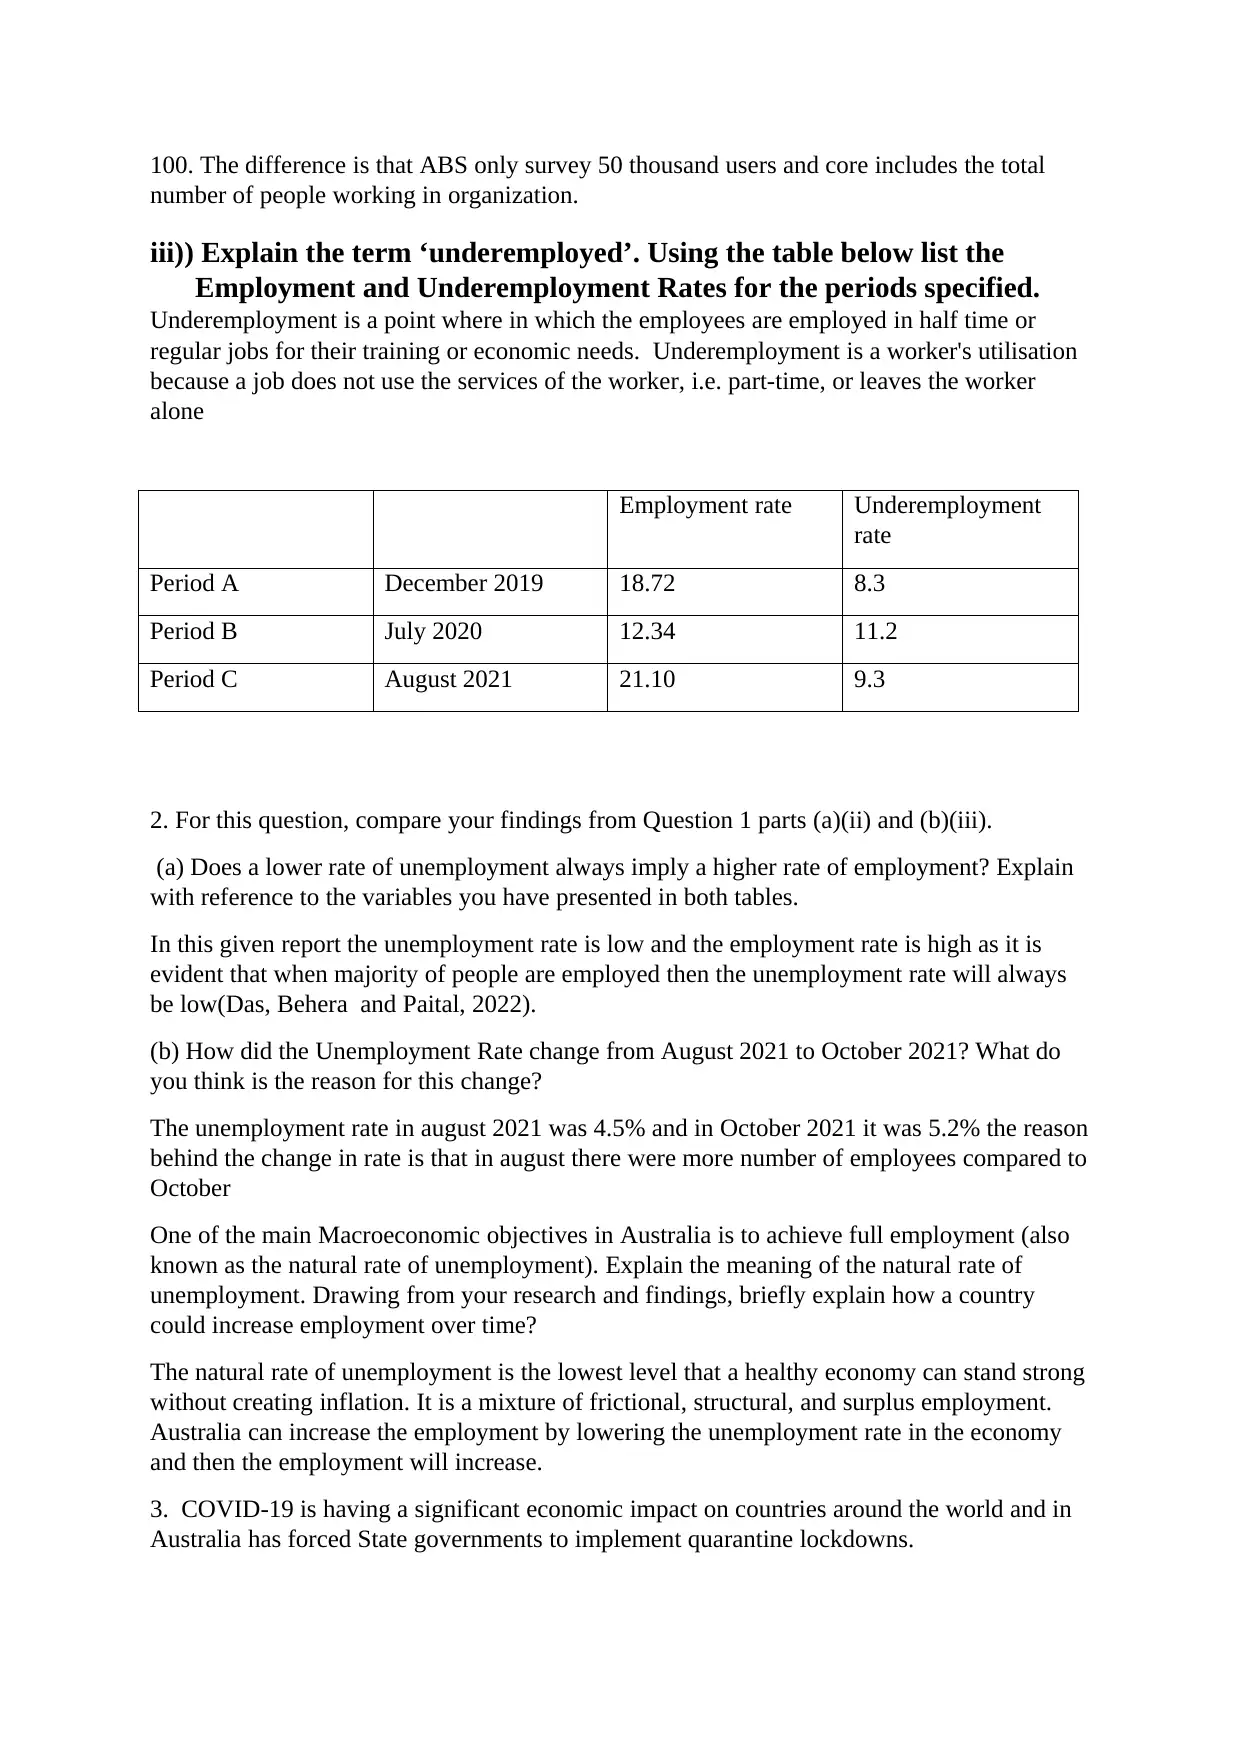
This assignment solution delves into the analysis of unemployment and participation rates in Australia, utilizing data from the ABS Labour Force statistics across different periods (December 2019, July 2020, and August 2021). It defines unemployment, explains the calculation of unemployment and participation rates, and identifies the periods with the highest and lowest rates. The document compares ABS and CORE methodologies for calculating unemployment, discusses underemployment, and examines the relationship between unemployment and employment rates. Furthermore, it addresses the impact of COVID-19 on Australia's unemployment rate, including the effects of lockdowns and policy responses like the 'Dine & Discover' voucher scheme, assessing its implications for Pareto efficiency and fairness. The solution also touches on macroeconomic objectives, such as achieving full employment, and strategies for increasing employment over time.
Document Page
Current Economic
Problem
tabler-icon-diamond-filled.svg

Paraphrase This Document

Need a fresh take? Get an instant paraphrase of this document with our AI Paraphraser
Document Page
Table of Contents
1(i) Unemployment is term which defines that people who are capable for working with their full
abilities and are also willing to work but are not getting the job according to their caliber..................3
ii) In the respective report of labor force, Australia the list of unemployment rate and participation
rate is given below in the table..............................................................................................................3
iii) lowest unemployment rate is 0.081 which is period B and highest unemployment rate is 21.10
which is period C ...................................................................................................................................3
2(i) In context with core the unemployment rate is calculated by diving the sum of people who are
jobless by the total number in the labour force, and then they multiply it by 100 for getting the data
in percentage terms...............................................................................................................................3
iii)) Explain the term ‘underemployed’. Using the table below list the Employment and
Underemployment Rates for the periods specified...............................................................................4
References.............................................................................................................................................6
Document Page
1(i) Unemployment is term which defines that people who are capable for
working with their full abilities and are also willing to work but are not
getting the job according to their caliber.
Most of the times it is calculated by unemployment rate which is dividing the number of
jobless people by the total number of workers who are working in organization. It is one of
the main indicator. following formula for this is
number of unemployed people / total number of employed people
The rate of participation of the workforce is the metric for finding the working-age
population in the nation, it refers to the total number of people who are employed or finding
the job. it’s a basic concept to assess the unemployment rate repeatedly in the economic
world. For calculating participation rate, we have to divide number of people ages 16 and
older who are currently employed by the total neutral working-age population(Rusakova and
Frolova, 2022).
ii) In the respective report of labor force, Australia the list of
unemployment rate and participation rate is given below in the table
Unemployment rate Participation rate
Period A December 2019 18.45 66%
Period B July 2020 0.081 64.7%
Period C August 2021 21.10 65.21 %
iii) lowest unemployment rate is 0.081 which is period B and highest
unemployment rate is 21.10 which is period C
lowest participation rate is 64.7% which is period B and highest participation rate is 66%
which is period A
According to the study the unemployment rate in period b is lowest and participation rate is
also also lowest in period B so period b has both rates in lowest terms comparing with others.
The reason behind this is that the employment in period B which was July 2020 was the
highest and there were too many unemployed people too so the participation and
unemployment rate is somehow interlinked with the data of 2020.
2(i) In context with core the unemployment rate is calculated by diving the
sum of people who are jobless by the total number in the labour force,
and then they multiply it by 100 for getting the data in percentage
terms
To examine the difference between ABS and CORE that how ABS calculate the
unemployment rate and how CORE calculate employment rate. ABS conduct survey every
month which is known as labor force supply in which it asks around 59 thousand users about
their part in the workforce and on the other side CORE calculates the employment rate by
dividing the number of employed people by total labor force and then lastly multiplying it by
Document Page
100. The difference is that ABS only survey 50 thousand users and core includes the total
number of people working in organization.
iii)) Explain the term ‘underemployed’. Using the table below list the
Employment and Underemployment Rates for the periods specified.
Underemployment is a point where in which the employees are employed in half time or
regular jobs for their training or economic needs. Underemployment is a worker's utilisation
because a job does not use the services of the worker, i.e. part-time, or leaves the worker
alone
Employment rate Underemployment
rate
Period A December 2019 18.72 8.3
Period B July 2020 12.34 11.2
Period C August 2021 21.10 9.3
2. For this question, compare your findings from Question 1 parts (a)(ii) and (b)(iii).
(a) Does a lower rate of unemployment always imply a higher rate of employment? Explain
with reference to the variables you have presented in both tables.
In this given report the unemployment rate is low and the employment rate is high as it is
evident that when majority of people are employed then the unemployment rate will always
be low(Das, Behera and Paital, 2022).
(b) How did the Unemployment Rate change from August 2021 to October 2021? What do
you think is the reason for this change?
The unemployment rate in august 2021 was 4.5% and in October 2021 it was 5.2% the reason
behind the change in rate is that in august there were more number of employees compared to
October
One of the main Macroeconomic objectives in Australia is to achieve full employment (also
known as the natural rate of unemployment). Explain the meaning of the natural rate of
unemployment. Drawing from your research and findings, briefly explain how a country
could increase employment over time?
The natural rate of unemployment is the lowest level that a healthy economy can stand strong
without creating inflation. It is a mixture of frictional, structural, and surplus employment.
Australia can increase the employment by lowering the unemployment rate in the economy
and then the employment will increase.
3. COVID-19 is having a significant economic impact on countries around the world and in
Australia has forced State governments to implement quarantine lockdowns.
tabler-icon-diamond-filled.svg

Paraphrase This Document

Need a fresh take? Get an instant paraphrase of this document with our AI Paraphraser
Document Page
(a) Despite two of the most populous Australian States (NSW and Victoria) being in hard
lockdown due to the Delta outbreak, Australia’s unemployment rate reached a historical low
in August 2021. Provide an explanation as to how this occurred.
With rise in Covid with the first wave initially border response cases began to tickle into
Australia and the people who were coming back from china. It inclined the nation to put
national lock down as the cases were rising so fast , and afterwards the second wave which
eliminated Covid-19 and in the state of Victoria there were a lot of rising cases which were
spreading rapidly and it lead to quarantine process and there was tackling with the hotspots
and strict and long lock-down(Chen and Tang, 2022).
(b) Part of the NSW government’s policy response to reduce the economic impact of
COVID-19 lockdowns, is to reintroduce the ‘Dine & Discover’ voucher scheme to support
small business operators.
(i) Explain how the reintroduction of this program in October 2021 may affect the
unemployment rate in Australia.
Yes it did effect the unemployment rate in Australia because this policy to motivate the
people to recreate their business ideas and do their own business , so automatically due to
rising entrepreneurs the unemployment will increase(Ali Nathwani and et. al., 2022).
(ii) Assess the reintroduction of the NSW ‘Dine & Discover’ voucher scheme in terms of
Pareto efficiency and fairness? Explain your answer.
The NSW Government launched Dine & Discover NSW to encourage the community to get
out and about and support dining, arts and recreation businesses. NSW residents aged 18 and
over can apply for 6 x $25 vouchers, worth $150 in total.
The vouchers can be used :7 days a week, including public holidays. To be eligible for the
vouchers, you must be: aged 18 years or over and a NSW resident.
Vouchers cannot be redeemed for cash used for: alcohol tobacco gambling online orders
(Dine NSW Vouchers only)
Document Page
References
Ali Nathwani, A.and et. al., 2022. Behavioral problems and its associated factors among
siblings of children with developmental disabilities: analytical cross-sectional
study. Vulnerable Children and Youth Studies, pp.1-13.
Chen, X. and Tang, G., 2022. Solving static and dynamic multi-area economic dispatch
problems using an improved competitive swarm optimization
algorithm. Energy, 238, p.122035.
Das, K., Behera, R.L. and Paital, B., 2022. Socio-economic impact of COVID-19. In COVID-
19 in the Environment (pp. 153-190). Elsevier.
Rusakova, E.P. and Frolova, E.E., 2022. Current Problems of Digital Justice in the BRICS
Countries. In Smart Technologies for the Digitisation of Industry: Entrepreneurial
Environment (pp. 143-153). Springer, Singapore.
chevron_up_icon
1 out of 6
circle_padding
hide_on_mobile
zoom_out_icon
[object Object]