Research Report: Australian Unemployment Rate Analysis (2006-2016)
VerifiedAdded on 2019/12/17
|8
|1287
|278
Report
AI Summary
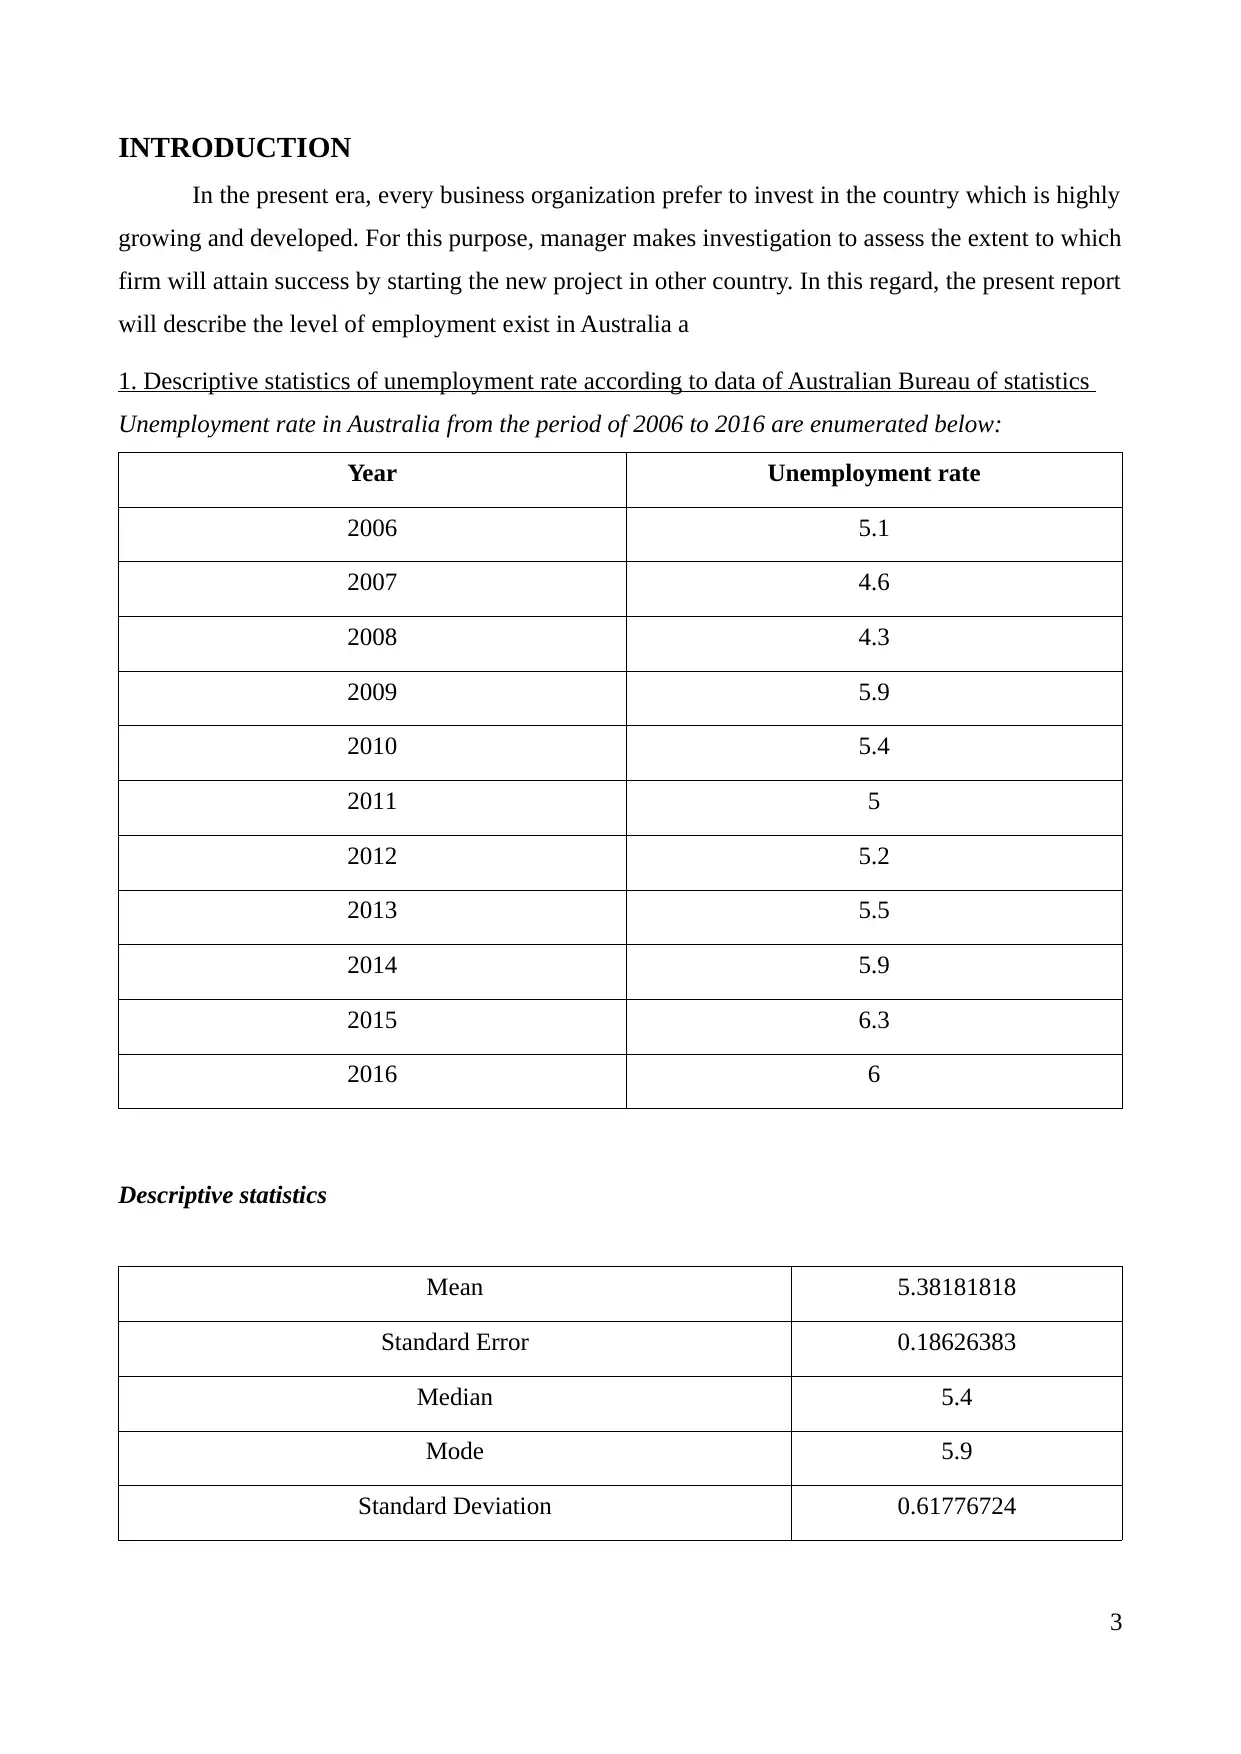
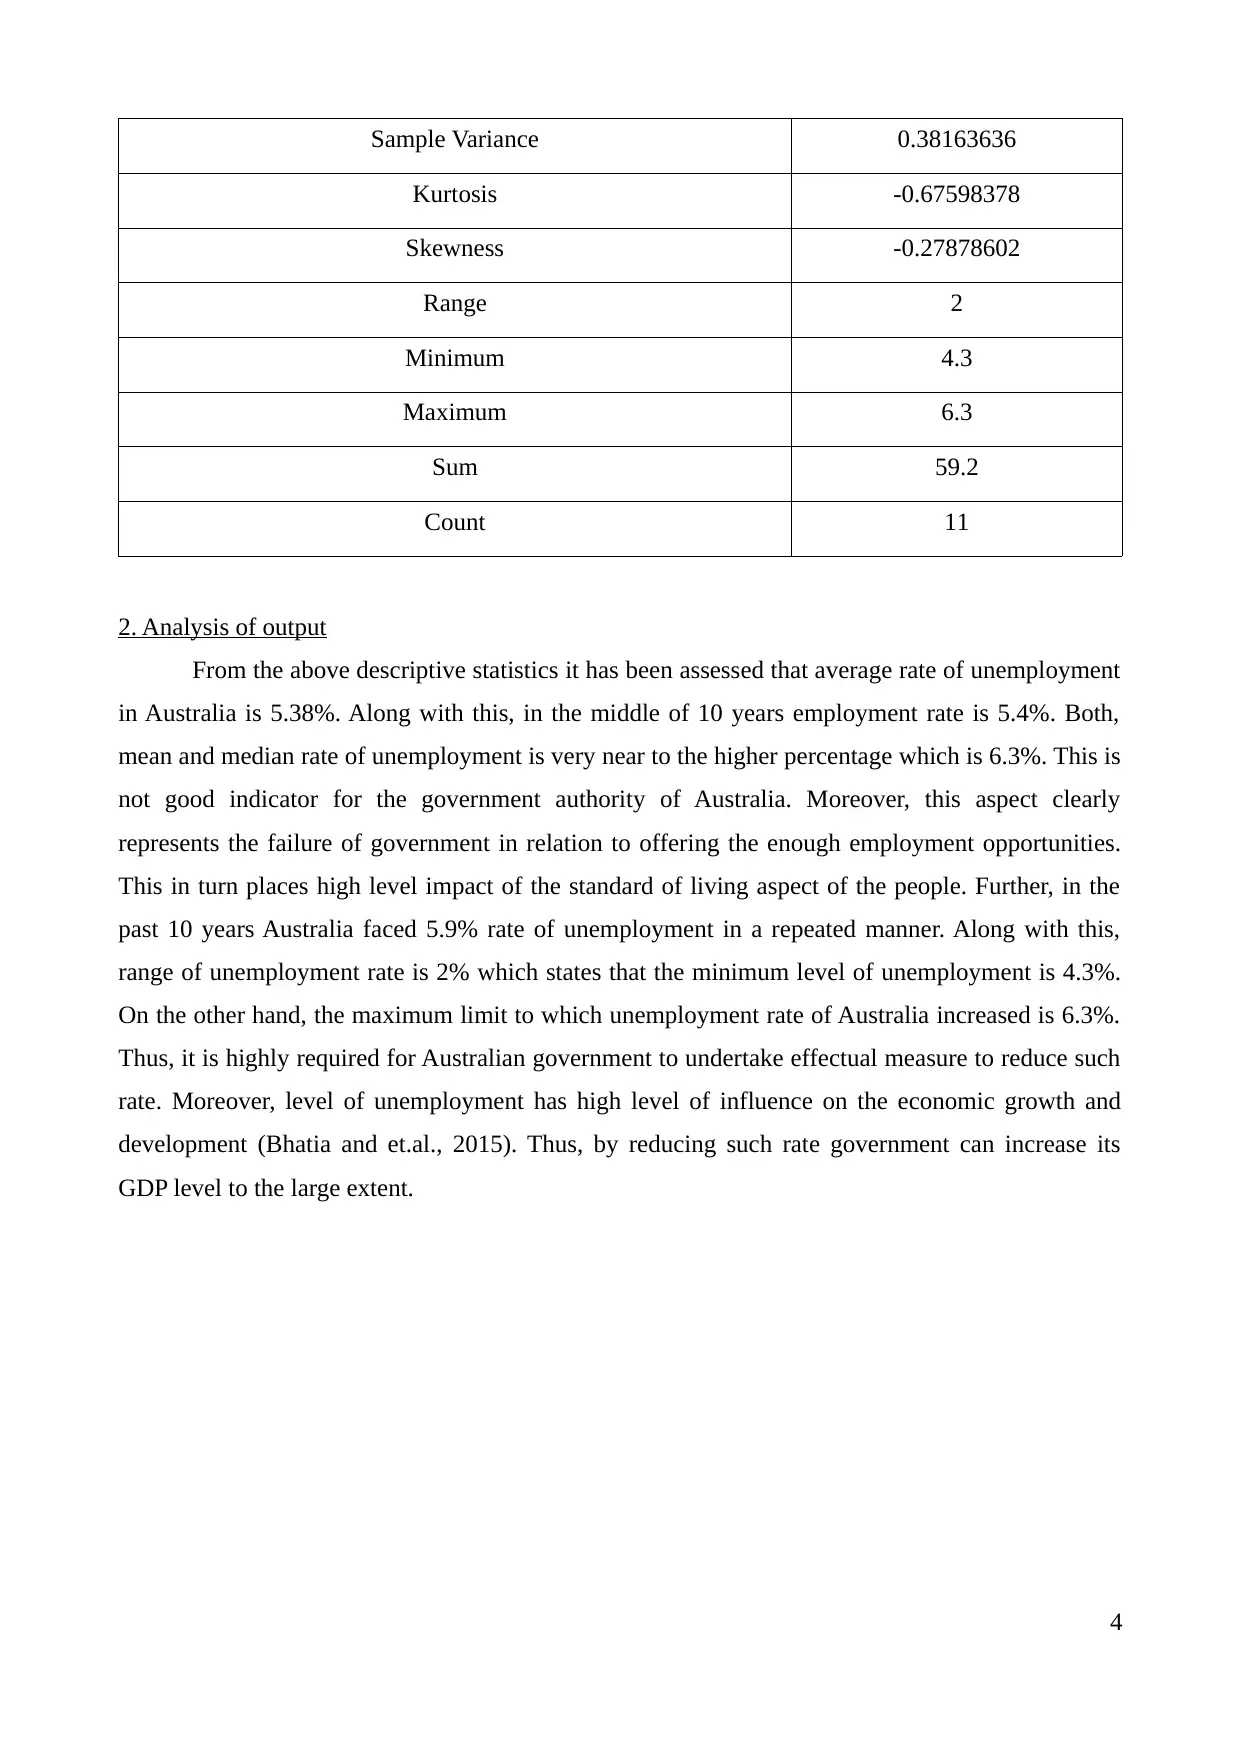
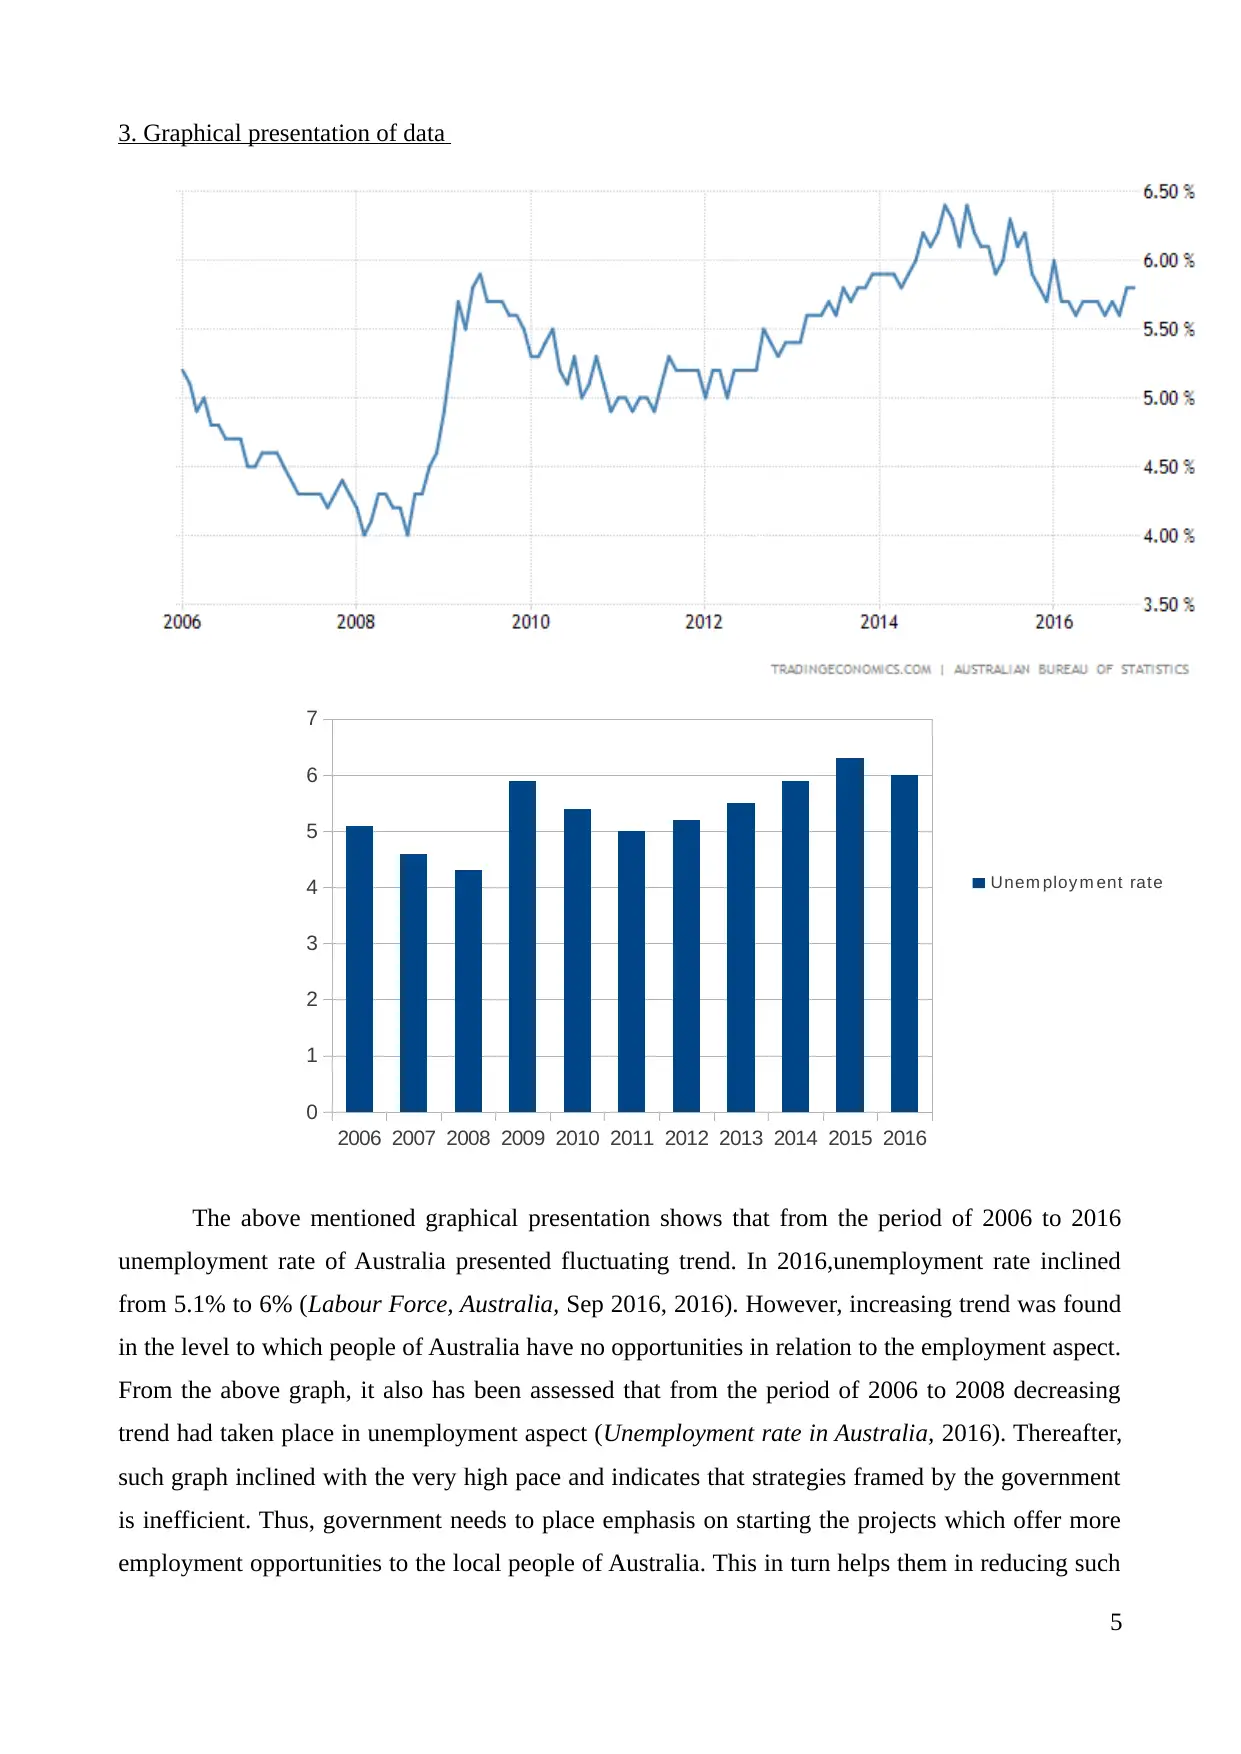
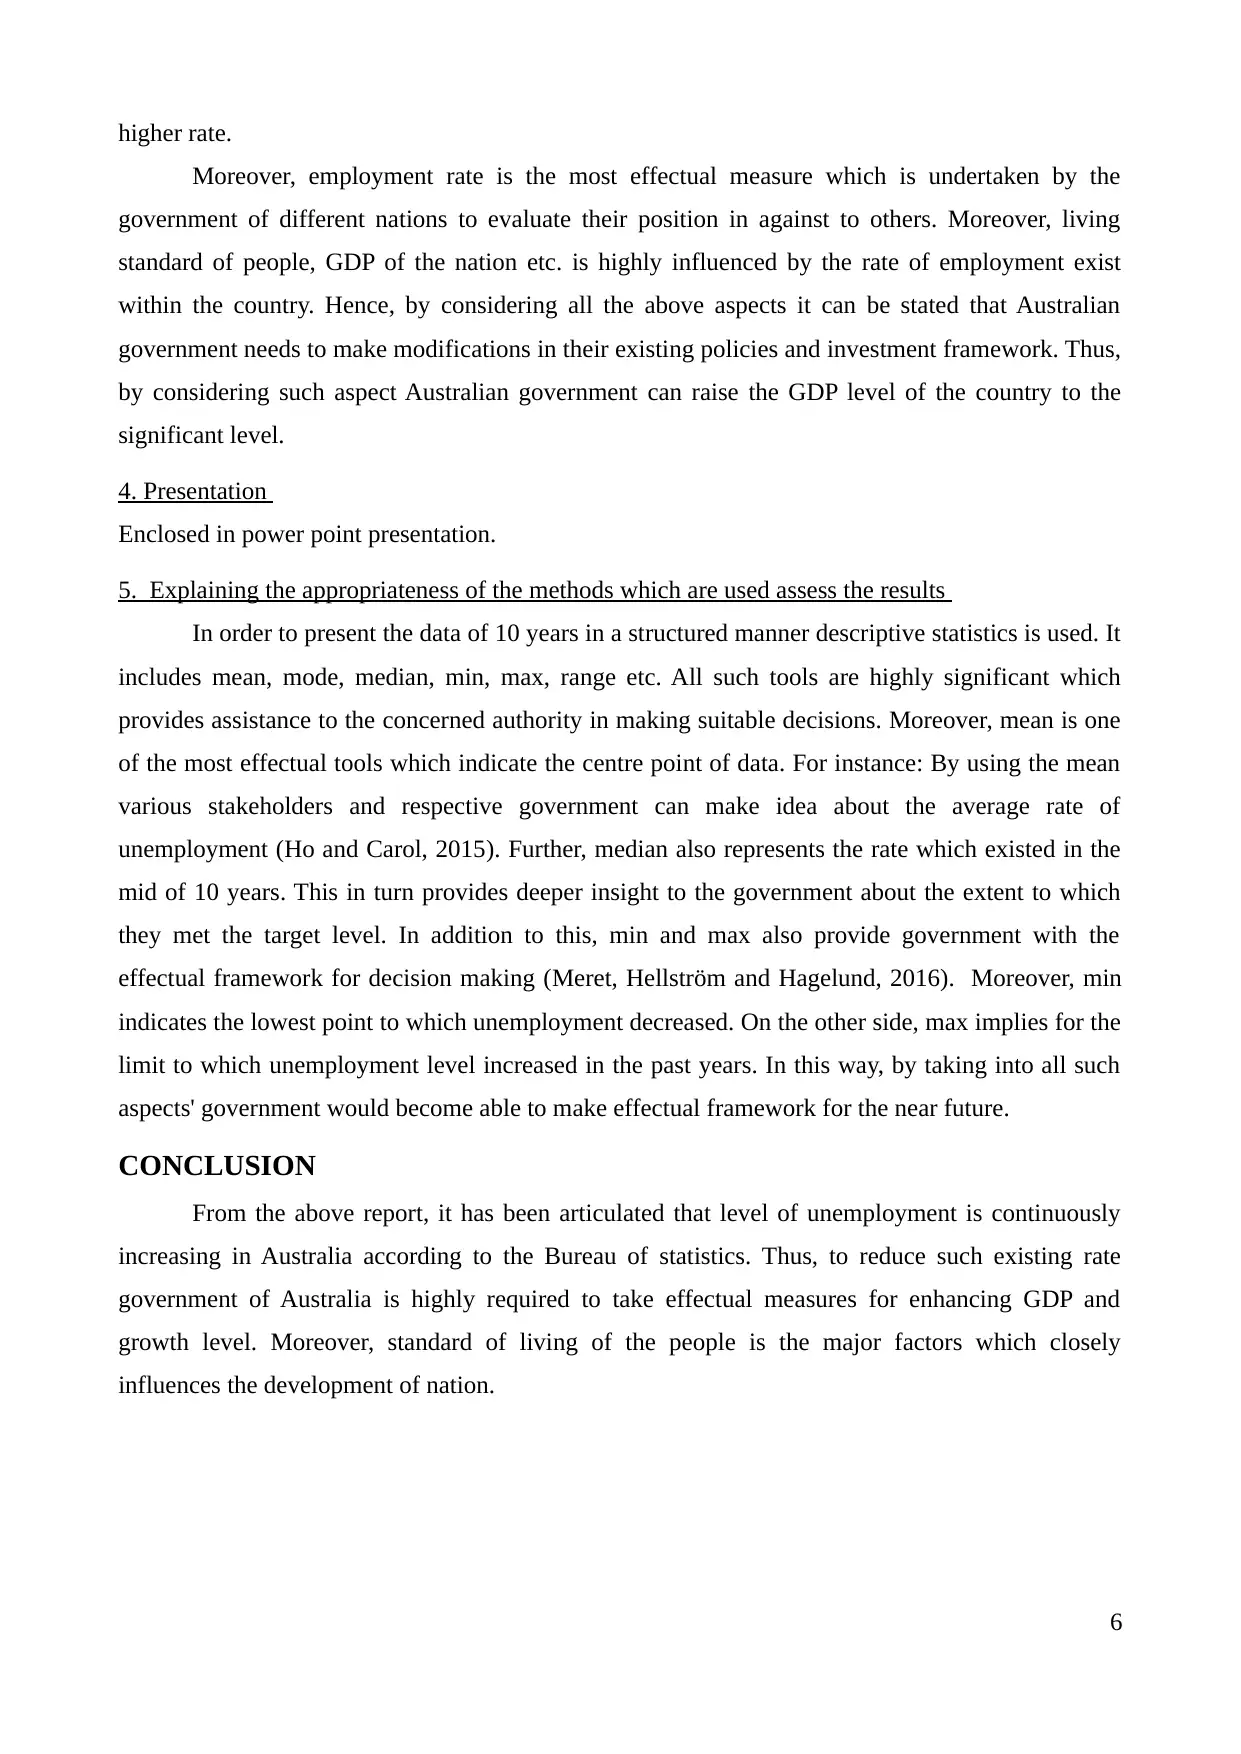
This report presents a research enquiry into the unemployment rate in Australia from 2006 to 2016, utilizing data from the Australian Bureau of Statistics. It begins with descriptive statistics, including mean, median, mode, standard deviation, and range, to provide a quantitative overview of unemployment trends. The analysis reveals an average unemployment rate of 5.38% over the decade, with a fluctuating trend and a range from 4.3% to 6.3%. The report highlights the implications of these figures for the Australian government and economy, emphasizing the need for effective measures to reduce unemployment and improve the standard of living. A graphical presentation further illustrates the trends, showing an initial decrease followed by an increase in the unemployment rate. The methods used, including descriptive statistics, are explained for their appropriateness in assessing the results. The report concludes by reiterating the importance of government intervention to boost GDP and improve the economic outlook. References to relevant academic sources and government publications are included.

Research Enquiry for Managers
1
1
Paraphrase This Document
Need a fresh take? Get an instant paraphrase of this document with our AI Paraphraser

Table of Contents
INTRODUCTION ...............................................................................................................................3
1. Descriptive statistics of unemployment rate according to data of Australian Bureau of statistics
.........................................................................................................................................................3
2. Analysis of output........................................................................................................................4
3. Graphical presentation of data ....................................................................................................5
4. Presentation .................................................................................................................................7
5. Explaining the appropriateness of the methods which are used assess the results ....................7
CONCLUSION ...................................................................................................................................8
REFERENCES ....................................................................................................................................9
2

INTRODUCTION
In the present era, every business organization prefer to invest in the country which is highly
growing and developed. For this purpose, manager makes investigation to assess the extent to which
firm will attain success by starting the new project in other country. In this regard, the present report
will describe the level of employment exist in Australia a
1. Descriptive statistics of unemployment rate according to data of Australian Bureau of statistics
Unemployment rate in Australia from the period of 2006 to 2016 are enumerated below:
Year Unemployment rate
2006 5.1
2007 4.6
2008 4.3
2009 5.9
2010 5.4
2011 5
2012 5.2
2013 5.5
2014 5.9
2015 6.3
2016 6
Descriptive statistics
Mean 5.38181818
Standard Error 0.18626383
Median 5.4
Mode 5.9
Standard Deviation 0.61776724
3
⊘ This is a preview!⊘
Do you want full access?
Subscribe today to unlock all pages.

Trusted by 1+ million students worldwide

Sample Variance 0.38163636
Kurtosis -0.67598378
Skewness -0.27878602
Range 2
Minimum 4.3
Maximum 6.3
Sum 59.2
Count 11
2. Analysis of output
From the above descriptive statistics it has been assessed that average rate of unemployment
in Australia is 5.38%. Along with this, in the middle of 10 years employment rate is 5.4%. Both,
mean and median rate of unemployment is very near to the higher percentage which is 6.3%. This is
not good indicator for the government authority of Australia. Moreover, this aspect clearly
represents the failure of government in relation to offering the enough employment opportunities.
This in turn places high level impact of the standard of living aspect of the people. Further, in the
past 10 years Australia faced 5.9% rate of unemployment in a repeated manner. Along with this,
range of unemployment rate is 2% which states that the minimum level of unemployment is 4.3%.
On the other hand, the maximum limit to which unemployment rate of Australia increased is 6.3%.
Thus, it is highly required for Australian government to undertake effectual measure to reduce such
rate. Moreover, level of unemployment has high level of influence on the economic growth and
development (Bhatia and et.al., 2015). Thus, by reducing such rate government can increase its
GDP level to the large extent.
4
Paraphrase This Document
Need a fresh take? Get an instant paraphrase of this document with our AI Paraphraser

3. Graphical presentation of data
The above mentioned graphical presentation shows that from the period of 2006 to 2016
unemployment rate of Australia presented fluctuating trend. In 2016,unemployment rate inclined
from 5.1% to 6% (Labour Force, Australia, Sep 2016, 2016). However, increasing trend was found
in the level to which people of Australia have no opportunities in relation to the employment aspect.
From the above graph, it also has been assessed that from the period of 2006 to 2008 decreasing
trend had taken place in unemployment aspect (Unemployment rate in Australia, 2016). Thereafter,
such graph inclined with the very high pace and indicates that strategies framed by the government
is inefficient. Thus, government needs to place emphasis on starting the projects which offer more
employment opportunities to the local people of Australia. This in turn helps them in reducing such
5
2006 2007 2008 2009 2010 2011 2012 2013 2014 2015 2016
0
1
2
3
4
5
6
7
Unem ploy m ent rate

higher rate.
Moreover, employment rate is the most effectual measure which is undertaken by the
government of different nations to evaluate their position in against to others. Moreover, living
standard of people, GDP of the nation etc. is highly influenced by the rate of employment exist
within the country. Hence, by considering all the above aspects it can be stated that Australian
government needs to make modifications in their existing policies and investment framework. Thus,
by considering such aspect Australian government can raise the GDP level of the country to the
significant level.
4. Presentation
Enclosed in power point presentation.
5. Explaining the appropriateness of the methods which are used assess the results
In order to present the data of 10 years in a structured manner descriptive statistics is used. It
includes mean, mode, median, min, max, range etc. All such tools are highly significant which
provides assistance to the concerned authority in making suitable decisions. Moreover, mean is one
of the most effectual tools which indicate the centre point of data. For instance: By using the mean
various stakeholders and respective government can make idea about the average rate of
unemployment (Ho and Carol, 2015). Further, median also represents the rate which existed in the
mid of 10 years. This in turn provides deeper insight to the government about the extent to which
they met the target level. In addition to this, min and max also provide government with the
effectual framework for decision making (Meret, Hellström and Hagelund, 2016). Moreover, min
indicates the lowest point to which unemployment decreased. On the other side, max implies for the
limit to which unemployment level increased in the past years. In this way, by taking into all such
aspects' government would become able to make effectual framework for the near future.
CONCLUSION
From the above report, it has been articulated that level of unemployment is continuously
increasing in Australia according to the Bureau of statistics. Thus, to reduce such existing rate
government of Australia is highly required to take effectual measures for enhancing GDP and
growth level. Moreover, standard of living of the people is the major factors which closely
influences the development of nation.
6
⊘ This is a preview!⊘
Do you want full access?
Subscribe today to unlock all pages.

Trusted by 1+ million students worldwide

REFERENCES
Books and Journals
Bhatia, S. and et.al., 2015. Does reservation alter the mind sets? A research enquiry vis-à-vis fear
of failure, locus of control and personal effectiveness among undergraduate girl students
across disciplines. Indian Journal of Community Psychology. 11(2). pp.326-337.
Ho, A.D. and Carol, C.Y., 2015. Descriptive Statistics for Modern Test Score Distributions
Skewness, Kurtosis, Discreteness, and Ceiling Effects. Educational and Psychological
Measurement. 75(3). pp.365-388.
Meret, S., Hellström, A. and Hagelund, A., 2016. Friend, Foe or Tolerated Guest? Role and
Position of the Sweden Democrats, the Danish People's Party and the Progress Party in
Mainstream Press Editorials. Descriptive statistics and Frame Analysis. In Trust Us! the
Sweden Democrats in Sweden, the Progress Party in Norway and the Danish People´ s
Party in Denmark. Berghahn Books.
Online
Unemployment rate in Australia. 2016. [Online]. Available through:
<http://www.tradingeconomics.com/australia/unemployment-rate
>. [Accessed on 20th October 2016].
Labour Force, Australia, Sep 2016. 2016. [Online]. Available through:
<http://www.abs.gov.au/ausstats/abs@.nsf/mf/6202.0>. [Accessed on 20th October 2016].
7
Paraphrase This Document
Need a fresh take? Get an instant paraphrase of this document with our AI Paraphraser

8
1 out of 8
Related Documents
Your All-in-One AI-Powered Toolkit for Academic Success.
+13062052269
info@desklib.com
Available 24*7 on WhatsApp / Email
Unlock your academic potential
Copyright © 2020–2026 A2Z Services. All Rights Reserved. Developed and managed by ZUCOL.


