Healthcare Systems: A Comparative Study of Australia and the U.S.
VerifiedAdded on 2023/06/15
|18
|3432
|160
Report
AI Summary
This report provides a comparative analysis of the healthcare systems in Australia and the United States, focusing on key parameters such as funding, governance, population health indicators, and health system performance indicators. It examines the funding mechanisms in both countries, highlighting the roles of government, private insurance, and out-of-pocket expenses. The report also compares the governance structures, including the responsibilities of federal, state, and territory governments in Australia, and the role of the U.S. Department of Health and Human Services. Furthermore, it presents a detailed comparison of population health indicators like infant mortality rate, maternal mortality rate, and life expectancy, as well as health system performance indicators such as obesity, diabetes, asthma, hypertension, and cancer prevalence. The analysis reveals differences in healthcare costs, quality, and equity between the two countries, with Australia generally ranking higher in overall healthcare system performance despite the U.S. spending a significantly larger portion of its GDP on healthcare.

Running head: HEALTHCARE SYSTEMS
Healthcare systems
Name of the Student
Name of the University
Author note
Healthcare systems
Name of the Student
Name of the University
Author note
Paraphrase This Document
Need a fresh take? Get an instant paraphrase of this document with our AI Paraphraser
1HEALTHCARE SYSTEMS
In today’s world scenario, international comparisons are made to evaluate the
performance of healthcare system being a fairly common approach that support or refute
arguments for change in the healthcare system. The healthcare comparisons between countries
are made influencing major policy moves and healthcare spending. Moreover, international
healthcare system comparisons act as additional lens on quality of care that is provided
nationally. Through healthcare comparison report assessment, policy-makers get benchmark
allowing them to identify areas performing below or above expectations. More importantly, this
comparison provides impetus for understanding the driving force for performance and guide
them looking for potential solutions. However, international comparisons need funding
arrangements serving different populations as well as facing challenges in limited resources,
demographic change and rising costs. Therefore, to study the existing organizations and
structures of healthcare systems, the following discussion involves comparisons made between
two countries, Australia and United States on the following six parameters.
Funding for healthcare systems is critical for achieving universal health coverage. The
developments made in health financing areas determine that whether health services are available
for everyone affording health services when required. Taking this parameter into consideration,
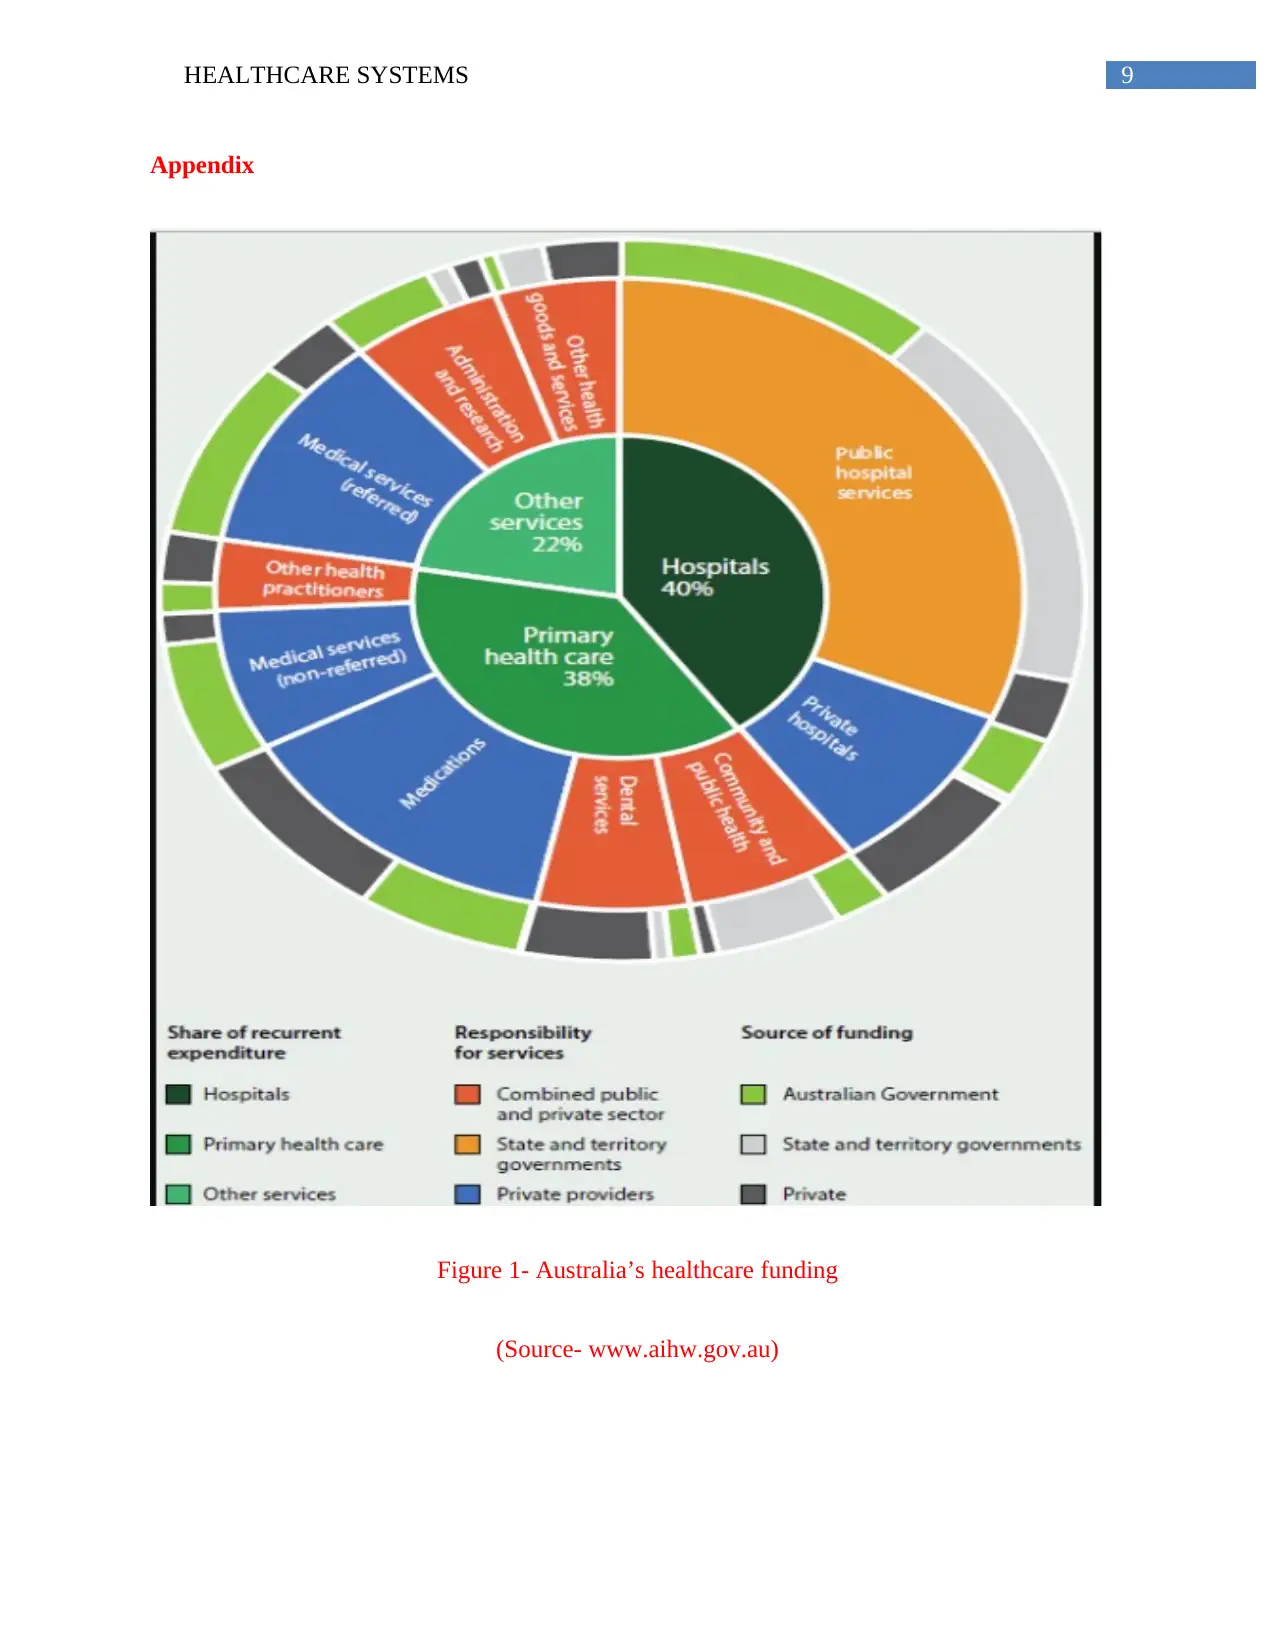
Australia’s funding system gives access to comprehensive services that are funded publicly by
general taxation. This system is responsible for funding healthcare services in territories and
states delivering public health services and local governments providing environmental health
programs. It is funded by different government levels from local to national level supported by
health insurance (Aihw.gov.au, 2018). Medicare is funded and administered by Australian
government consisting of three major healthcare components; medical services pharmaceuticals
prescription and treatment given in hospitals jointly funded by Australian and territory/state
In today’s world scenario, international comparisons are made to evaluate the
performance of healthcare system being a fairly common approach that support or refute
arguments for change in the healthcare system. The healthcare comparisons between countries
are made influencing major policy moves and healthcare spending. Moreover, international
healthcare system comparisons act as additional lens on quality of care that is provided
nationally. Through healthcare comparison report assessment, policy-makers get benchmark
allowing them to identify areas performing below or above expectations. More importantly, this
comparison provides impetus for understanding the driving force for performance and guide
them looking for potential solutions. However, international comparisons need funding
arrangements serving different populations as well as facing challenges in limited resources,
demographic change and rising costs. Therefore, to study the existing organizations and
structures of healthcare systems, the following discussion involves comparisons made between
two countries, Australia and United States on the following six parameters.
Funding for healthcare systems is critical for achieving universal health coverage. The
developments made in health financing areas determine that whether health services are available
for everyone affording health services when required. Taking this parameter into consideration,
Australia’s funding system gives access to comprehensive services that are funded publicly by
general taxation. This system is responsible for funding healthcare services in territories and
states delivering public health services and local governments providing environmental health
programs. It is funded by different government levels from local to national level supported by
health insurance (Aihw.gov.au, 2018). Medicare is funded and administered by Australian
government consisting of three major healthcare components; medical services pharmaceuticals
prescription and treatment given in hospitals jointly funded by Australian and territory/state
2HEALTHCARE SYSTEMS
governments. Although, there is Medicare levy, it comprises of small part of total finance having
high dependence on out of pockets with 17% of total expenditure. Funding through government
dominates with total expenditure of 43% provided by Commonwealth and 25% by other levels of
government exhibiting that Commonwealth plays a dominant role in the policy-making process.
In Australia, total GDP health spending during the year 2015-2016, was $170.4 billion, $6.0
billion (3.6%) billion high than previous years where it was the consecutive fourth year where
growth was seen to be below 10 average years - 4.7% (AIHW, 2018).
On a contrary, United States healthcare funding system is high as compared to other
countries as in this case, Australia putting a strain on overall economy that necessarily does not
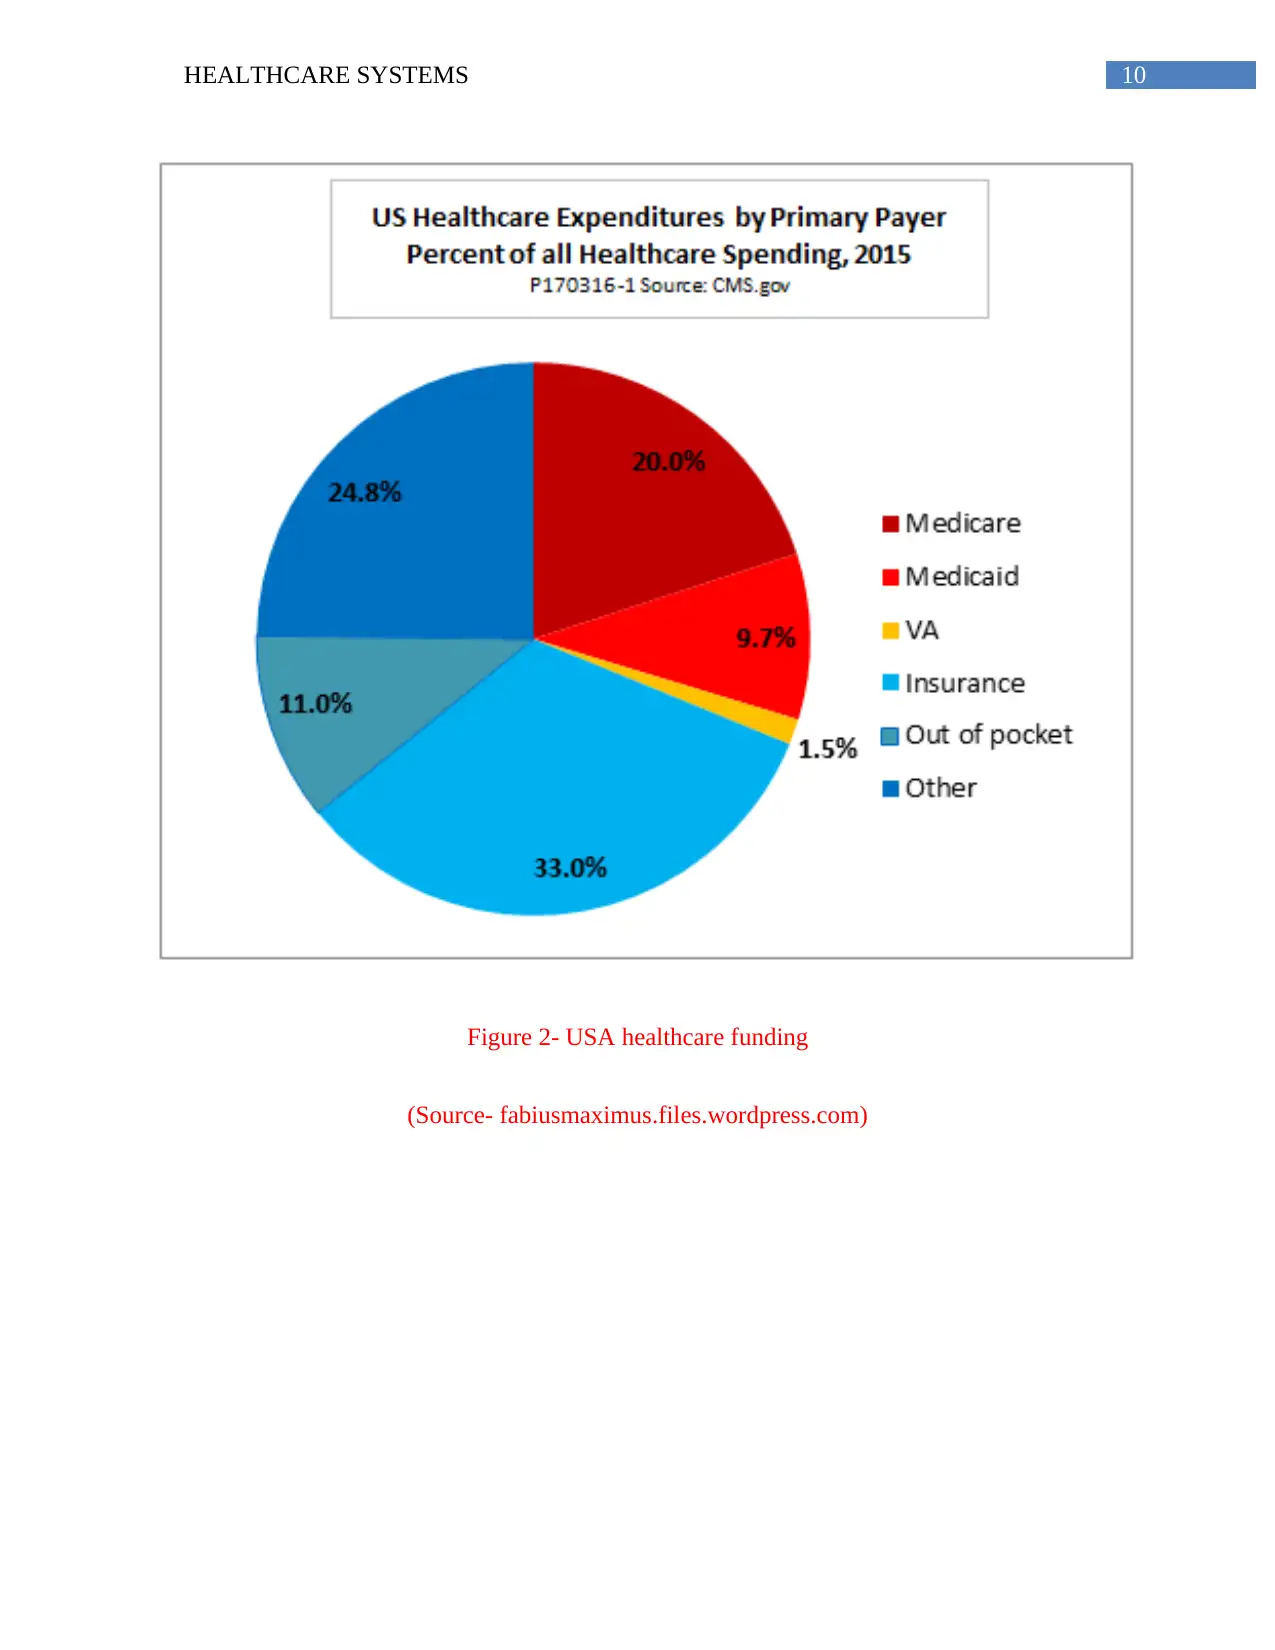
translate into better health. Like Australia, healthcare funding is paid by Medicaid and Medicare,
private insurance plans (through employers) and individual’s own funds or out-of-pocket funding
system. Government insurance programs are the largest where Medicare funds healthcare for
people with long-term treatment, disabled and elderly. Medicaid fund healthcare for the people
with disabilities or living under poverty level. Private insurance is purchased from not-for-profit
or for-profit insurance companies shared by employees and employers where amount of money
spent by employers on health insurance of employee is not taxable for employee. Affordable
Care Act (2014) intended to increase affordability, availability and health insurance usage
creating incentives for employers providing health insurance. In out of pocket system, people
who are not covered under health insurance, people pay from their pockets. However, flexible
spending and health savings accounts are offered by employers who choose to pay out of pocket
health expenses through these small accounts. In 2016, U.S. GDP healthcare spending increased
to 4.3% reaching $3.3 trillion ($10,348 per person). As a share of nation’s GDP, 17.9% is
accounted for health spending (Cms.gov, 2018).
governments. Although, there is Medicare levy, it comprises of small part of total finance having
high dependence on out of pockets with 17% of total expenditure. Funding through government
dominates with total expenditure of 43% provided by Commonwealth and 25% by other levels of
government exhibiting that Commonwealth plays a dominant role in the policy-making process.
In Australia, total GDP health spending during the year 2015-2016, was $170.4 billion, $6.0
billion (3.6%) billion high than previous years where it was the consecutive fourth year where
growth was seen to be below 10 average years - 4.7% (AIHW, 2018).
On a contrary, United States healthcare funding system is high as compared to other
countries as in this case, Australia putting a strain on overall economy that necessarily does not
translate into better health. Like Australia, healthcare funding is paid by Medicaid and Medicare,
private insurance plans (through employers) and individual’s own funds or out-of-pocket funding
system. Government insurance programs are the largest where Medicare funds healthcare for
people with long-term treatment, disabled and elderly. Medicaid fund healthcare for the people
with disabilities or living under poverty level. Private insurance is purchased from not-for-profit
or for-profit insurance companies shared by employees and employers where amount of money
spent by employers on health insurance of employee is not taxable for employee. Affordable
Care Act (2014) intended to increase affordability, availability and health insurance usage
creating incentives for employers providing health insurance. In out of pocket system, people
who are not covered under health insurance, people pay from their pockets. However, flexible
spending and health savings accounts are offered by employers who choose to pay out of pocket
health expenses through these small accounts. In 2016, U.S. GDP healthcare spending increased
to 4.3% reaching $3.3 trillion ($10,348 per person). As a share of nation’s GDP, 17.9% is
accounted for health spending (Cms.gov, 2018).
⊘ This is a preview!⊘
Do you want full access?
Subscribe today to unlock all pages.
Trusted by 1+ million students worldwide
3HEALTHCARE SYSTEMS
The Australian health system and system governance is multi-layered sharing funding
and responsibility by individuals, governments, private health insurers and health providers.
Primary care is the primary level of care provided by GPs referring to Medicare services
providing subsidised or free benefits. Acute care is provided in public or private hospitals. Public
hospital provides treatment free to public patients subjected to long waiting hours. On the other
hand, private hospitals work towards catering to the needs of patients who want private
accommodation or choice of doctor including specialist services. Funding and regulation of
health system is shared between Commonwealth, territory and state governments (Aph.gov.au,
2018).
Commonwealth has responsibility at various levels. Medicare is the national scheme
providing subsidised or free access to diagnostic, medical and allied services under Medical
Benefits Schedule (MBS). General taxation revenue and 1.5% of Medicare levy fund Medicare
that offset high-out-of pocket health costs. Pharmaceutical Benefits Scheme (PBS) subsidises the
universal access to prescription medicines. The purchasing of vaccines, aged care services
subsidization, medical research grants, veteran services, Aboriginal and TSI healthcare services,
health professional education and national coordination for leadership and responding to health
emergencies (Aph.gov.au, 2018).
Territories and states are have the responsibilityfor administration , management of
public hospitals, preventive services delivery, funding and management of mental health and,
dental clinics, community services, ambulance and emergency services, patient transport
schemes, subsidy, handling regulation and food safety and monitoring of other premises of
health. Finally, territories, states and Commonwealth shares responsibilities under the Council of
Australian Governments (COAG) that includes public hospital services funding, preventive
Paraphrase This Document
Need a fresh take? Get an instant paraphrase of this document with our AI Paraphraser
4HEALTHCARE SYSTEMS
services, shared palliative care, mental health services and national health emergency responds
(Aph.gov.au, 2018).
On a contrary, the U.S. health system governance is different from Australian system
comprising of federal government, The U.S. Department of Health and Human Services (HHS)
being the principal agency for providing healthcare services. HHS comprises of many
organizations; Centres for Medicare and Medicaid services, Centres for Disease Control and
Prevention (CDC) and National Institutes of Health. Health Resources and Services
Administration Food and Drug Administration (FDA) and Agency for Healthcare Research and
Quality are also present that is similar to Australian healthcare system mentioned above
(International.commonwealthfund.org, 2018).
Publicly financed healthcare is funded by Medicare through premiums, payrolls, federal
general revenues that are tax-funded. Privately funded healthcare account for 39% is also
similar too Australia’s private insurance system which is tax-exempt and voluntary premiums
shared by workers and employers on employer-specific basis. Primary care accounts for one
third of U.S. physicians operating in group or small self owned practices including nurses and
clinical staffs paid by practice. In U.S. physicians are paid through negotiated fees, capitation
and administrative set fees. Outpatient specialist care work in both hospital and private practice
provide access to various specialists. Hospitals also include private hospitals who are paid
through per-dim charges or per-service, bundled or per-case payments where hospitals are held
accountable for services following discharge and readmissions. Mental health services are also
provided that work through provider type and payer. Long-term care is provided by myriad of
nonprofits and profit providers paid through provider type and payer. From the above
comparison, it can be deduced that U.S healthcare costs are high and as compared to Australia
5HEALTHCARE SYSTEMS
ranking last overall. The U.S. quality of healthcare rank fifth, however in terms of equity,
efficiency and citizen healthiness ranked last (International.commonwealthfund.org, 2018).
Population Health Indicators like Infant Mortality Rate (IMR), Maternal Mortality Rate
(MMR), and Life Expectancy at birth are also compared between the two countries. Among the
MMR 2017 country rank list, Australia ranks 120th position (6 deaths/100,000 live births)
whereas United States ranks 112 (114 deaths/100,000 live births) for the year 2015. This
suggests that MMR is more in U.S. as compared to Australia indicating poor management during
childbirth or complicated pregnancy for a specified year being worst in the list of developed
countries. This also indicates that funding is poor in case of child and maternal health
(aihw.gov.au, 2018).
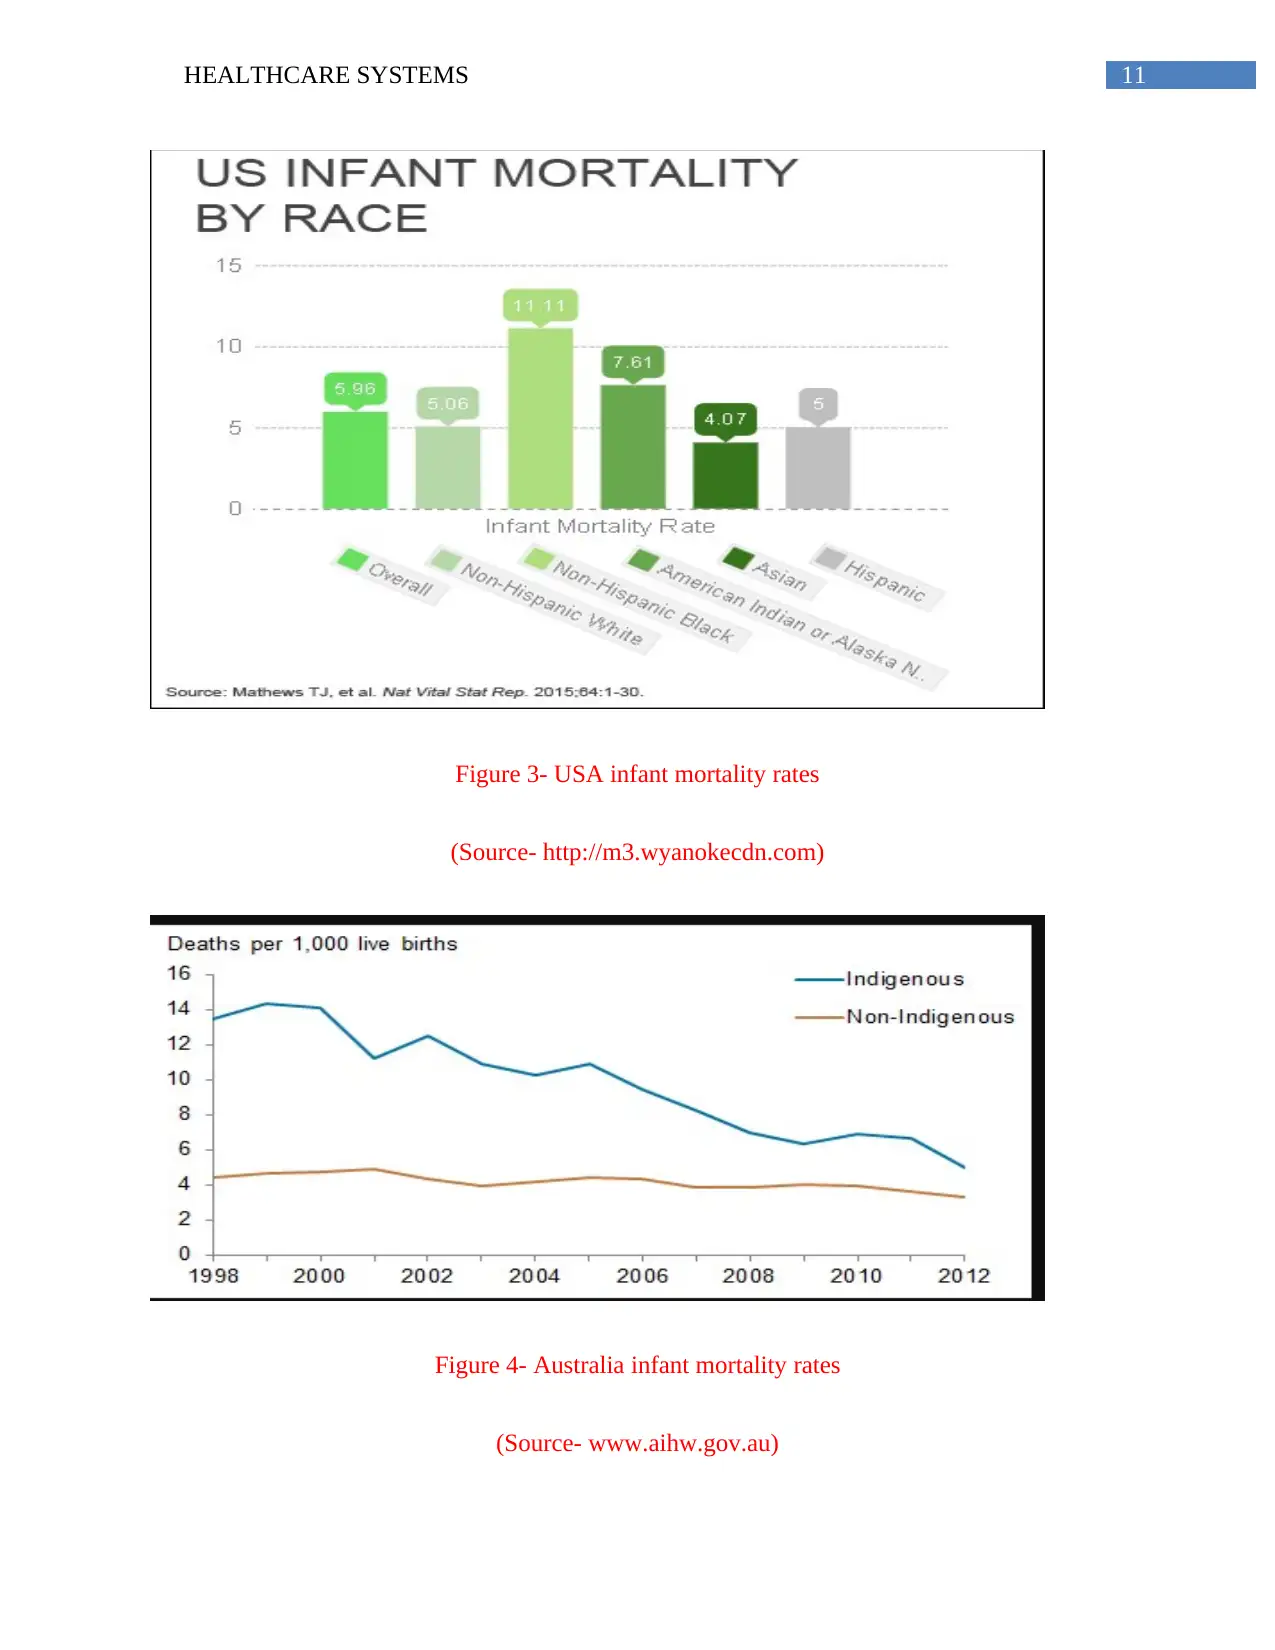
Infant mortality rate (IMR) for Australia as per 2015 statistics include 4.6 deaths/1,000
live births for males and 3.9 deaths/1,000 live births for males on an average of 4.3 deaths/1,000
live deaths. On a contrary, IMR for males is 6.3 deaths/1000 live births and 5.3 deaths/1,000 live
births for females on an average 5.8 deaths/1,000 live deaths. This statistics clearly depict that
there is lack of healthcare services, poor maternal health, postnatal and prenatal care contributing
to increase IMR in U.S. as compared to Australia that shows better statistics (Abs.gov.au, 2018).
Life expectancy at birth for females in Australia and U.S. is 84.1 and 81.1 (years) ranked
12th and 43th respectively. Based on this statistics, it can be concluded that life expectancy in
Australia is 4% more as compared to U.S. In case of life expectancy at birth for males in
Australia is 81.85 ranking 11th and 78.64 for U.S. ranking 40th in the world. This ranking
suggests that it is again 4% more than U.S. This parameter also shows that better medical
services are available in Australia than U.S (Abs.gov.au, 2018).
ranking last overall. The U.S. quality of healthcare rank fifth, however in terms of equity,
efficiency and citizen healthiness ranked last (International.commonwealthfund.org, 2018).
Population Health Indicators like Infant Mortality Rate (IMR), Maternal Mortality Rate
(MMR), and Life Expectancy at birth are also compared between the two countries. Among the
MMR 2017 country rank list, Australia ranks 120th position (6 deaths/100,000 live births)
whereas United States ranks 112 (114 deaths/100,000 live births) for the year 2015. This
suggests that MMR is more in U.S. as compared to Australia indicating poor management during
childbirth or complicated pregnancy for a specified year being worst in the list of developed
countries. This also indicates that funding is poor in case of child and maternal health
(aihw.gov.au, 2018).
Infant mortality rate (IMR) for Australia as per 2015 statistics include 4.6 deaths/1,000
live births for males and 3.9 deaths/1,000 live births for males on an average of 4.3 deaths/1,000
live deaths. On a contrary, IMR for males is 6.3 deaths/1000 live births and 5.3 deaths/1,000 live
births for females on an average 5.8 deaths/1,000 live deaths. This statistics clearly depict that
there is lack of healthcare services, poor maternal health, postnatal and prenatal care contributing
to increase IMR in U.S. as compared to Australia that shows better statistics (Abs.gov.au, 2018).
Life expectancy at birth for females in Australia and U.S. is 84.1 and 81.1 (years) ranked
12th and 43th respectively. Based on this statistics, it can be concluded that life expectancy in
Australia is 4% more as compared to U.S. In case of life expectancy at birth for males in
Australia is 81.85 ranking 11th and 78.64 for U.S. ranking 40th in the world. This ranking
suggests that it is again 4% more than U.S. This parameter also shows that better medical
services are available in Australia than U.S (Abs.gov.au, 2018).
⊘ This is a preview!⊘
Do you want full access?
Subscribe today to unlock all pages.
Trusted by 1+ million students worldwide
6HEALTHCARE SYSTEMS
Health System Performance Indicators are also compared between the two countries.
Low birth weight infants in Australia as per 2015-2016 statistics is 1.4% as per Agpar scores
depicting low scores it terms of birth weight weighing less than 1500 grams. On a contrary, in
U.S. low birth weight accounts for 8.07% weigh below 2500 grams with 9.63% preterm born.
This suggests that children are born in poor and unequal environments in U.S. as compared to
Australia (Carinci et al., 2015).
Obesity in Australia is 29% and 36.2% in United States respectively suggesting that it is
major health issue in the country as compared to Australia giving rise to co-morbid conditions
like coronary heart disease (Walls et al., 2012). In terms of diabetes, about 9.4% or 30.3 million
people suffer from it as per 2015 statistics with 1.25 million suffering from type one diabetes. In
Australia, 1.2 million (6%) people suffer from diabetes as per 2014-2015 statistics. This depicts
that U.S. has high diabetes prevalence than Australia (Guariguata et al., 2014). As per 2016
statistics, 2.5 million people or 10.8% Australians had asthma during the year 2014-2015 that
increased since 2008 (9.9%). Females has high asthma rates than males in 2014-2015 being
asthma common and consistent over the years. In U.S. about 300 million people suffer from
asthma showing that there is high prevalence in the country as compared to Australia as per 2017
statistics (Ford, 2015). This also shows that about many children and women were prone to
condition. Hypertension in U.S. is 54% or 75 million suggesting one in three adults suffering
from it increasing cost of healthcare. About 11.3% or 2.6 million Australians have reported
hypertension with highest prevalence among males than females with 12.0% and 10.7%
respectively. In this parameter, it also suggests that U.S. has high hypertension prevalence than
Australia (Venuthurupalli et al., 2018). As per American Cancer Society, in 2015 about 1.5
million people suffered from cancer, although a drop by 22%. Cancer in Australia is reported to
Paraphrase This Document
Need a fresh take? Get an instant paraphrase of this document with our AI Paraphraser
7HEALTHCARE SYSTEMS
be 410,530 people suffering from the disease. This parameter explains that cancer prevails more
in U.S. than in Australia (Siegel et al., 2015).
Taking the quality and safety of healthcare system into consideration, as declared by
American researchers, Australian healthcare system ranked best among the developed countries
as compared to United States. The mixed public-private system is the second best among the
developed countries. The above statistics on MMR and IMR states that U.S. has the highest rate
and experienced smallest reduction during the recent years despite of spending twice,
performance in quality of healthcare is lacklustre. The healthcare system of Australia and U.S. is
similar having mixed private-public structure where both private and public is providing funding
delivering healthcare. However, there are differences in management, orientation and quality of
healthcare delivery (Squires & Anderson, 2015).
Australian healthcare system believes in the fact that every person should have equal
rights to health promoting equity. However, equity is in much debate. This equity is non-existent
among U.S. healthcare system, as they believe that independence is associated with monetary
success. Americans believe that people should be responsible for their health. This ideology has
led to the inequality in healthcare with around 45 million people without any insurance coverage
(Moses et al., 2015). On a contrary, Australian healthcare system opposes American system
where equity is supported for public sector as compared to private sector. The privatized system
has led to high quality of care and efficient service delivery with low waiting lists being the
highest spender of money in healthcare. However, service delivery and quality of care is not
efficient in Australia with long waiting hours making access to resources difficult. The access to
healthcare is lacking as expensive healthcare costs makes it greatly inaccessible for Americans
(Mossialos et al., 2016).
8HEALTHCARE SYSTEMS
Therefore, from the above discussion, it can be concluded that although, healthcare
spending is more in America, Australia provides better equity to healthcare services, although
limited as compared to U.S. This is quite evident from the high rates of MMR, IMR, diabetes,
obesity, hypertension when compared to Australian healthcare system. The mixed market of
Australia although has short healthcare services efficiency, they produces more access and equity
for their people as compared to U.S.
⊘ This is a preview!⊘
Do you want full access?
Subscribe today to unlock all pages.
Trusted by 1+ million students worldwide
9HEALTHCARE SYSTEMS
Appendix
Figure 1- Australia’s healthcare funding
(Source- www.aihw.gov.au)
Appendix
Figure 1- Australia’s healthcare funding
(Source- www.aihw.gov.au)
Paraphrase This Document
Need a fresh take? Get an instant paraphrase of this document with our AI Paraphraser
10HEALTHCARE SYSTEMS
Figure 2- USA healthcare funding
(Source- fabiusmaximus.files.wordpress.com)
Figure 2- USA healthcare funding
(Source- fabiusmaximus.files.wordpress.com)
11HEALTHCARE SYSTEMS
Figure 3- USA infant mortality rates
(Source- http://m3.wyanokecdn.com)
Figure 4- Australia infant mortality rates
(Source- www.aihw.gov.au)
Figure 3- USA infant mortality rates
(Source- http://m3.wyanokecdn.com)
Figure 4- Australia infant mortality rates
(Source- www.aihw.gov.au)
⊘ This is a preview!⊘
Do you want full access?
Subscribe today to unlock all pages.
Trusted by 1+ million students worldwide
1 out of 18
Related Documents


Your All-in-One AI-Powered Toolkit for Academic Success.
+13062052269
info@desklib.com
Available 24*7 on WhatsApp / Email
![[object Object]](/_next/static/media/star-bottom.7253800d.svg)
Unlock your academic potential
Copyright © 2020–2026 A2Z Services. All Rights Reserved. Developed and managed by ZUCOL.