Business Economics: Australia and USA Macroeconomic Report (1995-2015)

Verified

Added on  2020/11/23

|28
|3728
|291
Report
AI Summary
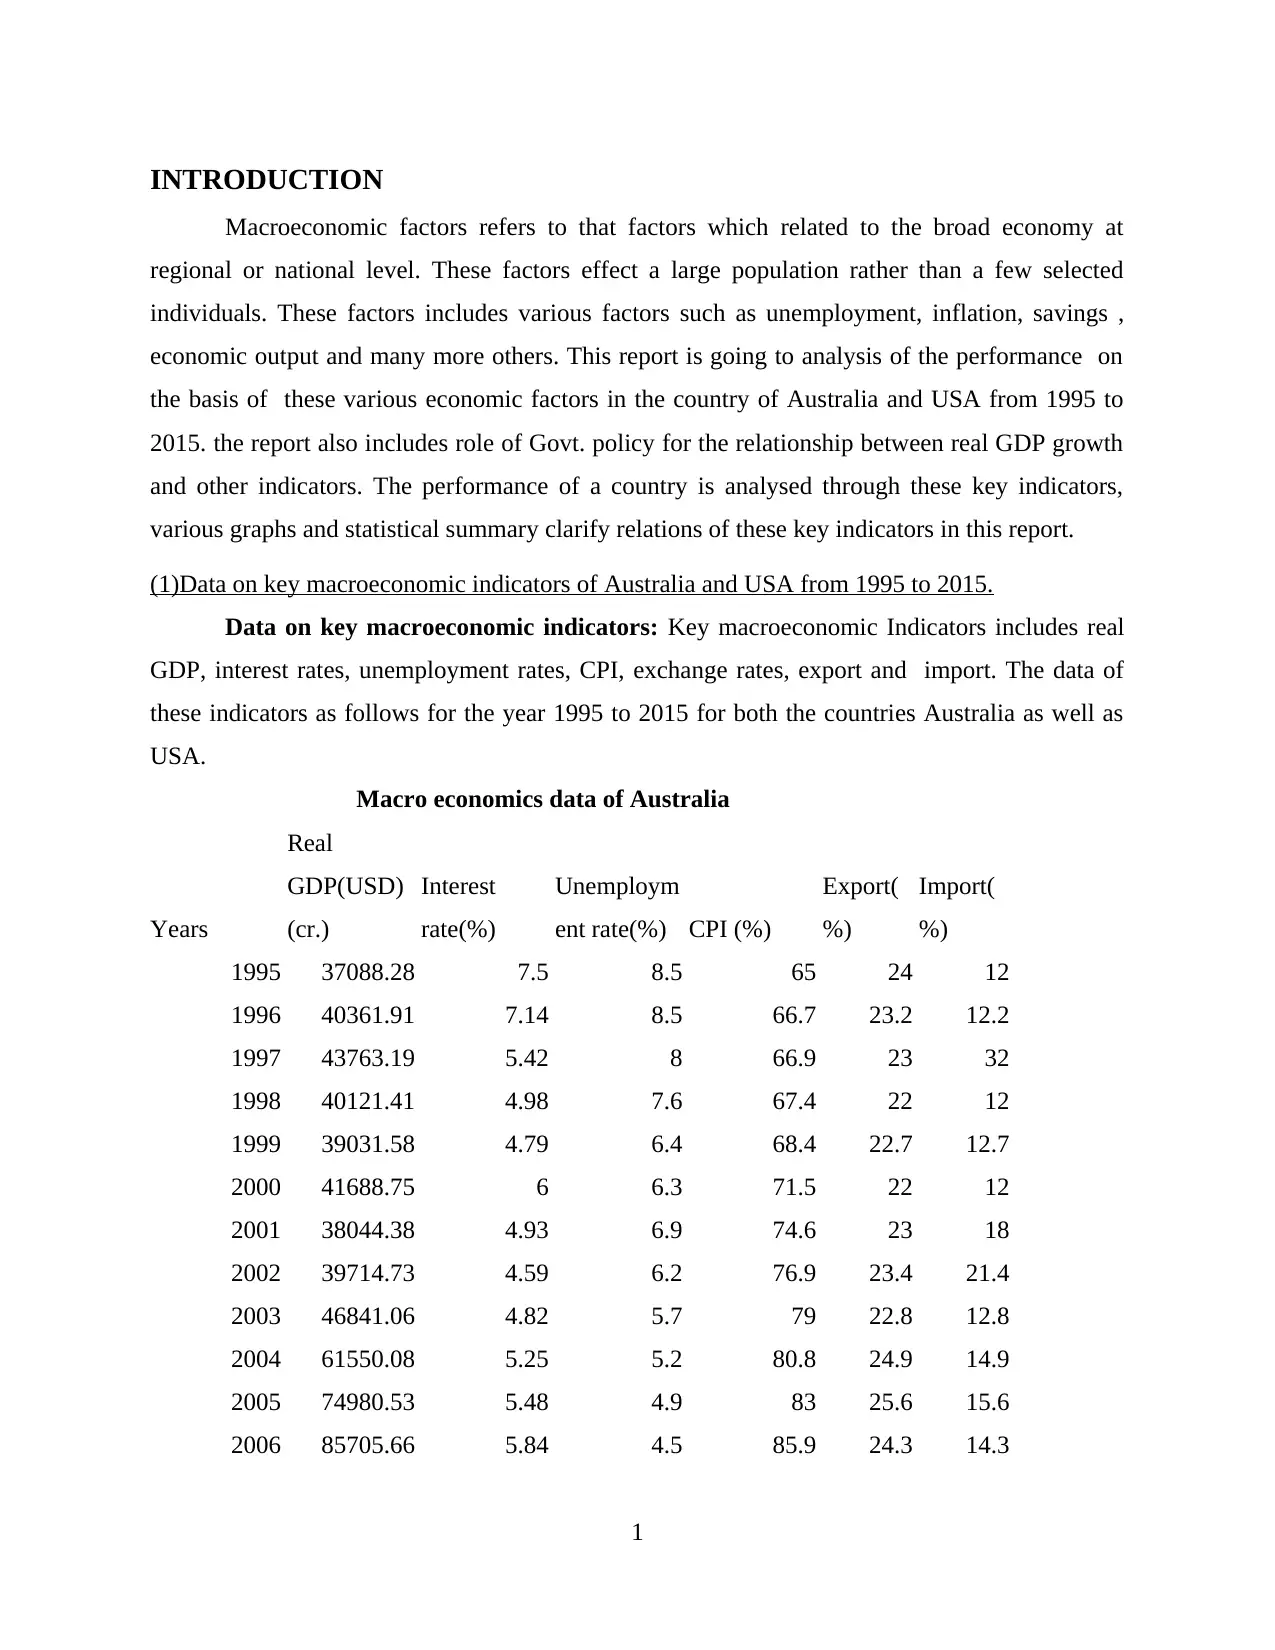
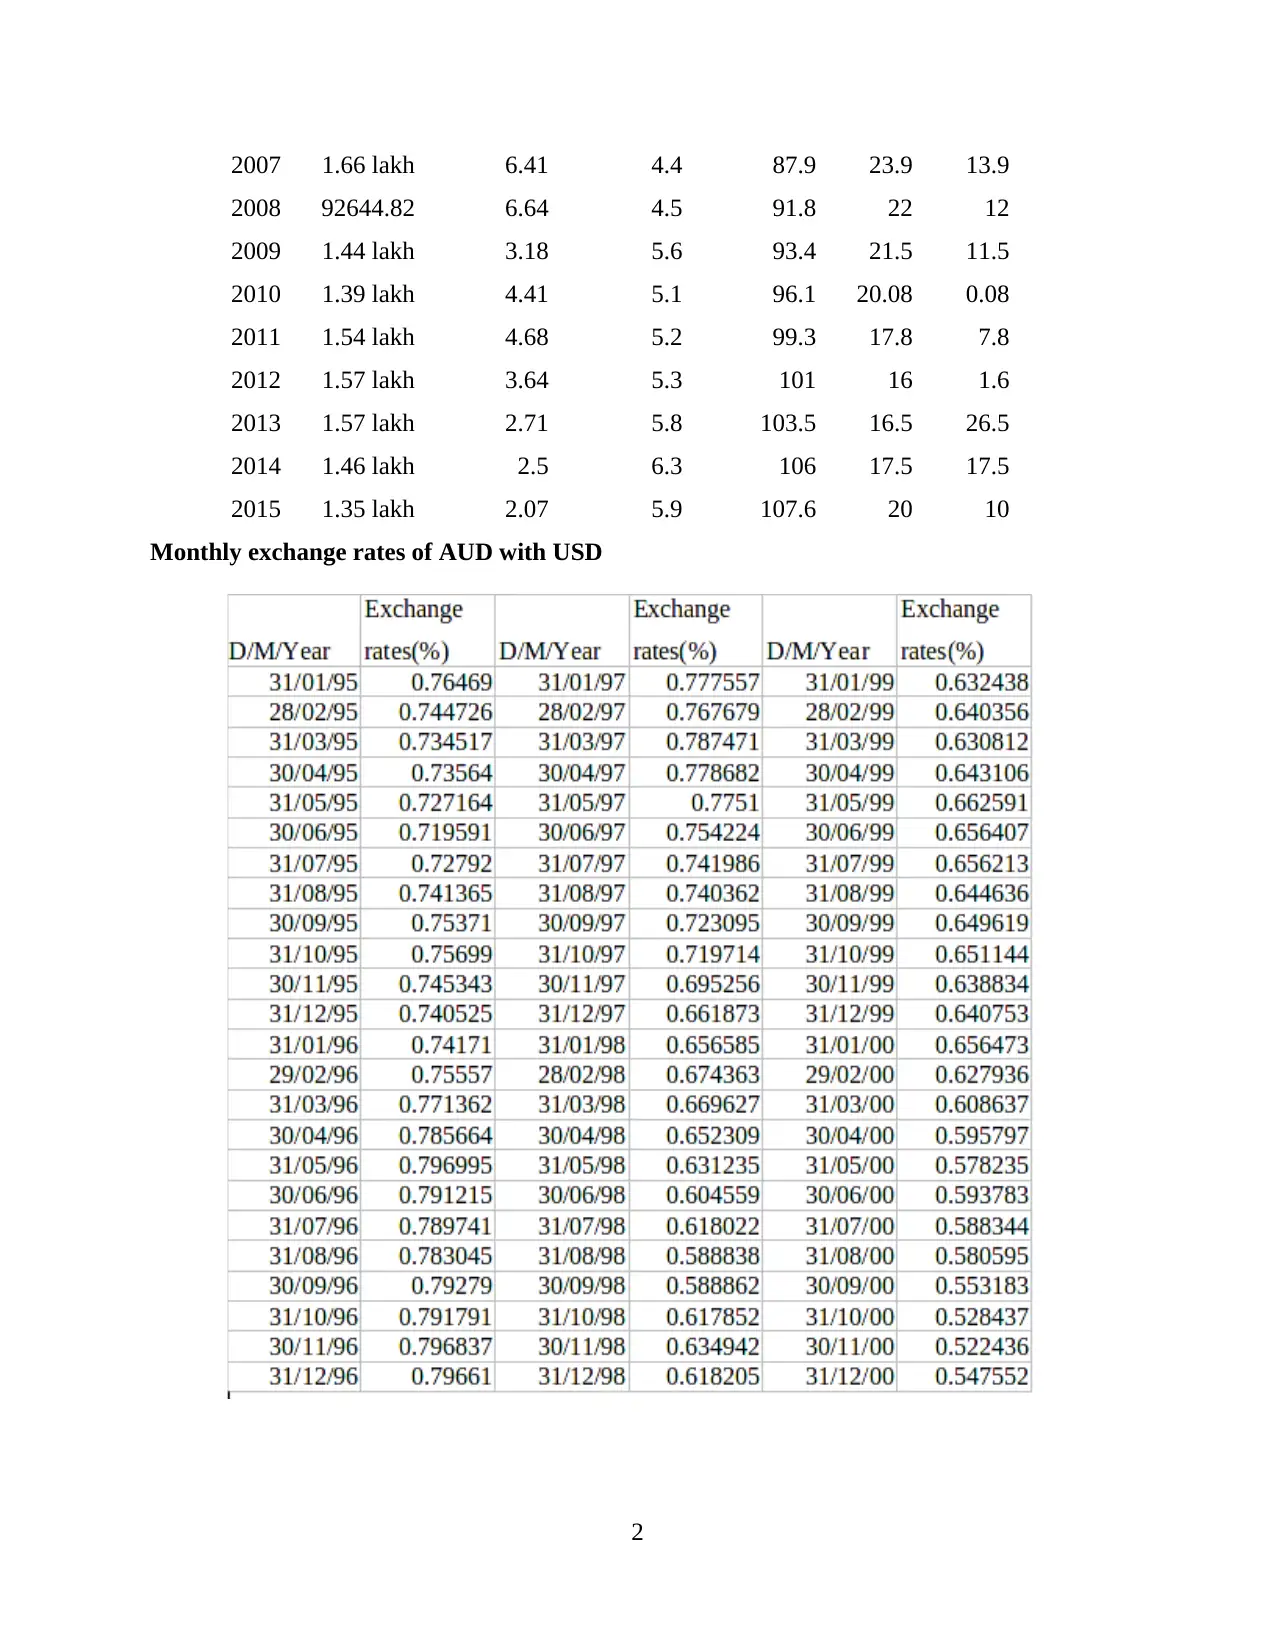
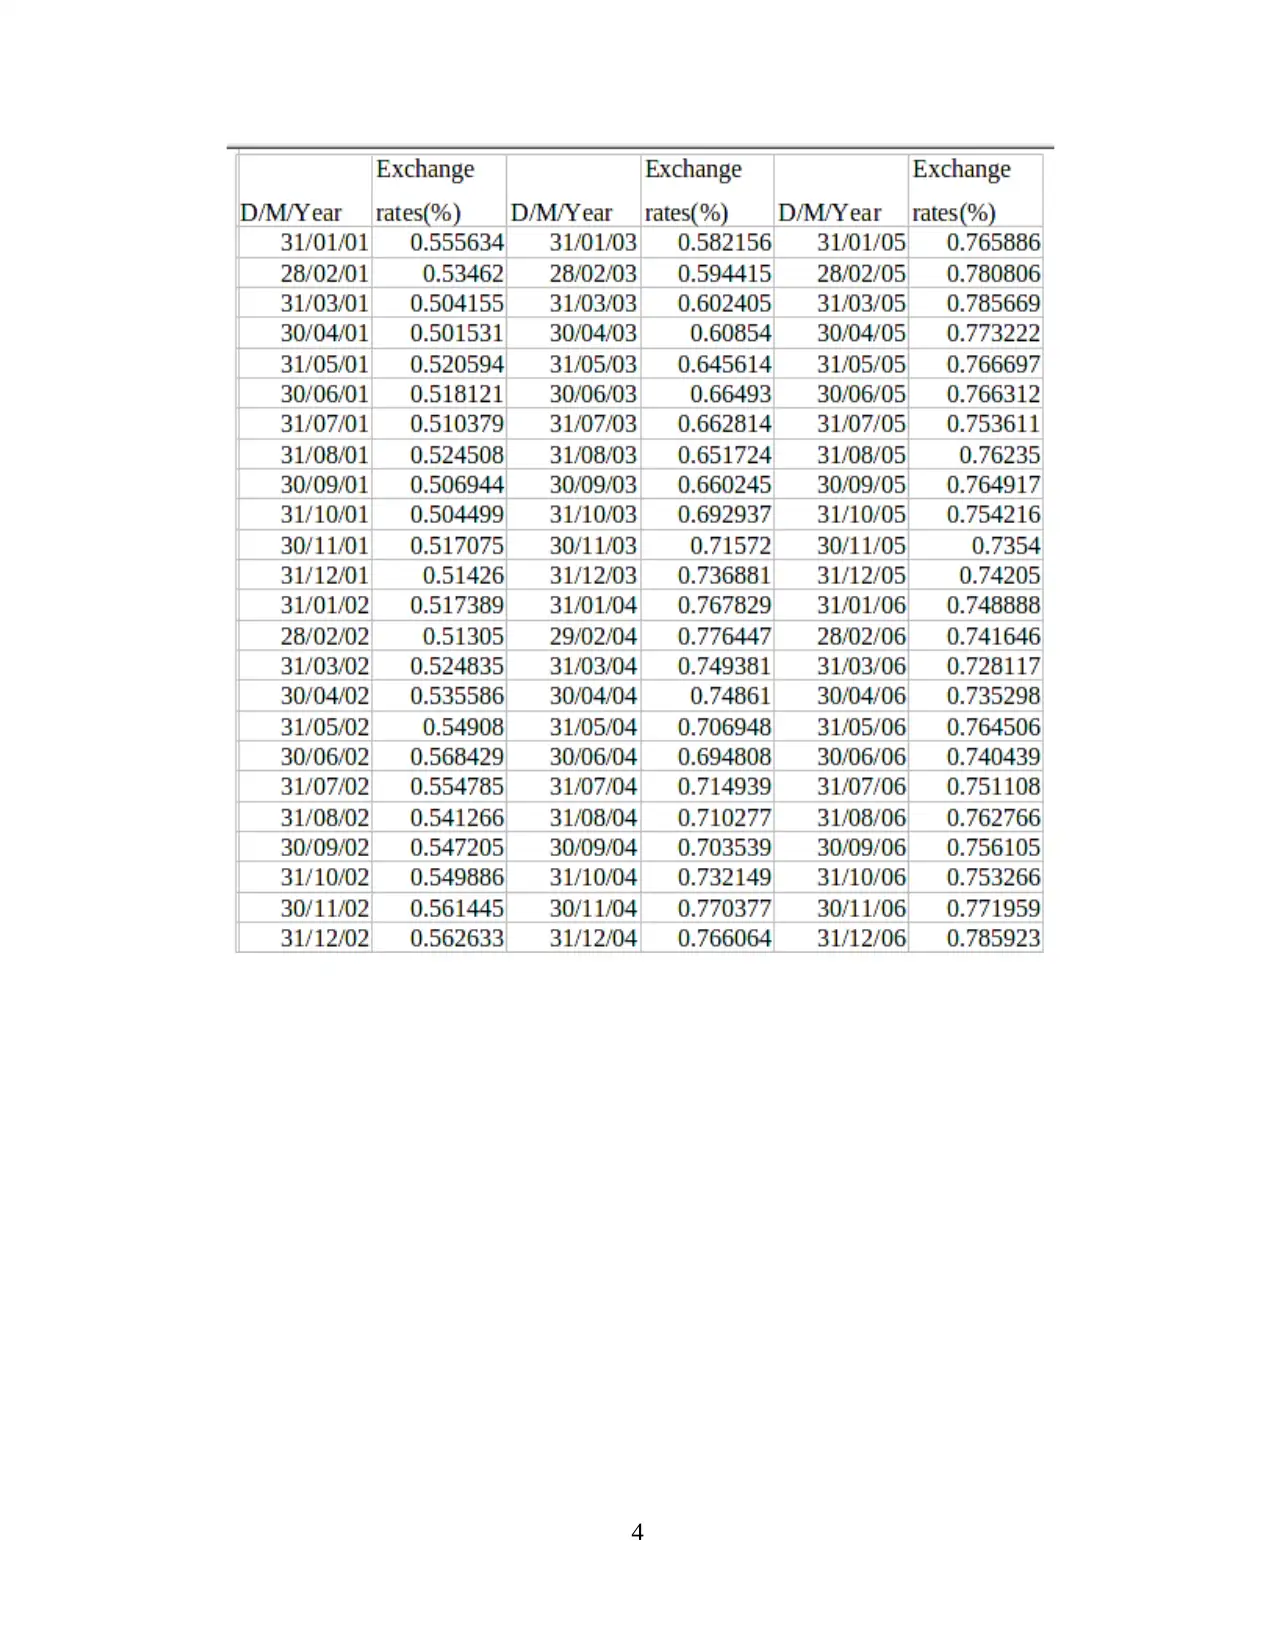
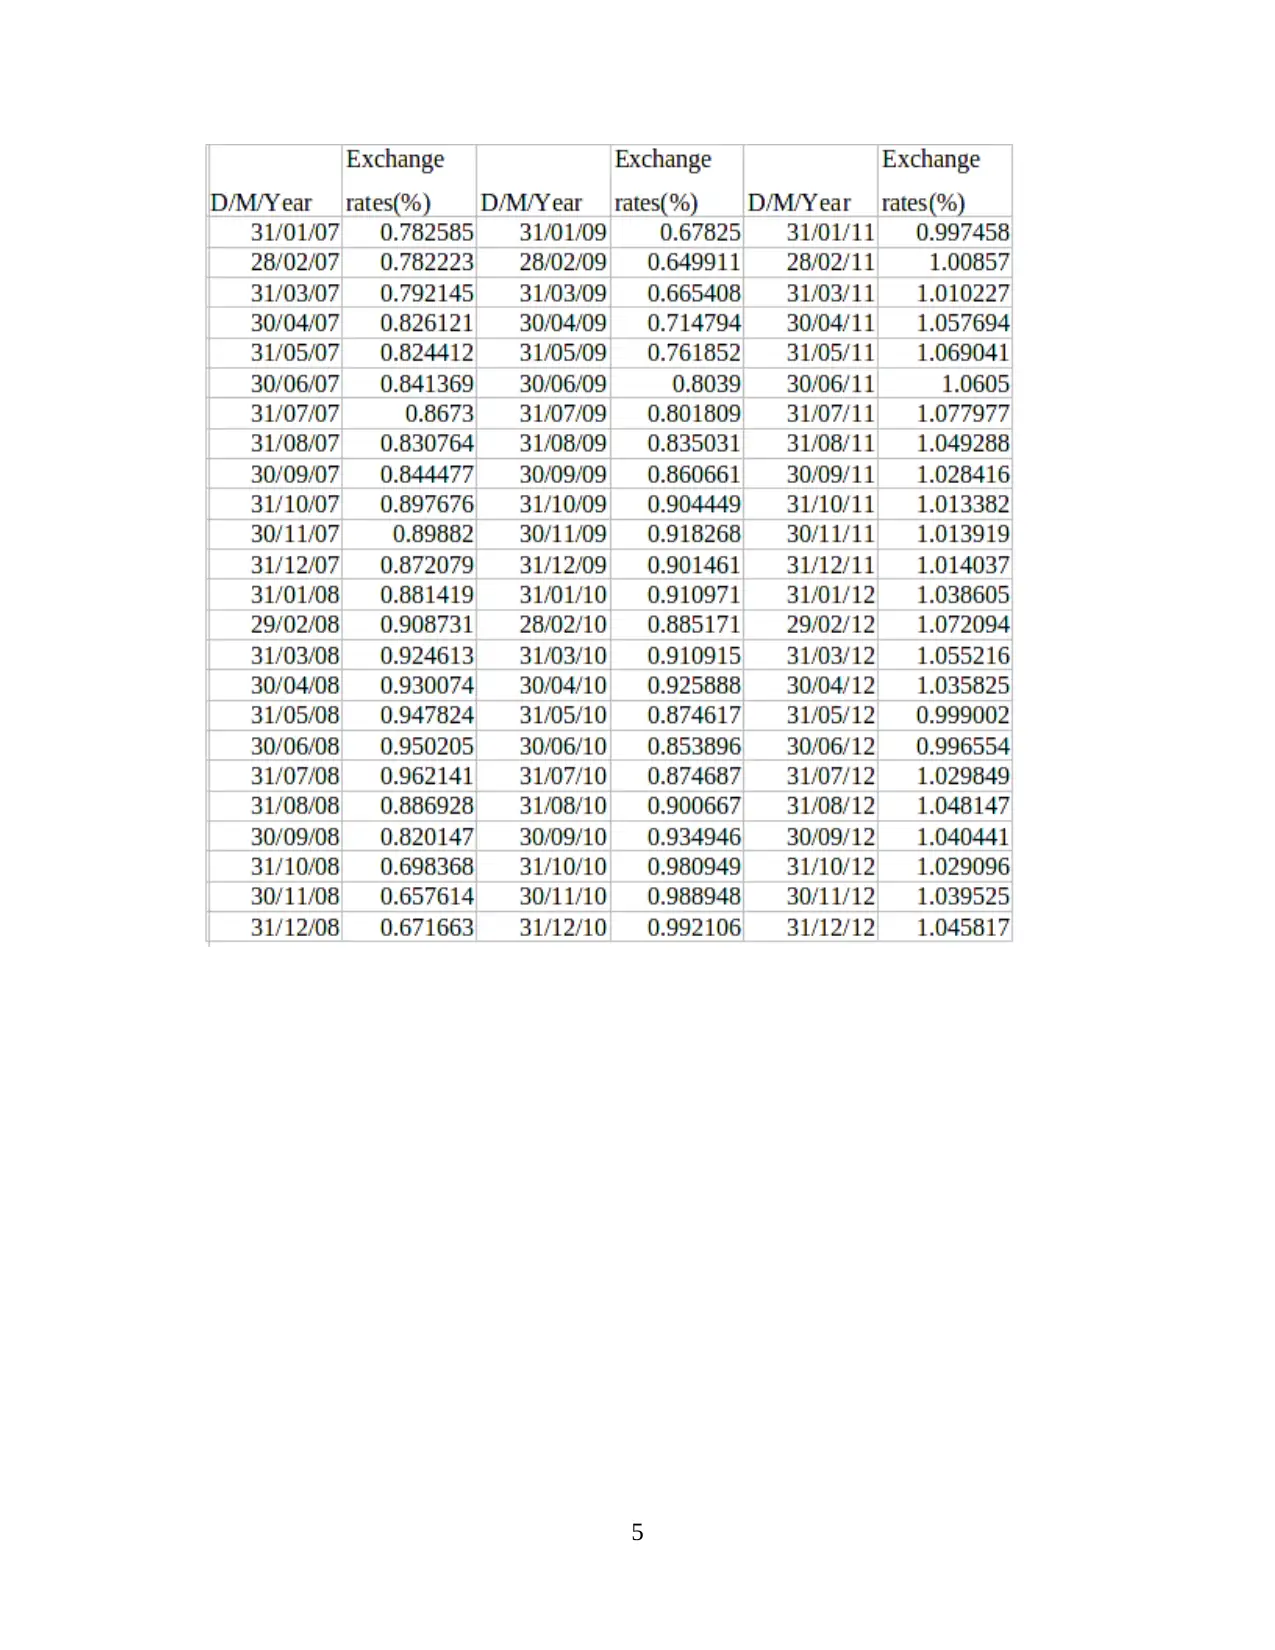
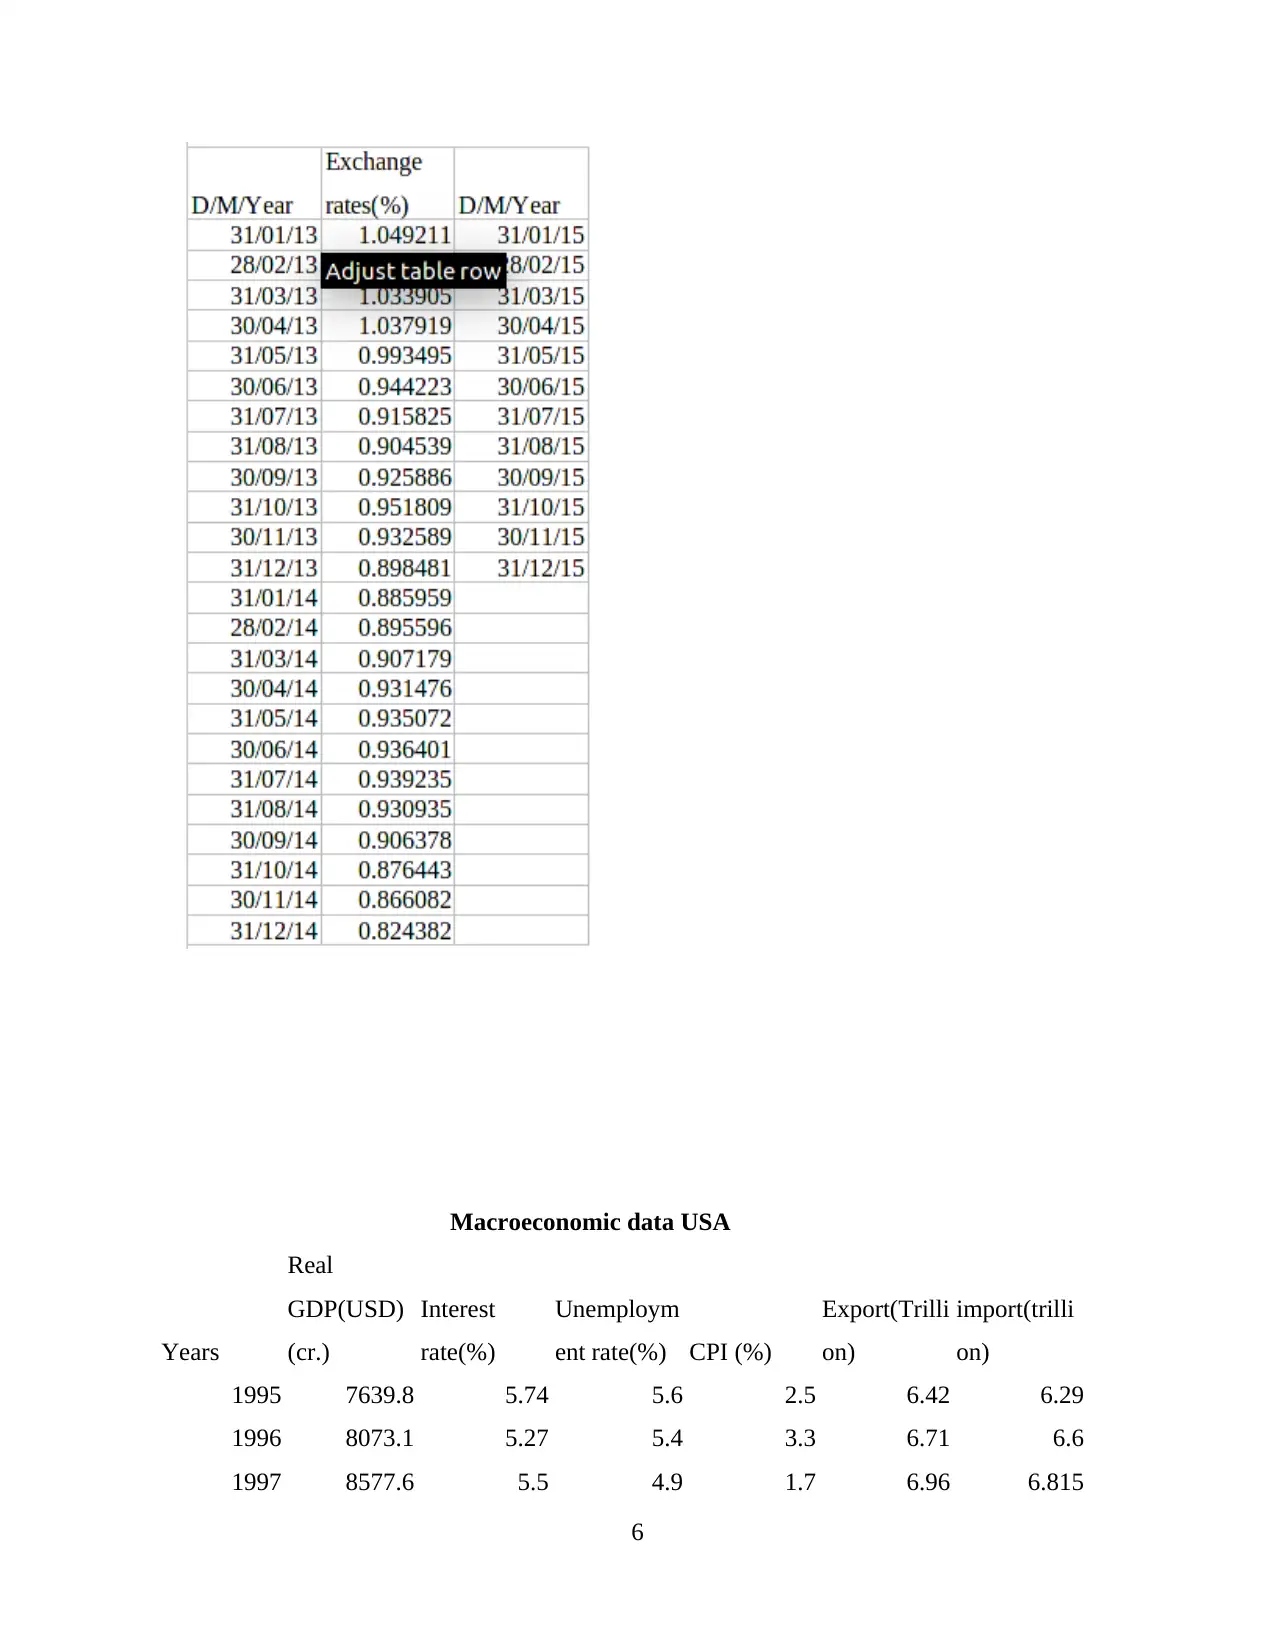
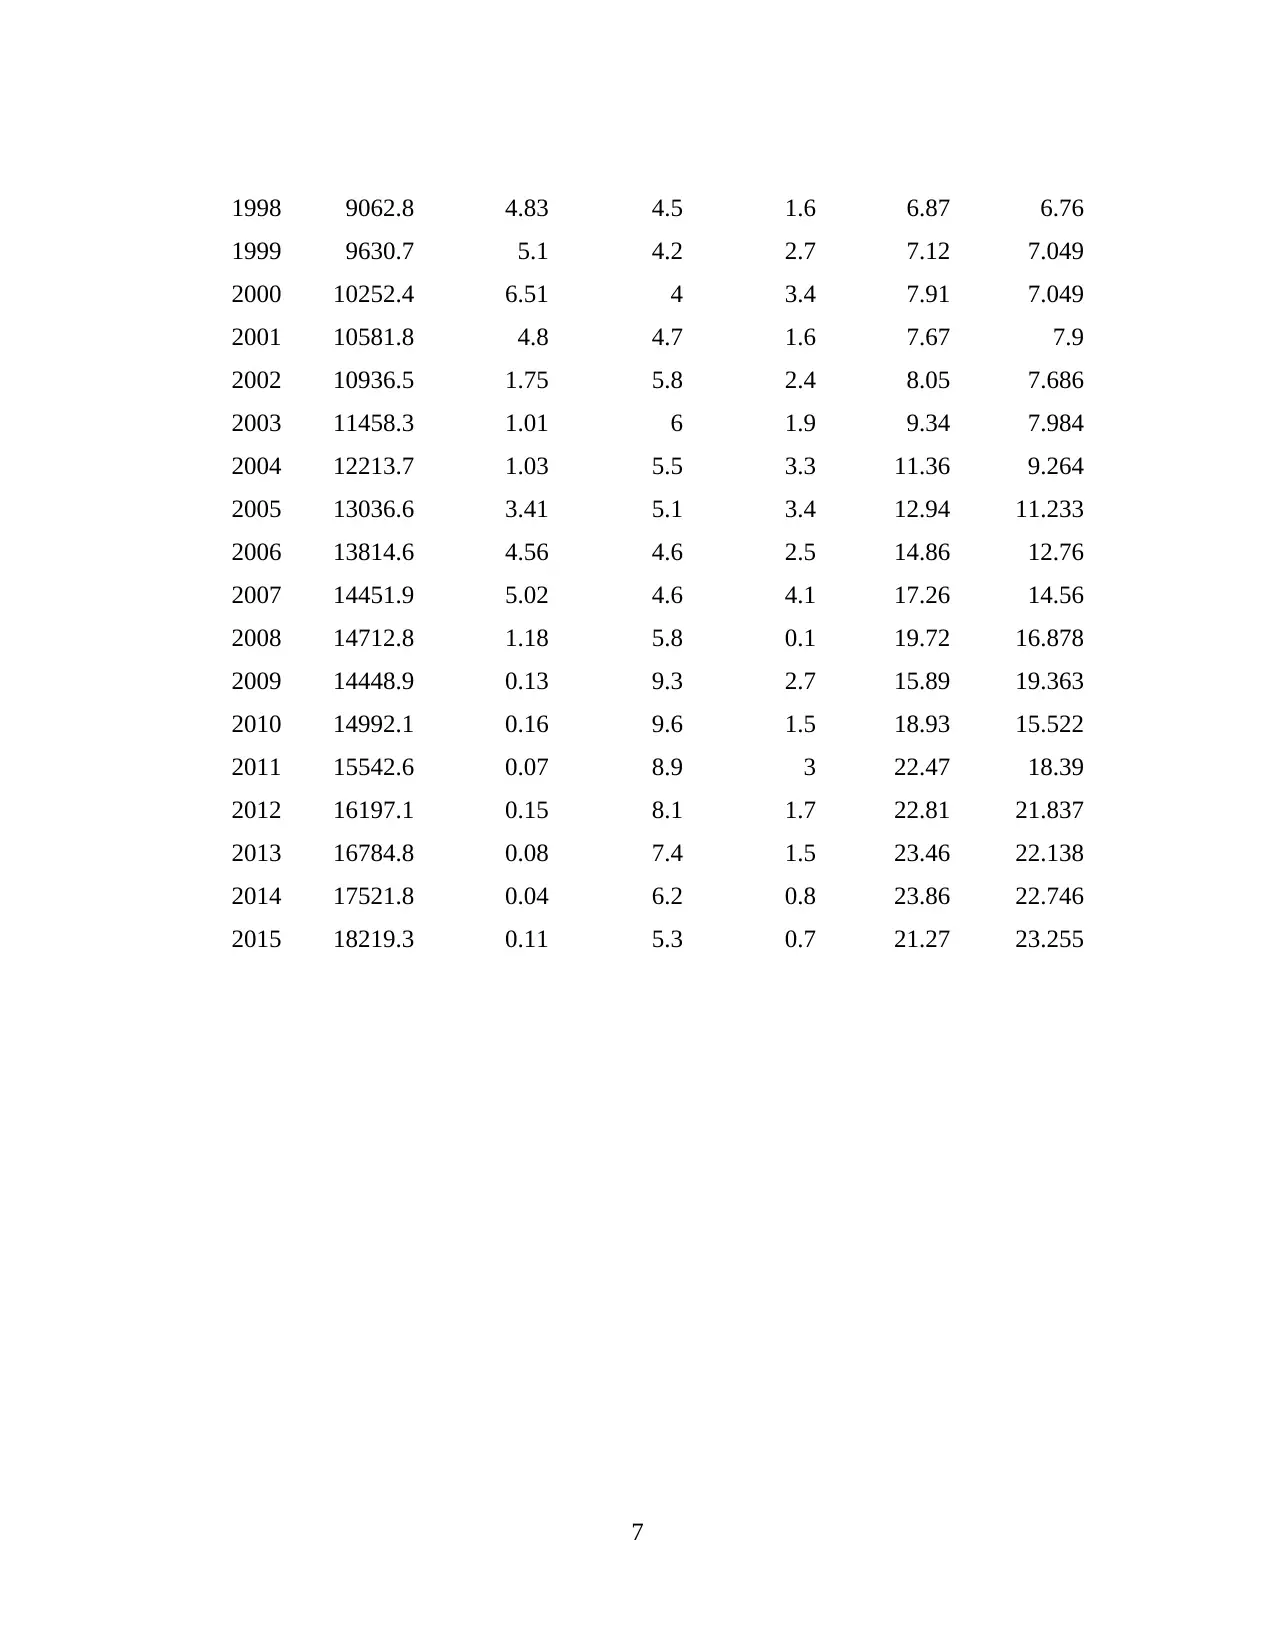
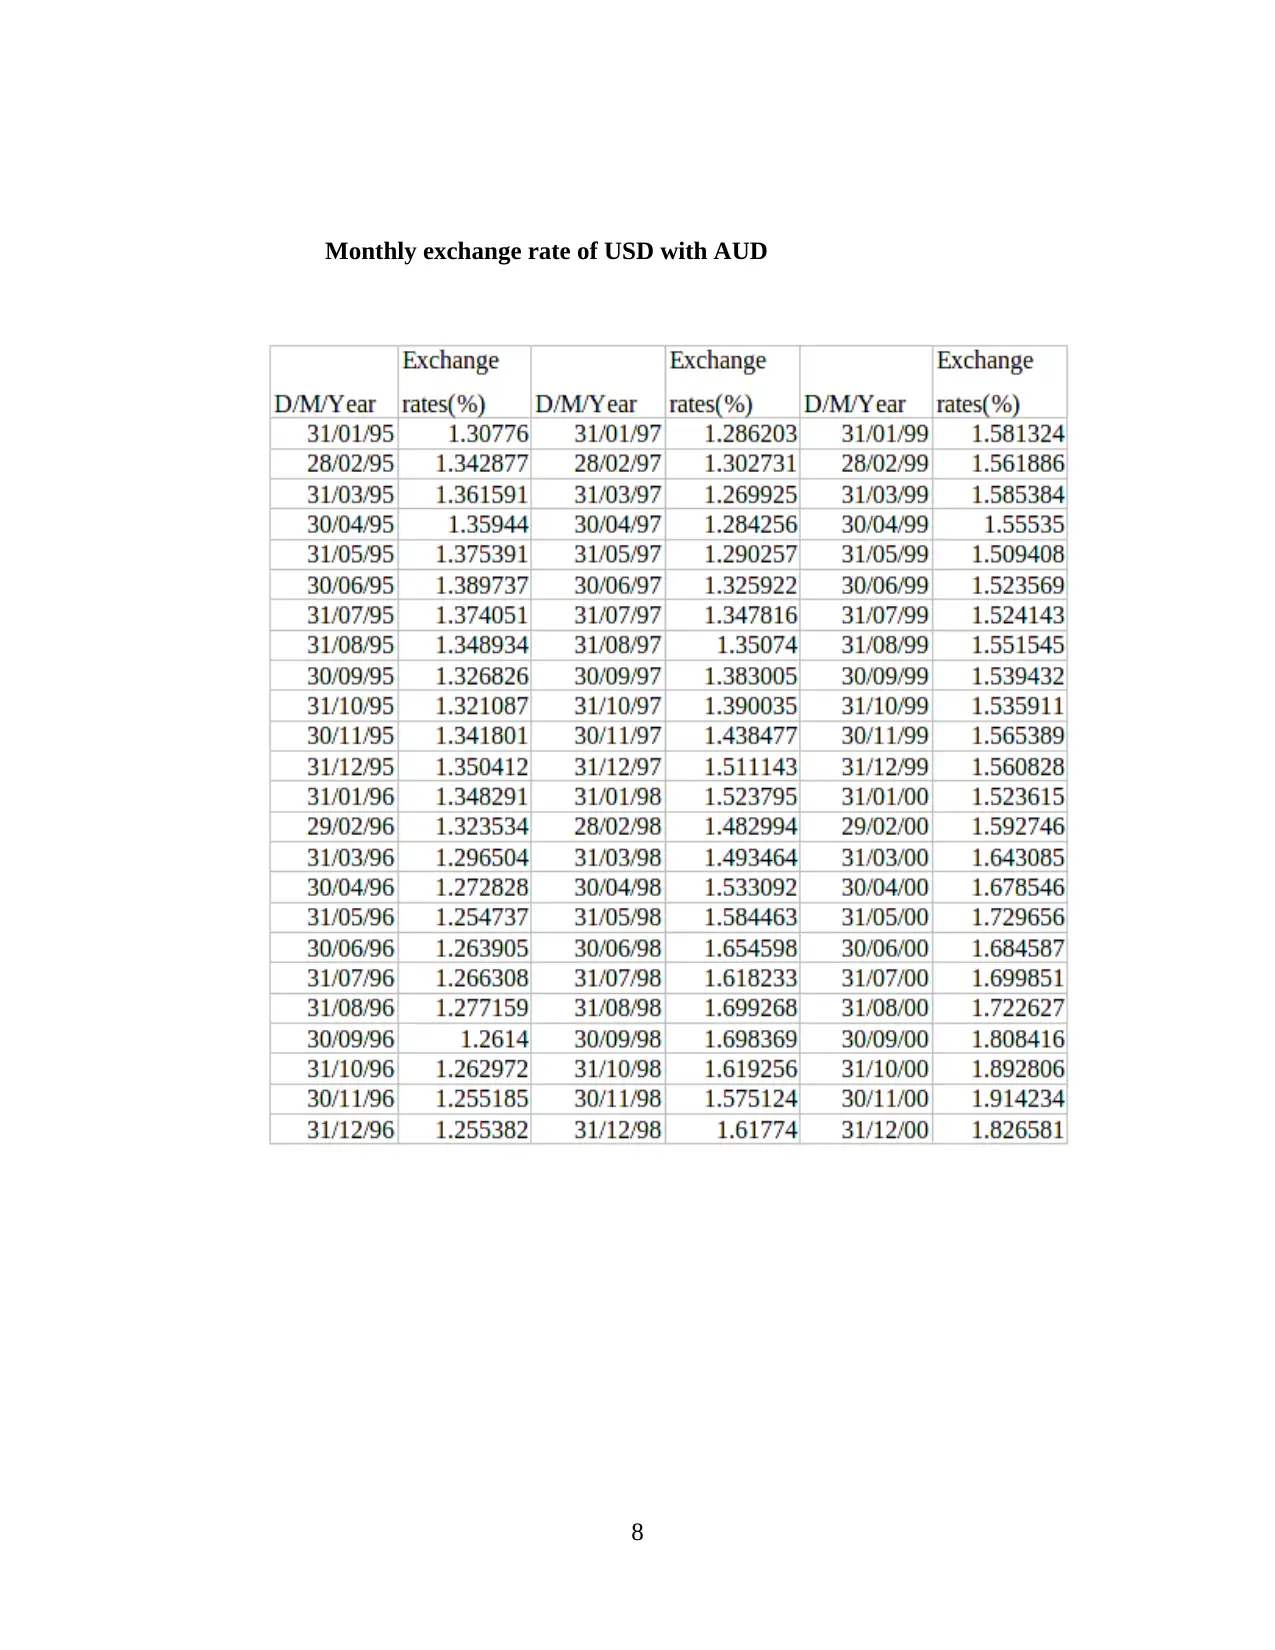
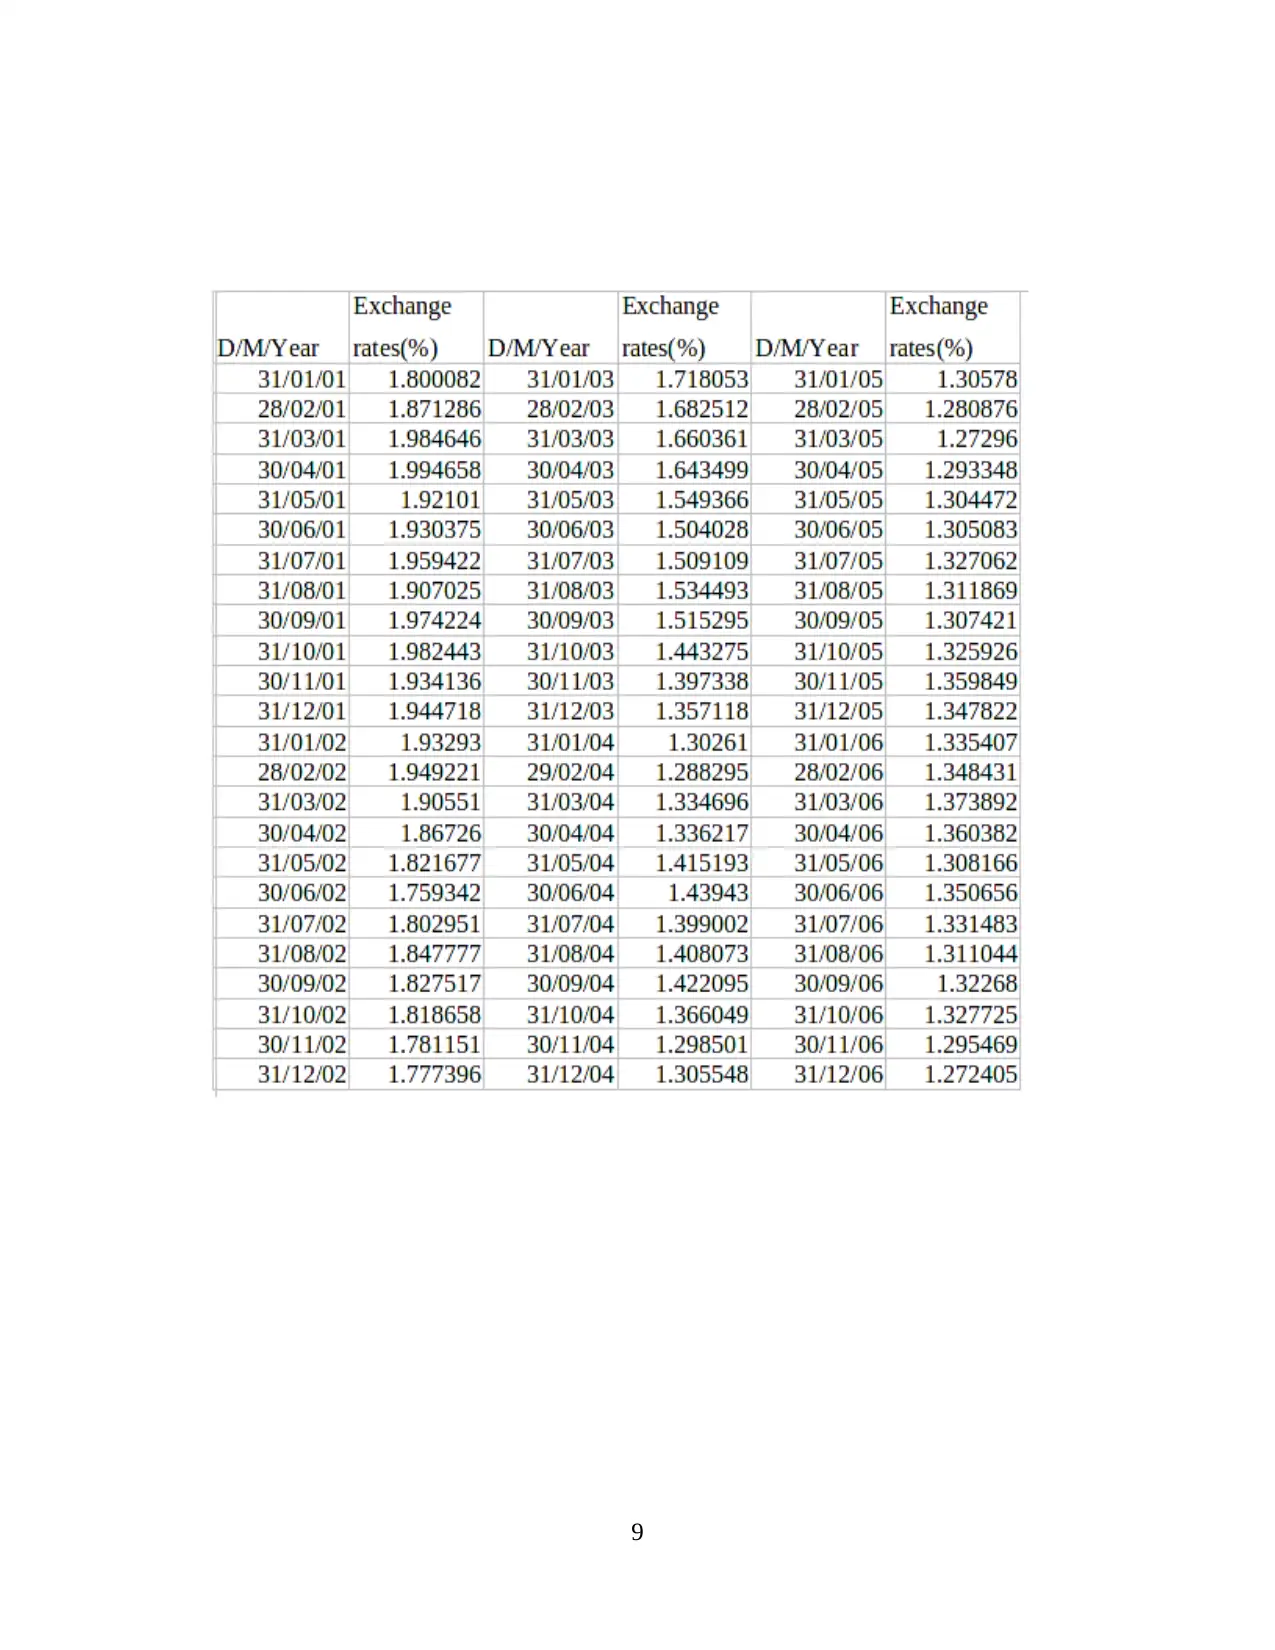
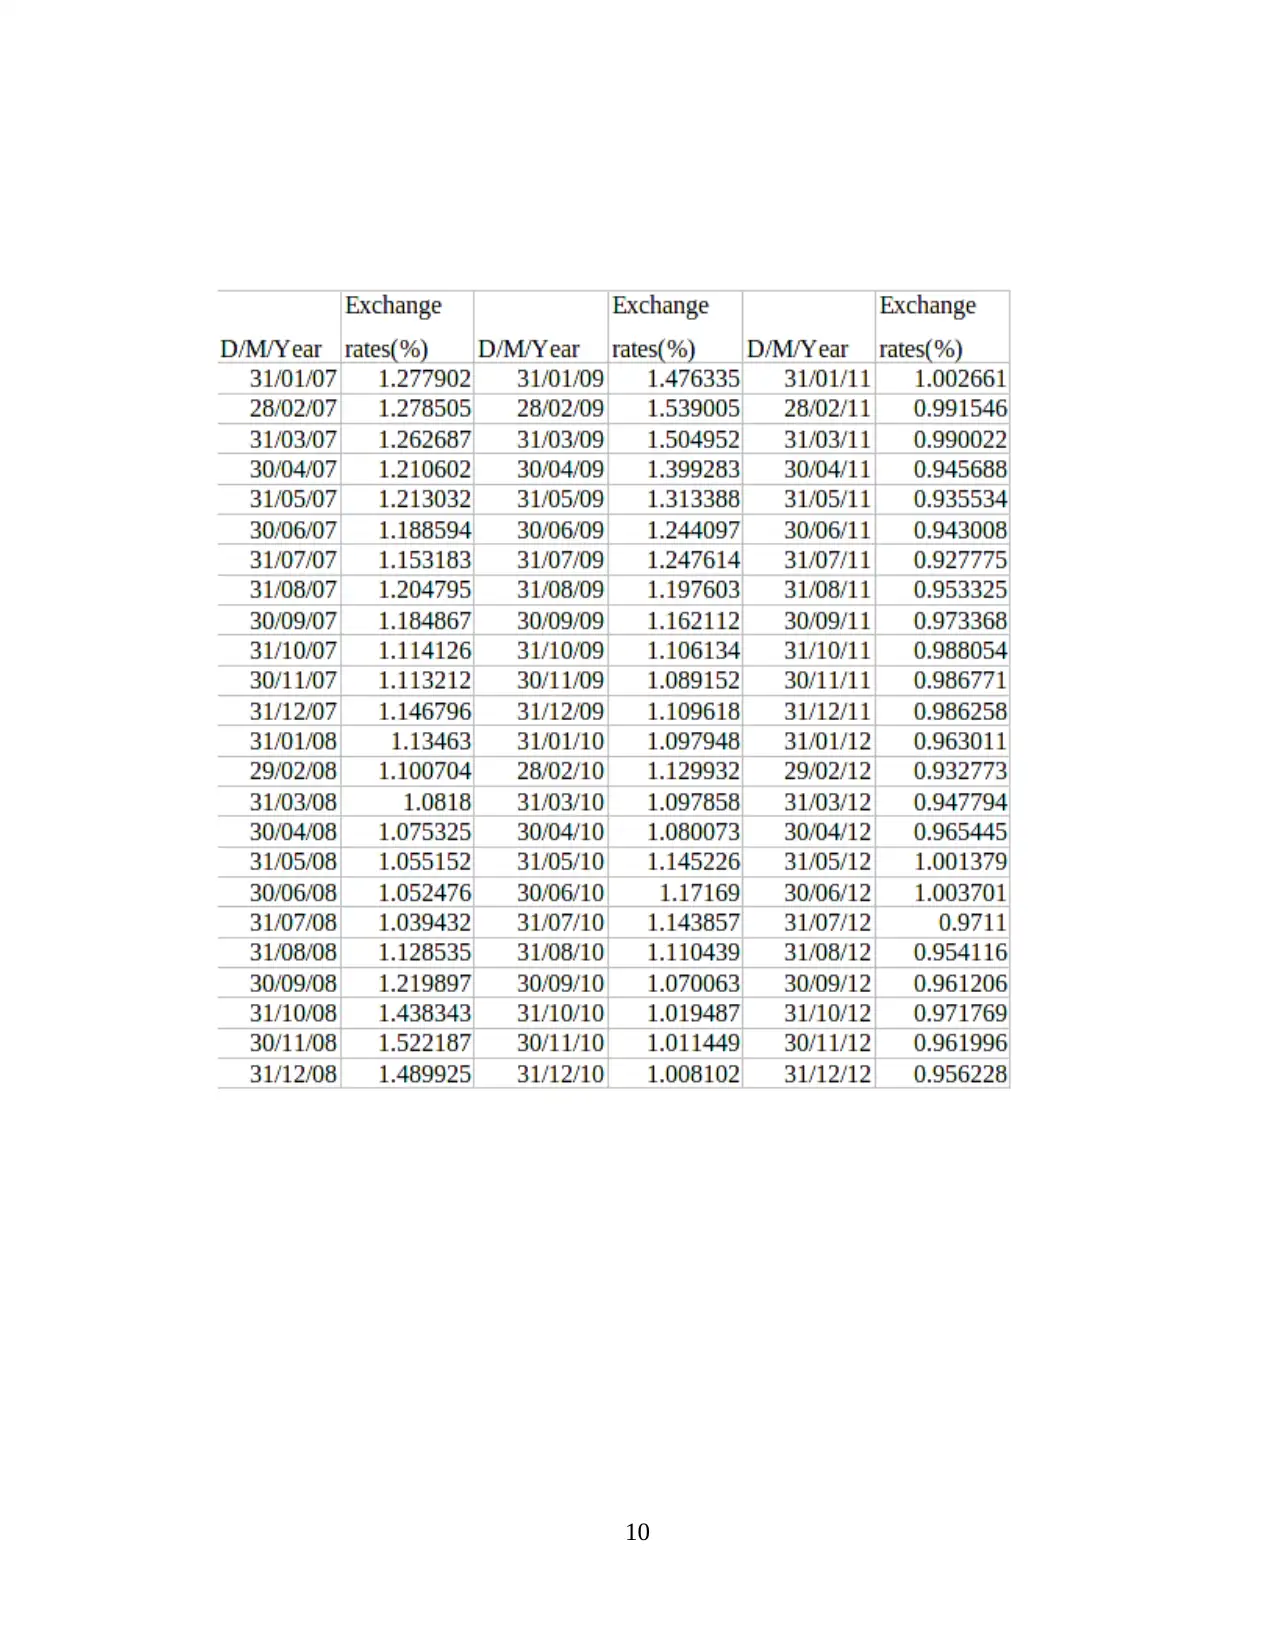
This report presents a comparative analysis of macroeconomic factors in Australia and the USA from 1995 to 2015. It begins with an introduction to macroeconomic indicators, including real GDP, interest rates, unemployment rates, CPI, exchange rates, and export/import data. The report then provides detailed data tables for both countries, spanning the specified time period. A summary of changes in macroeconomic factors for both Australia and the USA is included, highlighting trends in GDP growth, inflation, exchange rates, interest rates, unemployment, and net exports. The analysis extends to pairwise graphs illustrating relationships between key indicators like GDP growth, inflation, unemployment, and exchange rates. Finally, the report touches upon plausible economic explanations and government policies influencing these trends, although the provided text is incomplete in this section. The report aims to provide a comprehensive overview of the economic performance of Australia and the USA during the period, utilizing statistical data and graphical representations to clarify the relationships between key economic indicators. The report also includes the role of Govt. policy for the relationship between real GDP growth and other indicators.
Document Page
Business Economics
tabler-icon-diamond-filled.svg

Paraphrase This Document

Need a fresh take? Get an instant paraphrase of this document with our AI Paraphraser
Document Page
Table of Contents
INTRODUCTION...........................................................................................................................1
(1)Data on key macroeconomic indicators of Australia and USA from 1995 to 2015................1
(2)Summary of change in Australia's and USA macroeconomic factors.................................11
3.pair wise graphs of Australia and USA from 1995 to 2015....................................................14
P4.paulisable economic explanation including Govt. policies..................................................19
P4(b): short prediction macroeconomic outlook of Australia......................................................2
CONCLUSION................................................................................................................................4
Document Page
INTRODUCTION
Macroeconomic factors refers to that factors which related to the broad economy at
regional or national level. These factors effect a large population rather than a few selected
individuals. These factors includes various factors such as unemployment, inflation, savings ,
economic output and many more others. This report is going to analysis of the performance on
the basis of these various economic factors in the country of Australia and USA from 1995 to
2015. the report also includes role of Govt. policy for the relationship between real GDP growth
and other indicators. The performance of a country is analysed through these key indicators,
various graphs and statistical summary clarify relations of these key indicators in this report.
(1)Data on key macroeconomic indicators of Australia and USA from 1995 to 2015.
Data on key macroeconomic indicators: Key macroeconomic Indicators includes real
GDP, interest rates, unemployment rates, CPI, exchange rates, export and import. The data of
these indicators as follows for the year 1995 to 2015 for both the countries Australia as well as
USA.
Macro economics data of Australia
Years
Real
GDP(USD)
(cr.)
Interest
rate(%)
Unemploym
ent rate(%) CPI (%)
Export(
%)
Import(
%)
1995 37088.28 7.5 8.5 65 24 12
1996 40361.91 7.14 8.5 66.7 23.2 12.2
1997 43763.19 5.42 8 66.9 23 32
1998 40121.41 4.98 7.6 67.4 22 12
1999 39031.58 4.79 6.4 68.4 22.7 12.7
2000 41688.75 6 6.3 71.5 22 12
2001 38044.38 4.93 6.9 74.6 23 18
2002 39714.73 4.59 6.2 76.9 23.4 21.4
2003 46841.06 4.82 5.7 79 22.8 12.8
2004 61550.08 5.25 5.2 80.8 24.9 14.9
2005 74980.53 5.48 4.9 83 25.6 15.6
2006 85705.66 5.84 4.5 85.9 24.3 14.3
1
Document Page
2007 1.66 lakh 6.41 4.4 87.9 23.9 13.9
2008 92644.82 6.64 4.5 91.8 22 12
2009 1.44 lakh 3.18 5.6 93.4 21.5 11.5
2010 1.39 lakh 4.41 5.1 96.1 20.08 0.08
2011 1.54 lakh 4.68 5.2 99.3 17.8 7.8
2012 1.57 lakh 3.64 5.3 101 16 1.6
2013 1.57 lakh 2.71 5.8 103.5 16.5 26.5
2014 1.46 lakh 2.5 6.3 106 17.5 17.5
2015 1.35 lakh 2.07 5.9 107.6 20 10
Monthly exchange rates of AUD with USD
2
tabler-icon-diamond-filled.svg

Paraphrase This Document

Need a fresh take? Get an instant paraphrase of this document with our AI Paraphraser
Document Page
3
Document Page
4
Document Page
5
tabler-icon-diamond-filled.svg

Paraphrase This Document

Need a fresh take? Get an instant paraphrase of this document with our AI Paraphraser
Document Page
Macroeconomic data USA
Years
Real
GDP(USD)
(cr.)
Interest
rate(%)
Unemploym
ent rate(%) CPI (%)
Export(Trilli
on)
import(trilli
on)
1995 7639.8 5.74 5.6 2.5 6.42 6.29
1996 8073.1 5.27 5.4 3.3 6.71 6.6
1997 8577.6 5.5 4.9 1.7 6.96 6.815
6
Document Page
1998 9062.8 4.83 4.5 1.6 6.87 6.76
1999 9630.7 5.1 4.2 2.7 7.12 7.049
2000 10252.4 6.51 4 3.4 7.91 7.049
2001 10581.8 4.8 4.7 1.6 7.67 7.9
2002 10936.5 1.75 5.8 2.4 8.05 7.686
2003 11458.3 1.01 6 1.9 9.34 7.984
2004 12213.7 1.03 5.5 3.3 11.36 9.264
2005 13036.6 3.41 5.1 3.4 12.94 11.233
2006 13814.6 4.56 4.6 2.5 14.86 12.76
2007 14451.9 5.02 4.6 4.1 17.26 14.56
2008 14712.8 1.18 5.8 0.1 19.72 16.878
2009 14448.9 0.13 9.3 2.7 15.89 19.363
2010 14992.1 0.16 9.6 1.5 18.93 15.522
2011 15542.6 0.07 8.9 3 22.47 18.39
2012 16197.1 0.15 8.1 1.7 22.81 21.837
2013 16784.8 0.08 7.4 1.5 23.46 22.138
2014 17521.8 0.04 6.2 0.8 23.86 22.746
2015 18219.3 0.11 5.3 0.7 21.27 23.255
7
Document Page
Monthly exchange rate of USD with AUD
8
tabler-icon-diamond-filled.svg

Paraphrase This Document

Need a fresh take? Get an instant paraphrase of this document with our AI Paraphraser
Document Page
9
Document Page
10
chevron_up_icon
1 out of 28
circle_padding
hide_on_mobile
zoom_out_icon
[object Object]