Economic Indicator Analysis: A Detailed Report on Australia and USA

Verified

Added on  2023/04/22

|26
|3684
|120
Report
AI Summary
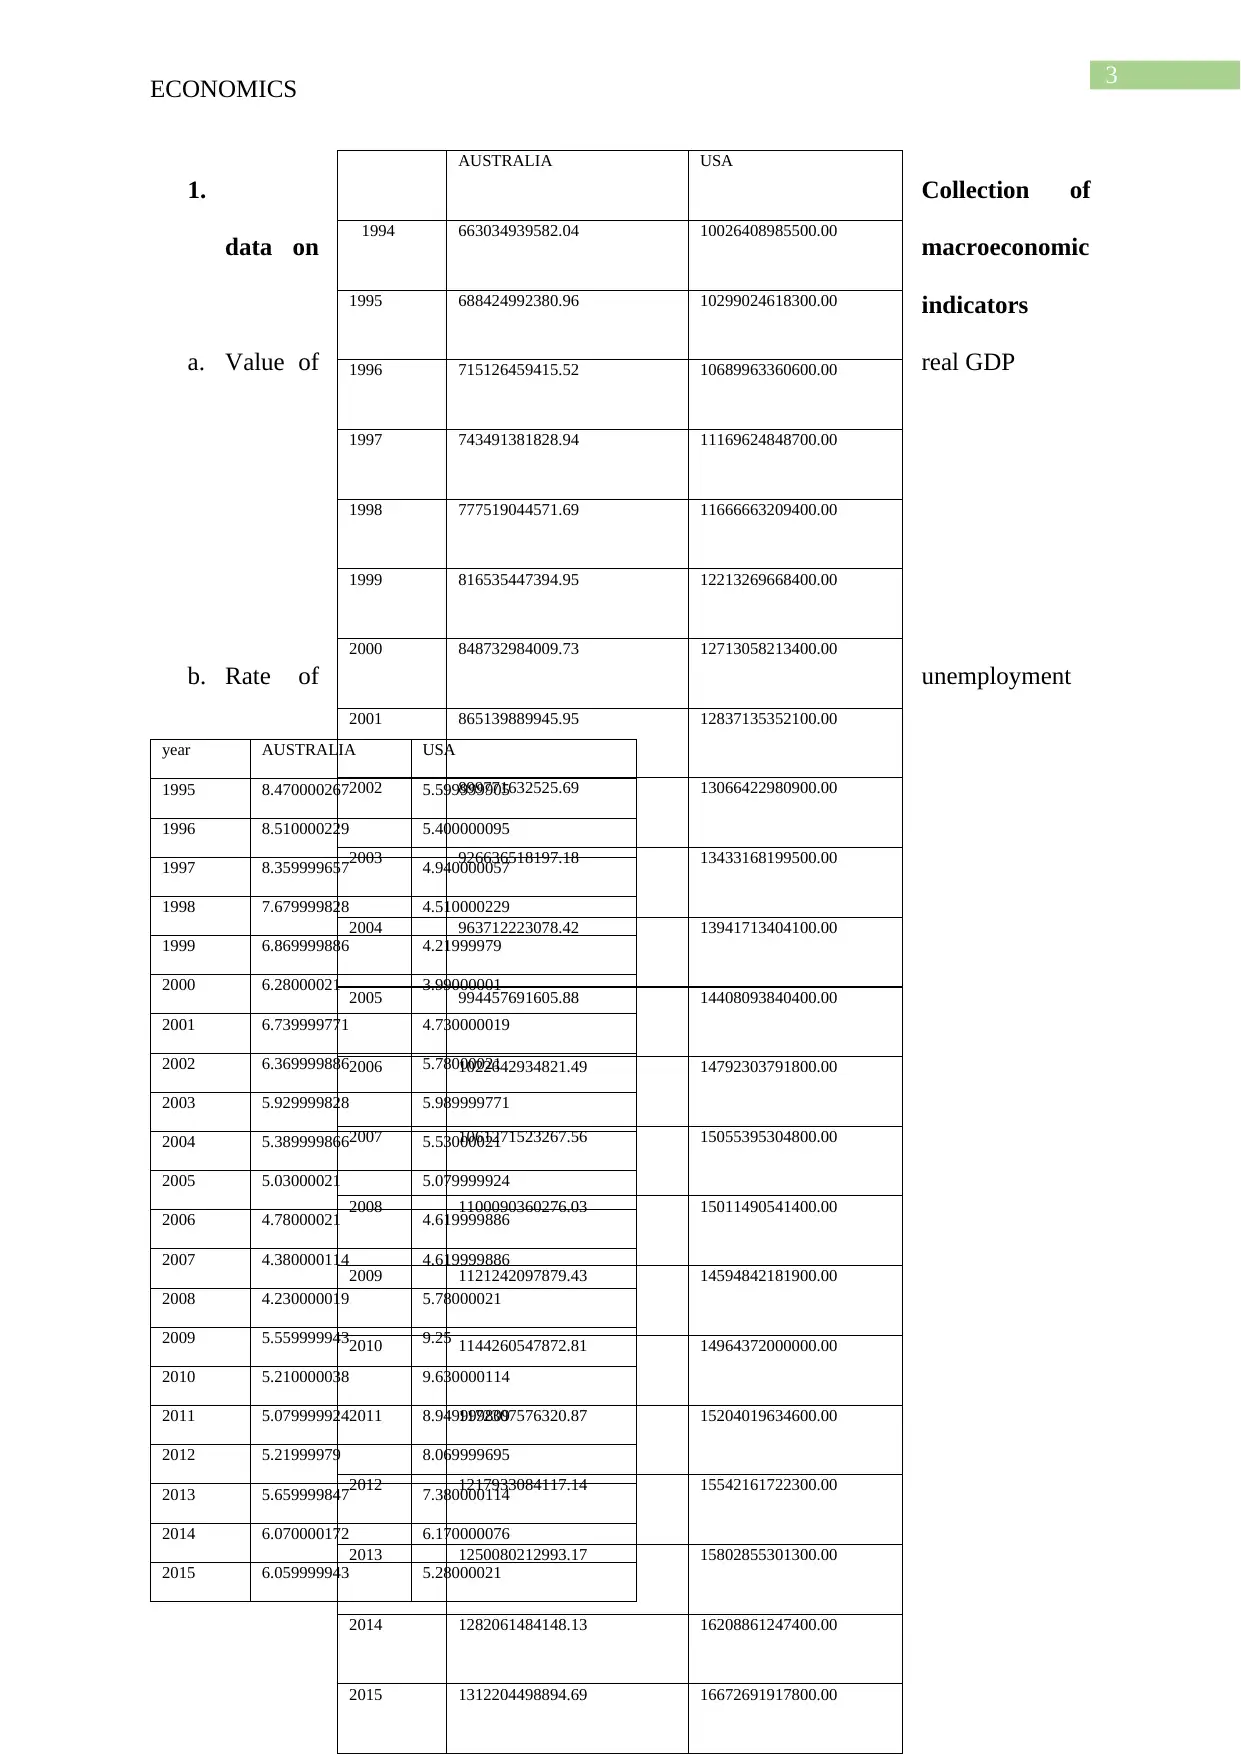
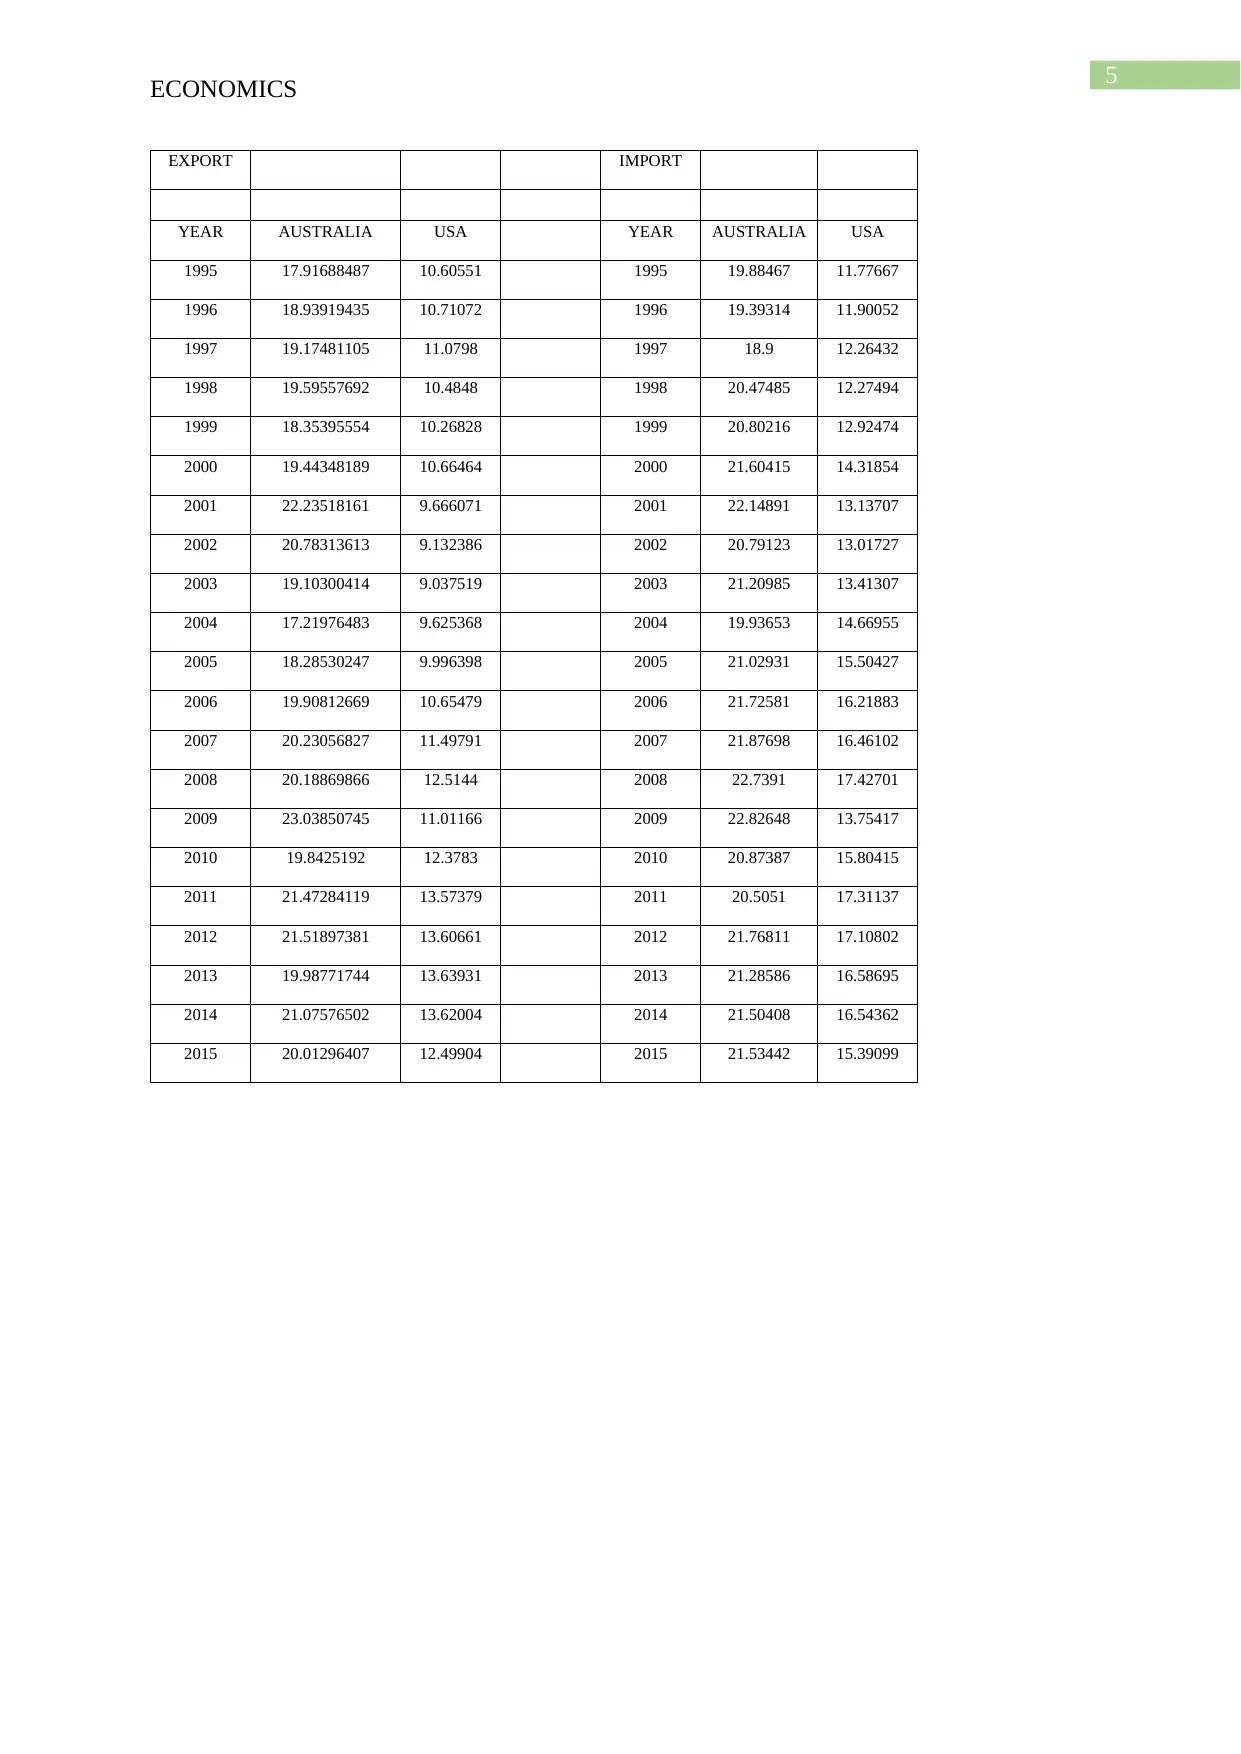
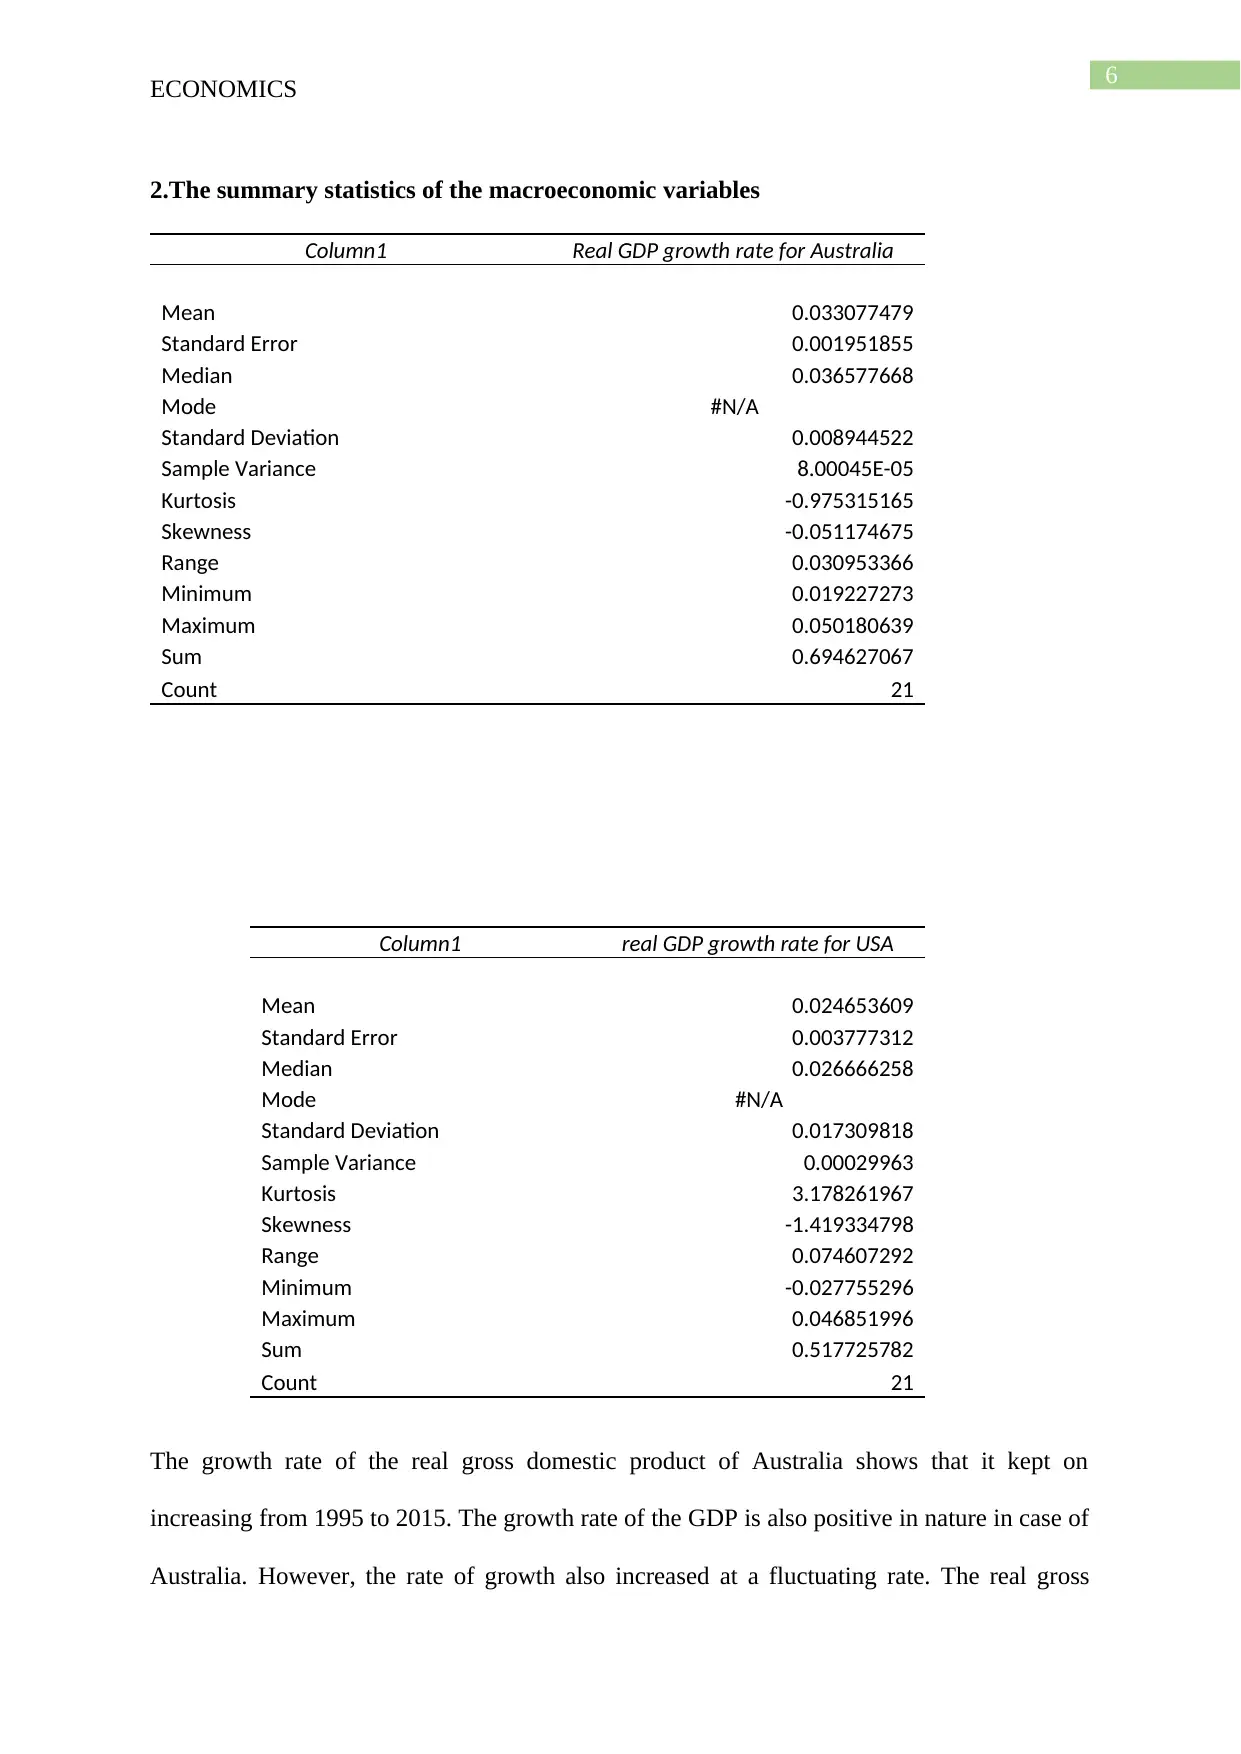
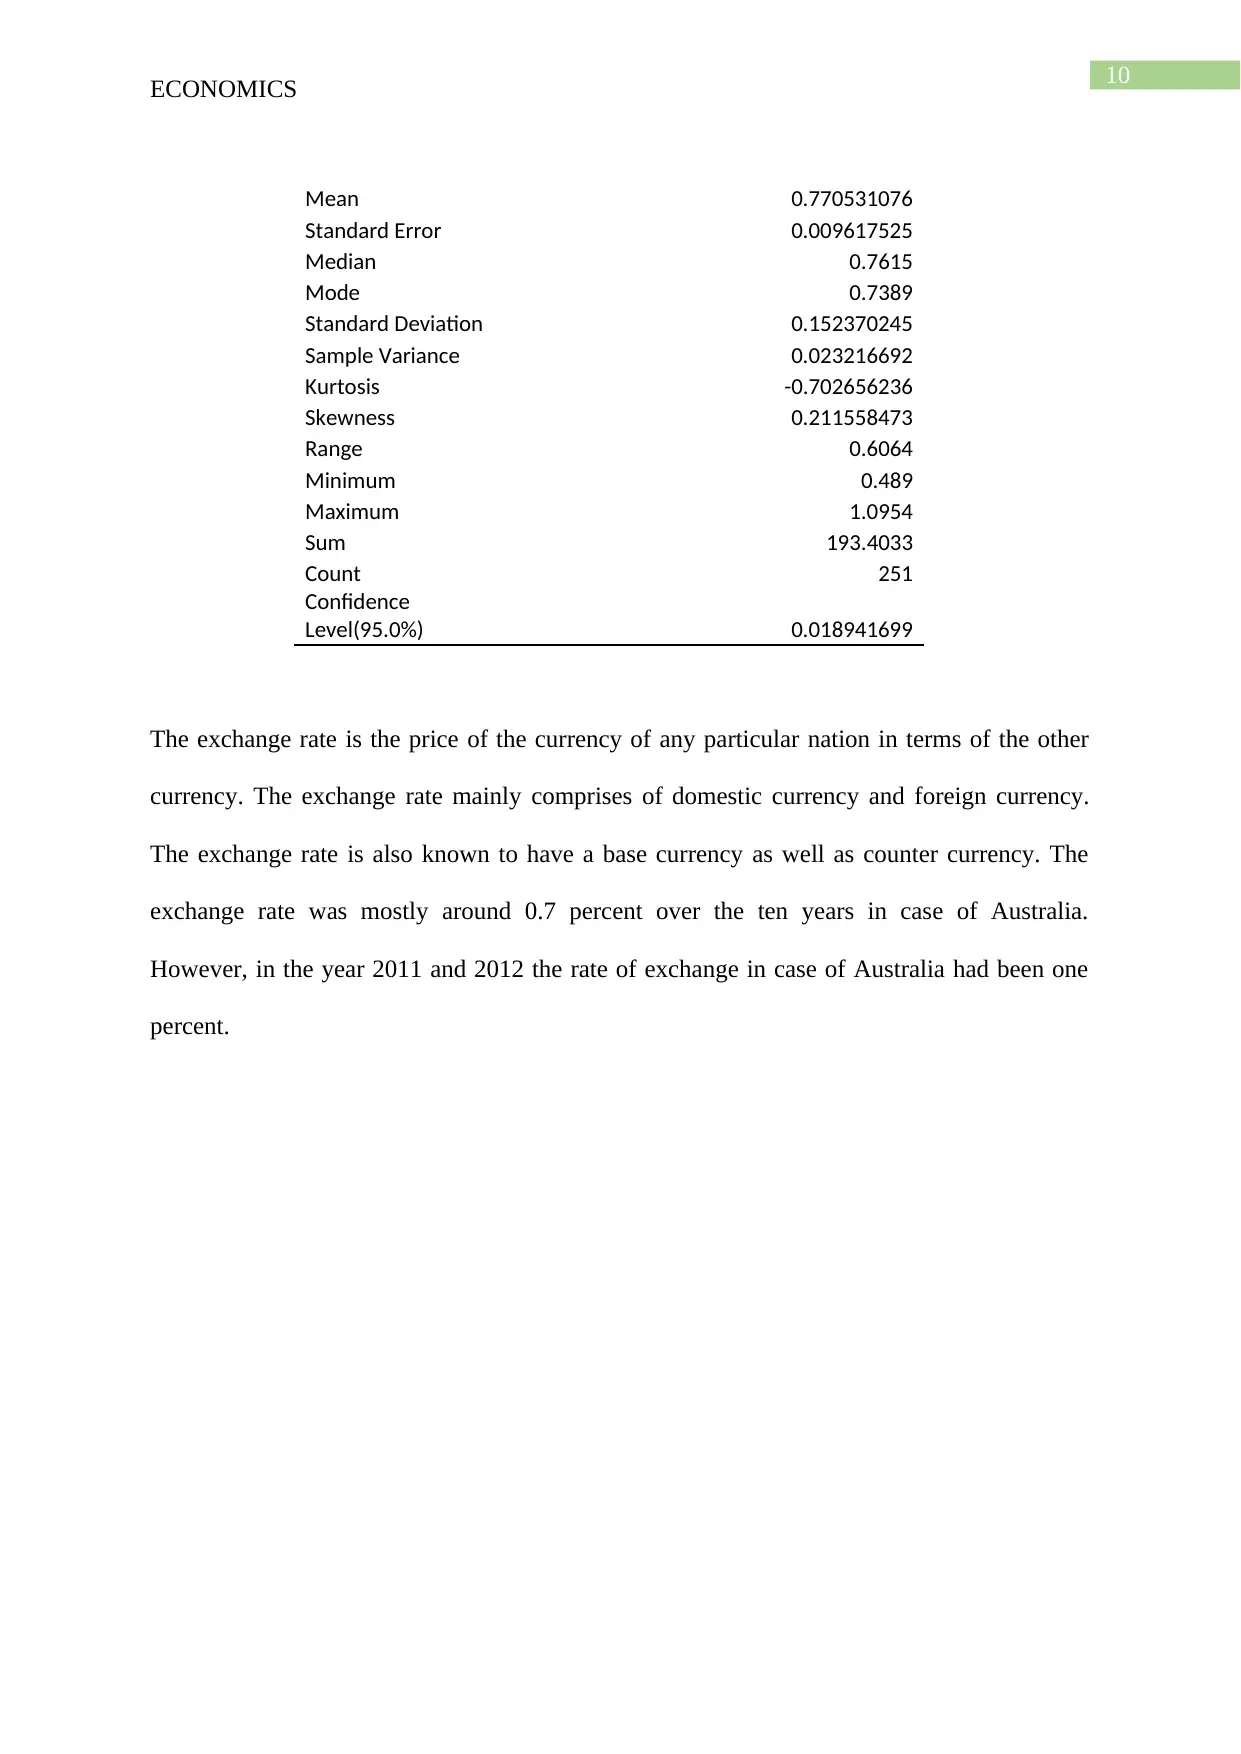
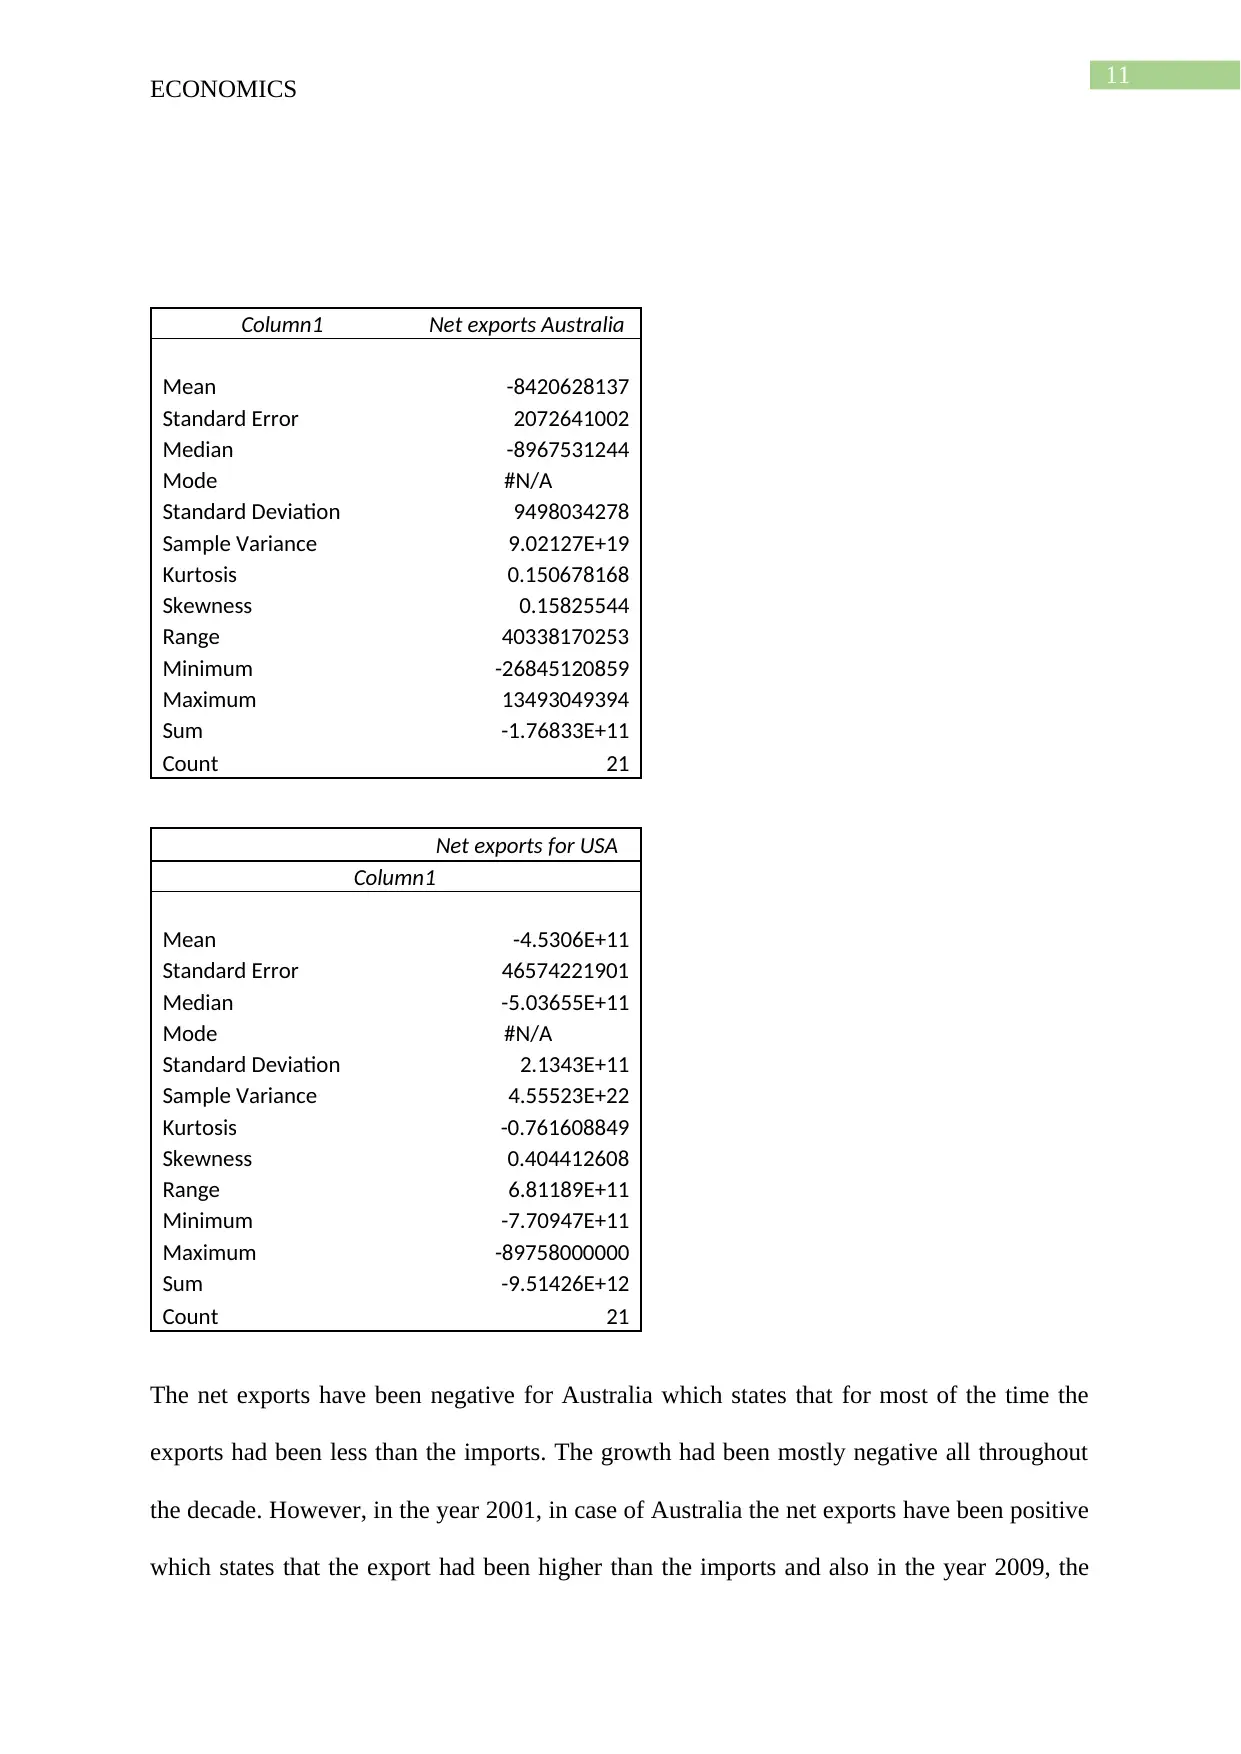
This report provides a detailed analysis of macroeconomic indicators for Australia and the USA from 1995 to 2015. It examines real GDP growth, unemployment rates, inflation rates, exchange rates, and net exports for both countries. Summary statistics are presented for each variable, and pairwise graphs illustrate the relationships between key indicators such as real GDP growth and inflation. The analysis reveals trends and comparisons between the two economies, highlighting periods of growth, recession, and varying economic performance. The report also briefly touches upon the policy instruments used by the governments and provides a concise conclusion summarizing the key findings. Desklib provides access to similar solved assignments for students.
Document Page
Running head: ECONOMICS
Economics
Name of the student
Name of the university
Author note
tabler-icon-diamond-filled.svg

Paraphrase This Document

Need a fresh take? Get an instant paraphrase of this document with our AI Paraphraser
Document Page
1
ECONOMICS
Table of Contents
Executive summary....................................................................................................................2
1.Collection of data on macroeconomic indicators....................................................................3
2.The summary statistics of the macroeconomic variables........................................................6
3.Pairwise graphs of the macroeconomic variables.................................................................15
Policies of government.............................................................................................................20
Macroeconomy of Australia.....................................................................................................22
Conclusion................................................................................................................................23
Reference list............................................................................................................................24
Document Page
2
ECONOMICS
Executive summary
The paper includes the macroeconomic indicators of the real gross domestic product, rate of
unemployment exchange rate along with the values of imports and exports. For the interest
rate the cash rate of Australia had been taken into account. The second part of the paper
shows the summary statistics of the various macroeconomic variables which have presented
in the tables. The third part of the paper comprises of the pair wise graphs of the real gdp
growth and inflation rate, real gdp growth with the rate of interest, unemployment rate and
interest rates. The fourth part comprises of the various policy instruments taken by the
government and lastly, the fifth part consists of the brief summary of the paper.
Document Page
3
ECONOMICS
1. Collection of
data on macroeconomic
indicators
a. Value of real GDP
b. Rate of unemployment
year AUSTRALIA USA
1995 8.470000267 5.599999905
1996 8.510000229 5.400000095
1997 8.359999657 4.940000057
1998 7.679999828 4.510000229
1999 6.869999886 4.21999979
2000 6.28000021 3.99000001
2001 6.739999771 4.730000019
2002 6.369999886 5.78000021
2003 5.929999828 5.989999771
2004 5.389999866 5.53000021
2005 5.03000021 5.079999924
2006 4.78000021 4.619999886
2007 4.380000114 4.619999886
2008 4.230000019 5.78000021
2009 5.559999943 9.25
2010 5.210000038 9.630000114
2011 5.079999924 8.949999809
2012 5.21999979 8.069999695
2013 5.659999847 7.380000114
2014 6.070000172 6.170000076
2015 6.059999943 5.28000021
AUSTRALIA USA
1994 663034939582.04 10026408985500.00
1995 688424992380.96 10299024618300.00
1996 715126459415.52 10689963360600.00
1997 743491381828.94 11169624848700.00
1998 777519044571.69 11666663209400.00
1999 816535447394.95 12213269668400.00
2000 848732984009.73 12713058213400.00
2001 865139889945.95 12837135352100.00
2002 899771632525.69 13066422980900.00
2003 926636518197.18 13433168199500.00
2004 963712223078.42 13941713404100.00
2005 994457691605.88 14408093840400.00
2006 1022642934821.49 14792303791800.00
2007 1061271523267.56 15055395304800.00
2008 1100090360276.03 15011490541400.00
2009 1121242097879.43 14594842181900.00
2010 1144260547872.81 14964372000000.00
2011 1172307576320.87 15204019634600.00
2012 1217933084117.14 15542161722300.00
2013 1250080212993.17 15802855301300.00
2014 1282061484148.13 16208861247400.00
2015 1312204498894.69 16672691917800.00
tabler-icon-diamond-filled.svg

Paraphrase This Document

Need a fresh take? Get an instant paraphrase of this document with our AI Paraphraser
Document Page
4
ECONOMICS
Document Page
5
ECONOMICS
EXPORT IMPORT
YEAR AUSTRALIA USA YEAR AUSTRALIA USA
1995 17.91688487 10.60551 1995 19.88467 11.77667
1996 18.93919435 10.71072 1996 19.39314 11.90052
1997 19.17481105 11.0798 1997 18.9 12.26432
1998 19.59557692 10.4848 1998 20.47485 12.27494
1999 18.35395554 10.26828 1999 20.80216 12.92474
2000 19.44348189 10.66464 2000 21.60415 14.31854
2001 22.23518161 9.666071 2001 22.14891 13.13707
2002 20.78313613 9.132386 2002 20.79123 13.01727
2003 19.10300414 9.037519 2003 21.20985 13.41307
2004 17.21976483 9.625368 2004 19.93653 14.66955
2005 18.28530247 9.996398 2005 21.02931 15.50427
2006 19.90812669 10.65479 2006 21.72581 16.21883
2007 20.23056827 11.49791 2007 21.87698 16.46102
2008 20.18869866 12.5144 2008 22.7391 17.42701
2009 23.03850745 11.01166 2009 22.82648 13.75417
2010 19.8425192 12.3783 2010 20.87387 15.80415
2011 21.47284119 13.57379 2011 20.5051 17.31137
2012 21.51897381 13.60661 2012 21.76811 17.10802
2013 19.98771744 13.63931 2013 21.28586 16.58695
2014 21.07576502 13.62004 2014 21.50408 16.54362
2015 20.01296407 12.49904 2015 21.53442 15.39099
Document Page
6
ECONOMICS
2.The summary statistics of the macroeconomic variables
Column1 Real GDP growth rate for Australia
Mean 0.033077479
Standard Error 0.001951855
Median 0.036577668
Mode #N/A
Standard Deviation 0.008944522
Sample Variance 8.00045E-05
Kurtosis -0.975315165
Skewness -0.051174675
Range 0.030953366
Minimum 0.019227273
Maximum 0.050180639
Sum 0.694627067
Count 21
Column1 real GDP growth rate for USA
Mean 0.024653609
Standard Error 0.003777312
Median 0.026666258
Mode #N/A
Standard Deviation 0.017309818
Sample Variance 0.00029963
Kurtosis 3.178261967
Skewness -1.419334798
Range 0.074607292
Minimum -0.027755296
Maximum 0.046851996
Sum 0.517725782
Count 21
The growth rate of the real gross domestic product of Australia shows that it kept on
increasing from 1995 to 2015. The growth rate of the GDP is also positive in nature in case of
Australia. However, the rate of growth also increased at a fluctuating rate. The real gross
tabler-icon-diamond-filled.svg

Paraphrase This Document

Need a fresh take? Get an instant paraphrase of this document with our AI Paraphraser
Document Page
7
ECONOMICS
domestic product of the United States of America is greater than the gross domestic product
of Australia. It also kept on growing from the year 1995 to 2015. However, in the year 2008
and 2009 the growth rate became negative in nature. The maximum growth rate for real gross
domestic product for USA is 0.046851996 and for Australia the maximum growth rate of the
gross domestic product is 0.050180639.
UNEMPLOYMENT OF AUSTRALIA
Mean 6.089524
Standard Error 0.28075
Median 5.93
Mode #N/A
Standard Deviation 1.286559
Sample Variance 1.655235
Kurtosis -0.37228
Skewness 0.684467
Range 4.28
Minimum 4.23
Maximum 8.51
Sum 127.88
Count 21
Column1 UNEMPLOYMENT RATE OF USA
Mean 5.977142868
Standard Error 0.367830277
Median 5.53000021
Mode 5.78000021
Standard
Deviation 1.685610087
Sample Variance 2.841281364
Kurtosis 0.131848224
Skewness 1.109018864
Range 5.640000105
Minimum 3.99000001
Maximum 9.630000114
Sum 125.5200002
Count 21
Document Page
8
ECONOMICS
In case of Australia, the rate of unemployment had been quite high ad it was around eight
percent. However, it kept on decreasing till the year 2013. The rate of unemployment
although increased after 2013 and went to six percent. The rate of unemployment is also less
than the rate of unemployment in Australia. The unemployment rate had been the least in
2008 for Australia which was around 4.23 percent. However the maximum rate of
unemployment had been 8.51 percent in the year 1996. In case of the United States of
America, the minimum rate of unemployment had been in the year 2000 and the maximum
rate of unemployment had been in the year 2010 where it was around ten percent. The rate of
unemployment in case of the united states of America had been mostly around five percent
although it started to increase from the year 2009 and after 2014 it has started to decrease.
Column1 INFLATION RATE USA
Mean 2.265611158
Standard Error 0.229945017
Median 2.337689937
Mode #N/A
Standard Deviation 1.053740446
Sample Variance 1.110368928
Kurtosis 0.925324684
Skewness -0.964493537
Range 4.194646563
Minimum -0.355546266
Maximum 3.839100297
Sum 47.57783431
Count 21
Confidence
Level(95.0%) 0.4796569
Column1
INFLATION RATE OF
AUSTRALIA
Mean 2.660028
Standard Error 0.258969
Median 2.615385
Mode #N/A
Standard Deviation 1.186744
Document Page
9
ECONOMICS
Sample Variance 1.408362
Kurtosis -0.29508
Skewness -0.01036
Range 4.402879
Minimum 0.224888
Maximum 4.627767
Sum 55.86059
Count 21
Confidence Level(95.0%) 0.540199
The rate of inflation kept on decreasing from the year 1995. Over the ten years, the inflation
rate had been around 2 percent which states that Australia had most of time achieved the
tartgeted inflation rate. The monetary policy of Australia states that the appropriate rate of
inflation is around 2 to 3 percent. Although in the year 1997 and 1998 it went to below one
percent. On the other hand, in case of the United States of America, the rate of inflation for
the ten year period also were around 2 to 3 percent which is the appropriate rate. However, in
the year 2009, the rate was negative which suggests recession.
Column1 EXCHANGE RATE OF USA
Mean 1.350850517
Standard Error 0.017442062
Median 1.313197636
Mode 1.353363107
Standard Deviation 0.276334229
Sample Variance 0.076360606
Kurtosis -0.335258987
Skewness 0.564650156
Range 1.132081248
Minimum 0.912908527
Maximum 2.044989775
Sum 339.0634799
Count 251
Confidence
Level(95.0%) 0.034352113
Column1 EXCHANGE RATE OF Australia
tabler-icon-diamond-filled.svg

Paraphrase This Document

Need a fresh take? Get an instant paraphrase of this document with our AI Paraphraser
Document Page
10
ECONOMICS
Mean 0.770531076
Standard Error 0.009617525
Median 0.7615
Mode 0.7389
Standard Deviation 0.152370245
Sample Variance 0.023216692
Kurtosis -0.702656236
Skewness 0.211558473
Range 0.6064
Minimum 0.489
Maximum 1.0954
Sum 193.4033
Count 251
Confidence
Level(95.0%) 0.018941699
The exchange rate is the price of the currency of any particular nation in terms of the other
currency. The exchange rate mainly comprises of domestic currency and foreign currency.
The exchange rate is also known to have a base currency as well as counter currency. The
exchange rate was mostly around 0.7 percent over the ten years in case of Australia.
However, in the year 2011 and 2012 the rate of exchange in case of Australia had been one
percent.
Document Page
11
ECONOMICS
Column1 Net exports Australia
Mean -8420628137
Standard Error 2072641002
Median -8967531244
Mode #N/A
Standard Deviation 9498034278
Sample Variance 9.02127E+19
Kurtosis 0.150678168
Skewness 0.15825544
Range 40338170253
Minimum -26845120859
Maximum 13493049394
Sum -1.76833E+11
Count 21
Net exports for USA
Column1
Mean -4.5306E+11
Standard Error 46574221901
Median -5.03655E+11
Mode #N/A
Standard Deviation 2.1343E+11
Sample Variance 4.55523E+22
Kurtosis -0.761608849
Skewness 0.404412608
Range 6.81189E+11
Minimum -7.70947E+11
Maximum -89758000000
Sum -9.51426E+12
Count 21
The net exports have been negative for Australia which states that for most of the time the
exports had been less than the imports. The growth had been mostly negative all throughout
the decade. However, in the year 2001, in case of Australia the net exports have been positive
which states that the export had been higher than the imports and also in the year 2009, the
chevron_up_icon
1 out of 26
circle_padding
hide_on_mobile
zoom_out_icon
[object Object]