BUS700 Economics Report: Evaluating Australia & USA's Macroeconomy
VerifiedAdded on 2023/04/22
|21
|4999
|495
Report
AI Summary
This report provides a comparative analysis of the macroeconomic performance of Australia and the USA between 1995 and 2015. It examines key macroeconomic indicators such as real GDP growth rate, inflation rate, unemployment rate, exchange rate, real interest rate, and net export. Summary statistics for each indicator are presented and analyzed, followed by an evaluation of the relationship between real GDP growth and the other indicators. The report also explores government policies implemented in both countries to stimulate economic performance, along with an outlook on the Australian economy. The analysis utilizes data from sources like the World Bank to provide a comprehensive overview of the macroeconomic trends in both nations during the specified period.
Running head: MACROECONOMIC PERFORMANCE OF AUSTRALIA AND USA
Macroeconomic Performance of Australia and USA
Name of the Student
Name of the University
Course ID
Macroeconomic Performance of Australia and USA
Name of the Student
Name of the University
Course ID
Paraphrase This Document
Need a fresh take? Get an instant paraphrase of this document with our AI Paraphraser
1MACROECONOMIC PERFORMANCE OF AUSTRALIA AND USA
Executive Summary
Australia and USA are two of the leading nations in the global economy. USA though is large
nation compared to Australia, however when viewed in terms of economic progress both the
nations are comparable. The paper makes a comparative analysis of macroeconomic
performance of USA and Australia. The sample period chosen for the analysis ranged from
1995 to 2015. Macroeconomic performance of an economy depends on performance of a
number of indicators. These indicators include GDP growth, inflation rate, unemployment
rate, exchange rate, real interest rate and net export. In addition to analyzing summary
statistics of the chosen indicators, the paper evaluates relationship between GDP growth and
each of these indicators. Government plays an important role in supporting economic activity
through various policy measure. The government policies of respective nations are analyzed
to understand the performance trend of different indicators.
2MACROECONOMIC PERFORMANCE OF AUSTRALIA AND USA
Table of Contents
Introduction................................................................................................................................3
Summary statistics of different Macroeconomic indicators.......................................................3
Real GDP growth rate............................................................................................................3
Inflation rate...........................................................................................................................4
Interest rate.............................................................................................................................7
Net Export..............................................................................................................................8
Exchange rate.........................................................................................................................9
Relation between real GDP growth and other indicators.........................................................10
Real GDP growth and Inflation rate.....................................................................................10
Real GDP growth and unemployment rate..........................................................................11
Real GDP growth and exchange rate...................................................................................12
Real GDP growth and real interest rate................................................................................13
Exchange rate and growth of net export..............................................................................14
Government policies to stimulate economic performance.......................................................14
Macroeconomic policies in Australia...................................................................................15
Macroeconomic policies in United State.............................................................................15
Australian economic outlook...................................................................................................16
Conclusion................................................................................................................................16
References................................................................................................................................17
⊘ This is a preview!⊘
Do you want full access?
Subscribe today to unlock all pages.
Trusted by 1+ million students worldwide
3MACROECONOMIC PERFORMANCE OF AUSTRALIA AND USA
Introduction
In the world economy, Australia stands as one of the strongest economy in terms of
growth and economic performance. This is a service sector dominating economy with the
sector making highest contribution to the GDP. Agriculture and industries also make
significant contribution to the economy. Australia is an open economy maintaining trade
relation with many of the developed and developing nation (Hatfield-Dodds, et al., 2015).
Several natural disaster and global financial crisis though slowed down economic growth of
Australia but the economy has made a quick recovery.
United State of America on the other hand is considered as the largest economy in the
world. The nominal GDP of US as recorded at the end of 2018 is USD 20513 trillion. USA
is a world leading economy in terms of international trade and foreign investment. In term of
purchasing power parity, USA stands first in the world (dfat.gov.au, 2018). The economy
experienced a severe recession in 2008 resulted from sub-prime mortgage crisis, failure of
investment banks and an economy wide liquidity crisis. It took a considerably long time for
the economy to fully recover the crisis.
The report aims at evaluating macroeconomic performance of Australia and USA for
the period ranging from 1995 to 2015.
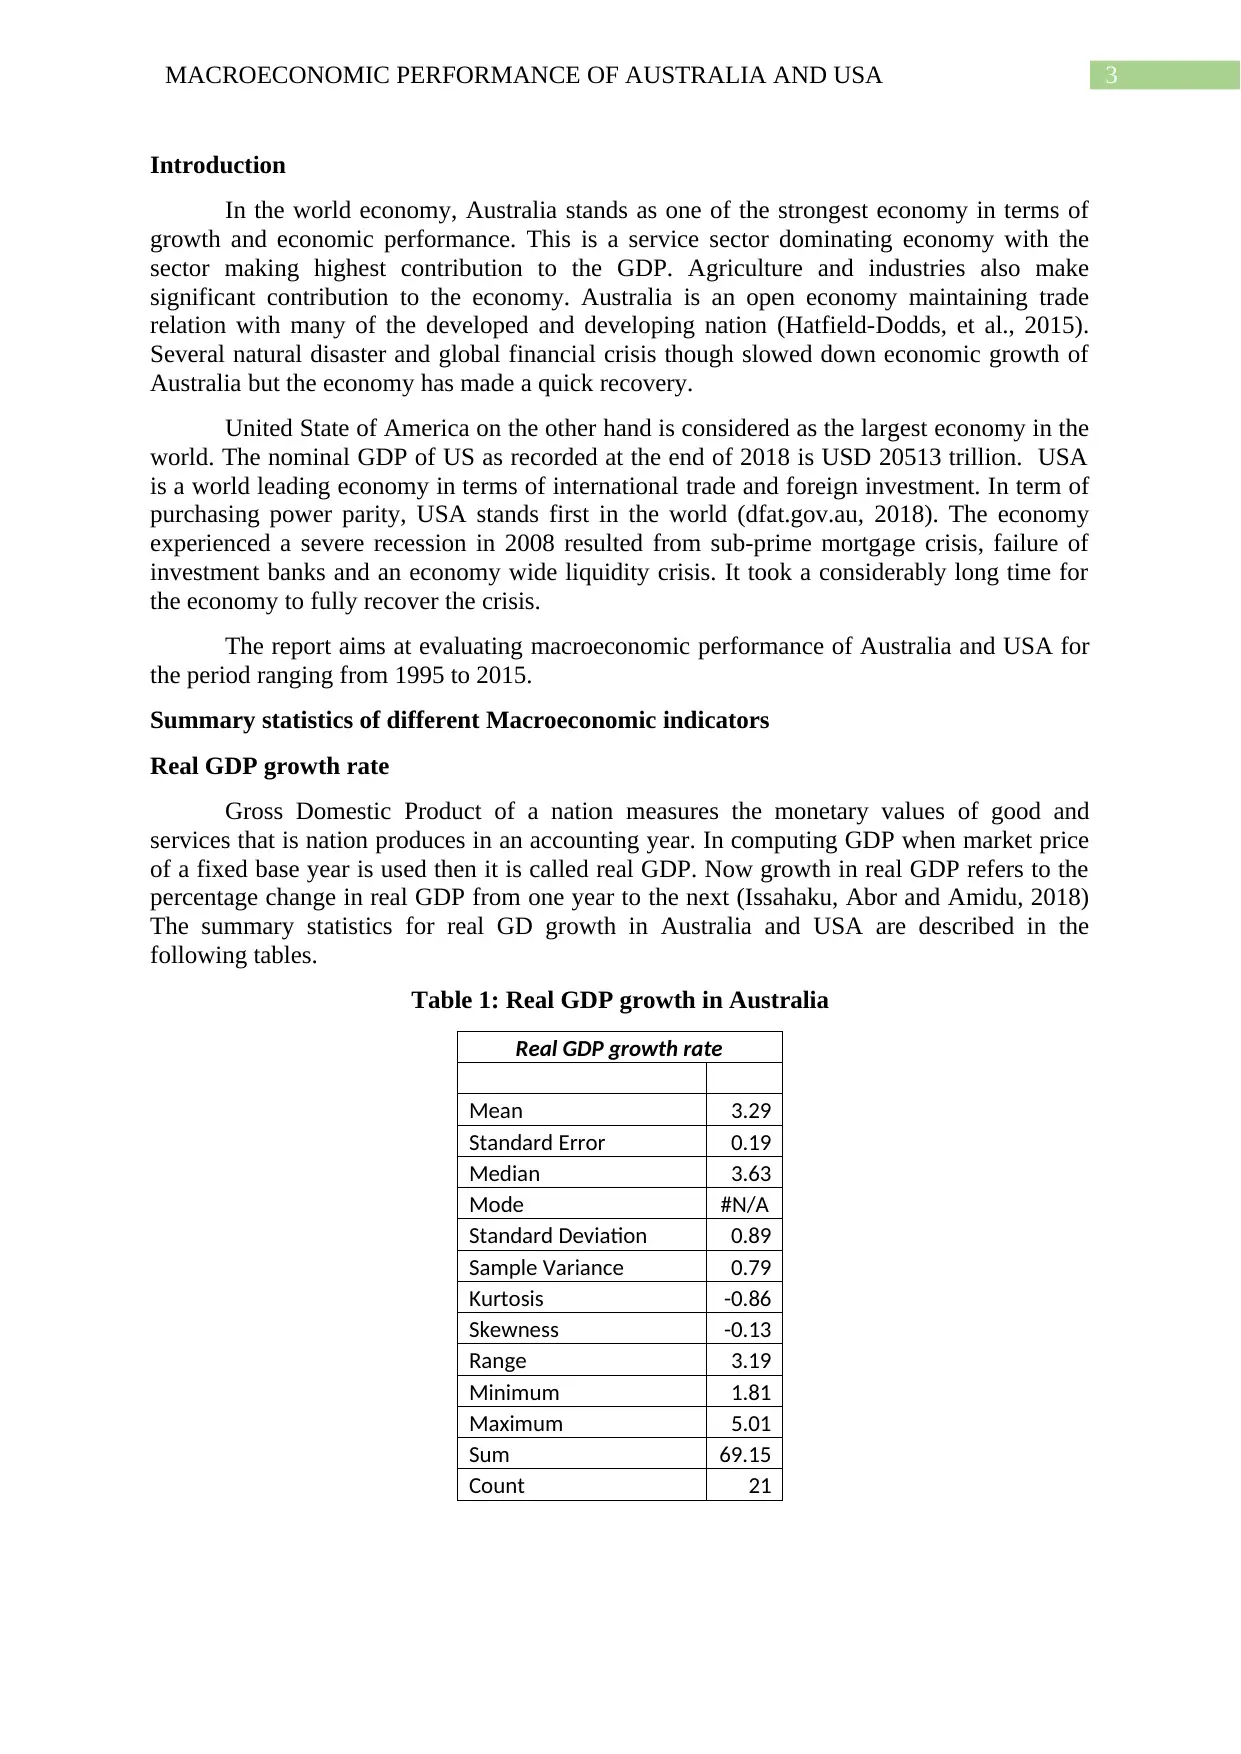
Summary statistics of different Macroeconomic indicators
Real GDP growth rate
Gross Domestic Product of a nation measures the monetary values of good and
services that is nation produces in an accounting year. In computing GDP when market price
of a fixed base year is used then it is called real GDP. Now growth in real GDP refers to the
percentage change in real GDP from one year to the next (Issahaku, Abor and Amidu, 2018)
The summary statistics for real GD growth in Australia and USA are described in the
following tables.
Table 1: Real GDP growth in Australia
Real GDP growth rate
Mean 3.29
Standard Error 0.19
Median 3.63
Mode #N/A
Standard Deviation 0.89
Sample Variance 0.79
Kurtosis -0.86
Skewness -0.13
Range 3.19
Minimum 1.81
Maximum 5.01
Sum 69.15
Count 21
Introduction
In the world economy, Australia stands as one of the strongest economy in terms of
growth and economic performance. This is a service sector dominating economy with the
sector making highest contribution to the GDP. Agriculture and industries also make
significant contribution to the economy. Australia is an open economy maintaining trade
relation with many of the developed and developing nation (Hatfield-Dodds, et al., 2015).
Several natural disaster and global financial crisis though slowed down economic growth of
Australia but the economy has made a quick recovery.
United State of America on the other hand is considered as the largest economy in the
world. The nominal GDP of US as recorded at the end of 2018 is USD 20513 trillion. USA
is a world leading economy in terms of international trade and foreign investment. In term of
purchasing power parity, USA stands first in the world (dfat.gov.au, 2018). The economy
experienced a severe recession in 2008 resulted from sub-prime mortgage crisis, failure of
investment banks and an economy wide liquidity crisis. It took a considerably long time for
the economy to fully recover the crisis.
The report aims at evaluating macroeconomic performance of Australia and USA for
the period ranging from 1995 to 2015.
Summary statistics of different Macroeconomic indicators
Real GDP growth rate
Gross Domestic Product of a nation measures the monetary values of good and
services that is nation produces in an accounting year. In computing GDP when market price
of a fixed base year is used then it is called real GDP. Now growth in real GDP refers to the
percentage change in real GDP from one year to the next (Issahaku, Abor and Amidu, 2018)
The summary statistics for real GD growth in Australia and USA are described in the
following tables.
Table 1: Real GDP growth in Australia
Real GDP growth rate
Mean 3.29
Standard Error 0.19
Median 3.63
Mode #N/A
Standard Deviation 0.89
Sample Variance 0.79
Kurtosis -0.86
Skewness -0.13
Range 3.19
Minimum 1.81
Maximum 5.01
Sum 69.15
Count 21
Paraphrase This Document
Need a fresh take? Get an instant paraphrase of this document with our AI Paraphraser
4MACROECONOMIC PERFORMANCE OF AUSTRALIA AND USA
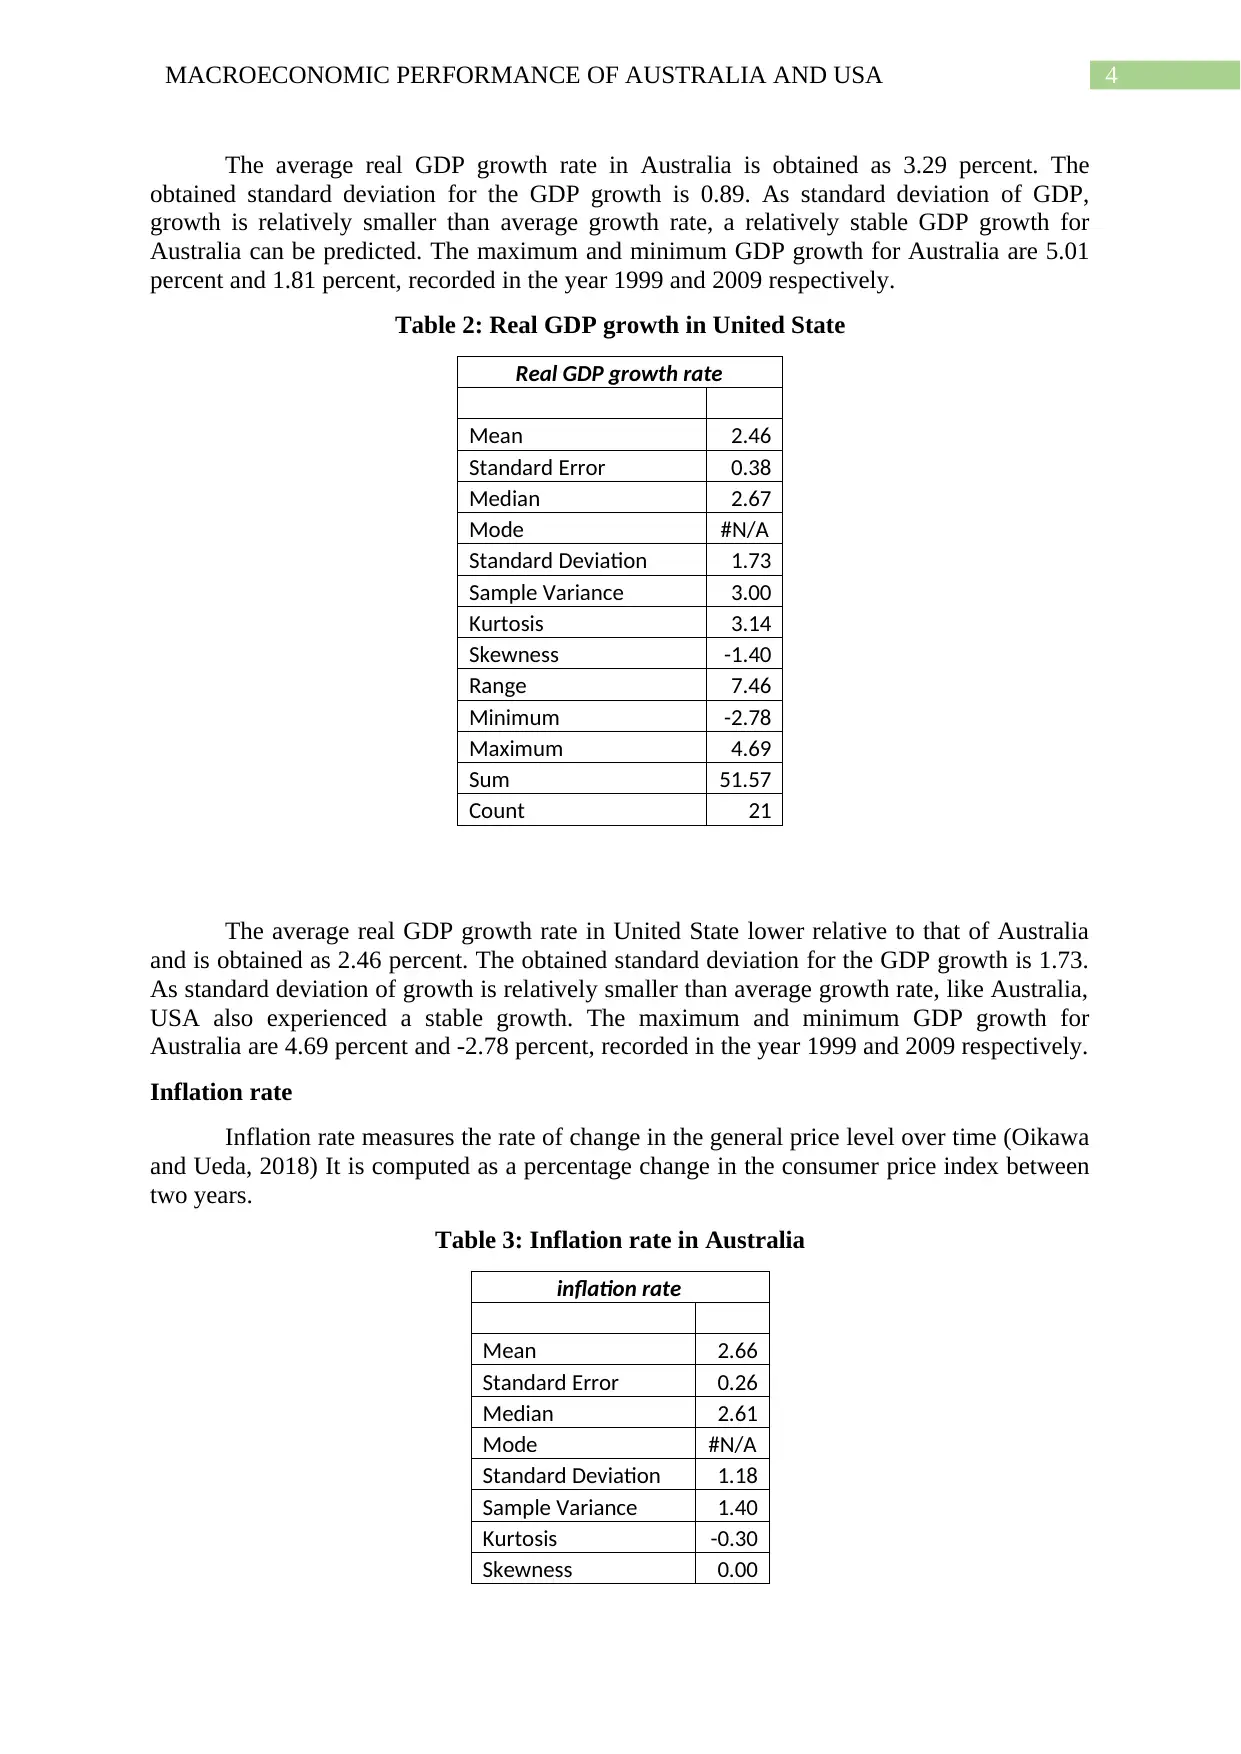
The average real GDP growth rate in Australia is obtained as 3.29 percent. The
obtained standard deviation for the GDP growth is 0.89. As standard deviation of GDP,
growth is relatively smaller than average growth rate, a relatively stable GDP growth for
Australia can be predicted. The maximum and minimum GDP growth for Australia are 5.01
percent and 1.81 percent, recorded in the year 1999 and 2009 respectively.
Table 2: Real GDP growth in United State
Real GDP growth rate
Mean 2.46
Standard Error 0.38
Median 2.67
Mode #N/A
Standard Deviation 1.73
Sample Variance 3.00
Kurtosis 3.14
Skewness -1.40
Range 7.46
Minimum -2.78
Maximum 4.69
Sum 51.57
Count 21
The average real GDP growth rate in United State lower relative to that of Australia
and is obtained as 2.46 percent. The obtained standard deviation for the GDP growth is 1.73.
As standard deviation of growth is relatively smaller than average growth rate, like Australia,
USA also experienced a stable growth. The maximum and minimum GDP growth for
Australia are 4.69 percent and -2.78 percent, recorded in the year 1999 and 2009 respectively.
Inflation rate
Inflation rate measures the rate of change in the general price level over time (Oikawa
and Ueda, 2018) It is computed as a percentage change in the consumer price index between
two years.
Table 3: Inflation rate in Australia
inflation rate
Mean 2.66
Standard Error 0.26
Median 2.61
Mode #N/A
Standard Deviation 1.18
Sample Variance 1.40
Kurtosis -0.30
Skewness 0.00
5MACROECONOMIC PERFORMANCE OF AUSTRALIA AND USA
Range 4.39
Minimum 0.25
Maximum 4.64
Sum
55.8
6
Count 21
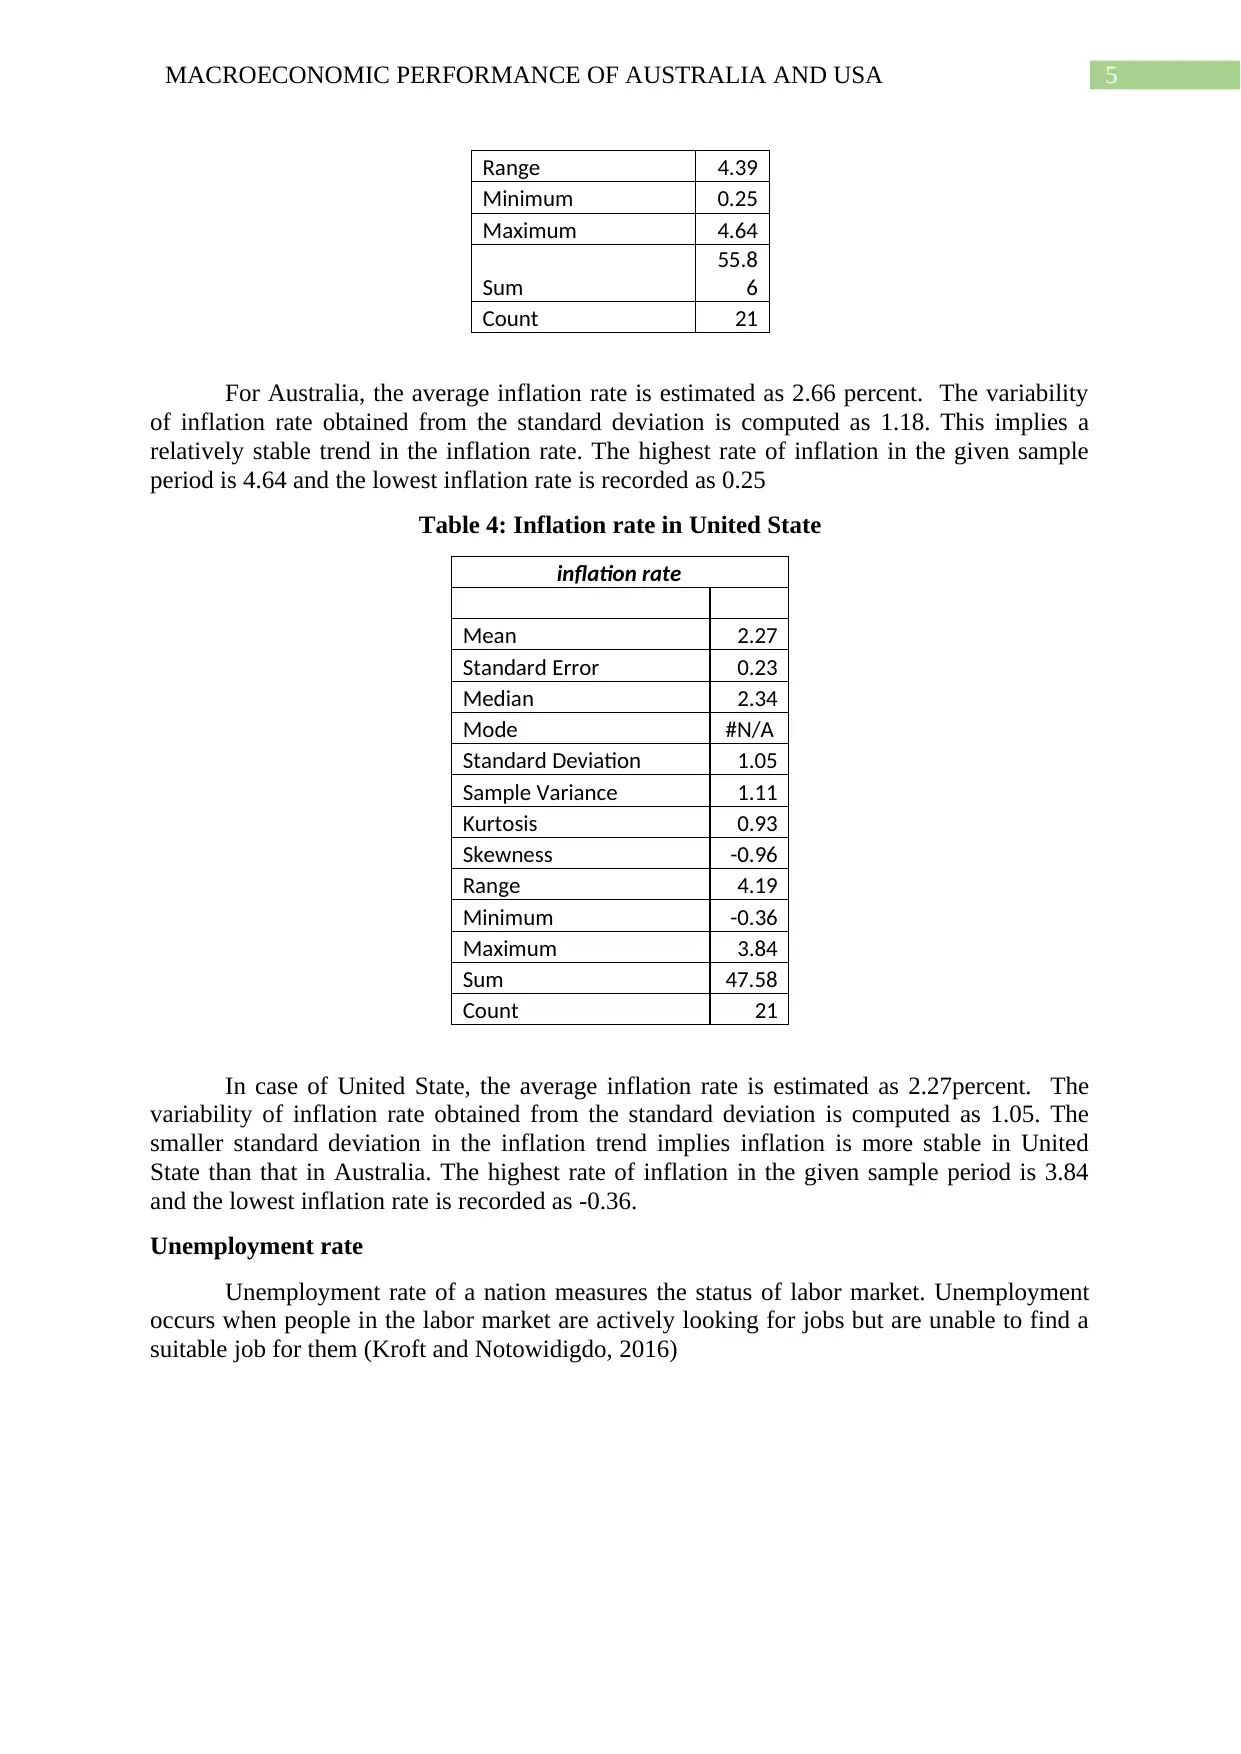
For Australia, the average inflation rate is estimated as 2.66 percent. The variability
of inflation rate obtained from the standard deviation is computed as 1.18. This implies a
relatively stable trend in the inflation rate. The highest rate of inflation in the given sample
period is 4.64 and the lowest inflation rate is recorded as 0.25
Table 4: Inflation rate in United State
inflation rate
Mean 2.27
Standard Error 0.23
Median 2.34
Mode #N/A
Standard Deviation 1.05
Sample Variance 1.11
Kurtosis 0.93
Skewness -0.96
Range 4.19
Minimum -0.36
Maximum 3.84
Sum 47.58
Count 21
In case of United State, the average inflation rate is estimated as 2.27percent. The
variability of inflation rate obtained from the standard deviation is computed as 1.05. The
smaller standard deviation in the inflation trend implies inflation is more stable in United
State than that in Australia. The highest rate of inflation in the given sample period is 3.84
and the lowest inflation rate is recorded as -0.36.
Unemployment rate
Unemployment rate of a nation measures the status of labor market. Unemployment
occurs when people in the labor market are actively looking for jobs but are unable to find a
suitable job for them (Kroft and Notowidigdo, 2016)
Range 4.39
Minimum 0.25
Maximum 4.64
Sum
55.8
6
Count 21
For Australia, the average inflation rate is estimated as 2.66 percent. The variability
of inflation rate obtained from the standard deviation is computed as 1.18. This implies a
relatively stable trend in the inflation rate. The highest rate of inflation in the given sample
period is 4.64 and the lowest inflation rate is recorded as 0.25
Table 4: Inflation rate in United State
inflation rate
Mean 2.27
Standard Error 0.23
Median 2.34
Mode #N/A
Standard Deviation 1.05
Sample Variance 1.11
Kurtosis 0.93
Skewness -0.96
Range 4.19
Minimum -0.36
Maximum 3.84
Sum 47.58
Count 21
In case of United State, the average inflation rate is estimated as 2.27percent. The
variability of inflation rate obtained from the standard deviation is computed as 1.05. The
smaller standard deviation in the inflation trend implies inflation is more stable in United
State than that in Australia. The highest rate of inflation in the given sample period is 3.84
and the lowest inflation rate is recorded as -0.36.
Unemployment rate
Unemployment rate of a nation measures the status of labor market. Unemployment
occurs when people in the labor market are actively looking for jobs but are unable to find a
suitable job for them (Kroft and Notowidigdo, 2016)
⊘ This is a preview!⊘
Do you want full access?
Subscribe today to unlock all pages.
Trusted by 1+ million students worldwide
6MACROECONOMIC PERFORMANCE OF AUSTRALIA AND USA
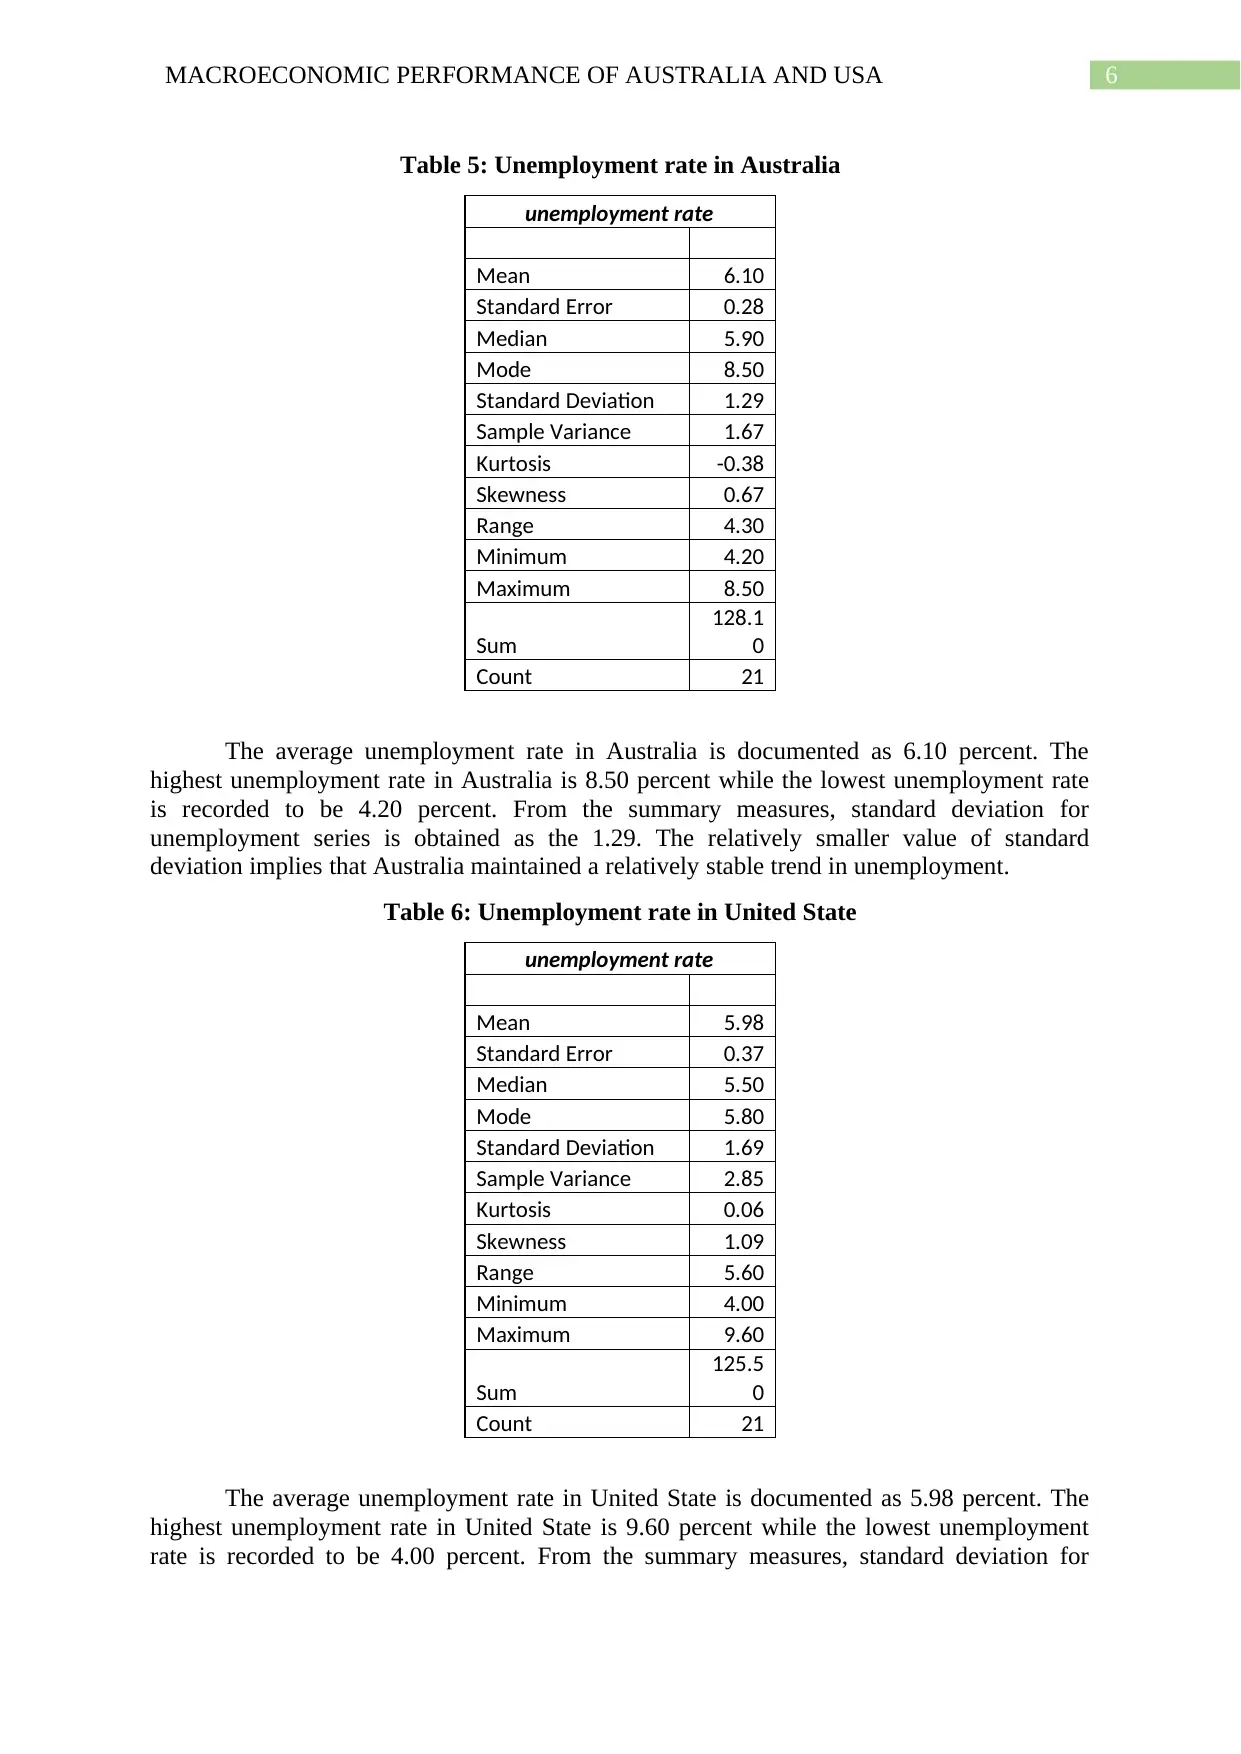
Table 5: Unemployment rate in Australia
unemployment rate
Mean 6.10
Standard Error 0.28
Median 5.90
Mode 8.50
Standard Deviation 1.29
Sample Variance 1.67
Kurtosis -0.38
Skewness 0.67
Range 4.30
Minimum 4.20
Maximum 8.50
Sum
128.1
0
Count 21
The average unemployment rate in Australia is documented as 6.10 percent. The
highest unemployment rate in Australia is 8.50 percent while the lowest unemployment rate
is recorded to be 4.20 percent. From the summary measures, standard deviation for
unemployment series is obtained as the 1.29. The relatively smaller value of standard
deviation implies that Australia maintained a relatively stable trend in unemployment.
Table 6: Unemployment rate in United State
unemployment rate
Mean 5.98
Standard Error 0.37
Median 5.50
Mode 5.80
Standard Deviation 1.69
Sample Variance 2.85
Kurtosis 0.06
Skewness 1.09
Range 5.60
Minimum 4.00
Maximum 9.60
Sum
125.5
0
Count 21
The average unemployment rate in United State is documented as 5.98 percent. The
highest unemployment rate in United State is 9.60 percent while the lowest unemployment
rate is recorded to be 4.00 percent. From the summary measures, standard deviation for
Paraphrase This Document
Need a fresh take? Get an instant paraphrase of this document with our AI Paraphraser
7MACROECONOMIC PERFORMANCE OF AUSTRALIA AND USA
unemployment series is obtained as the 1.69. The relatively smaller value of standard
deviation implies that United State maintained a relatively stable trend in unemployment.
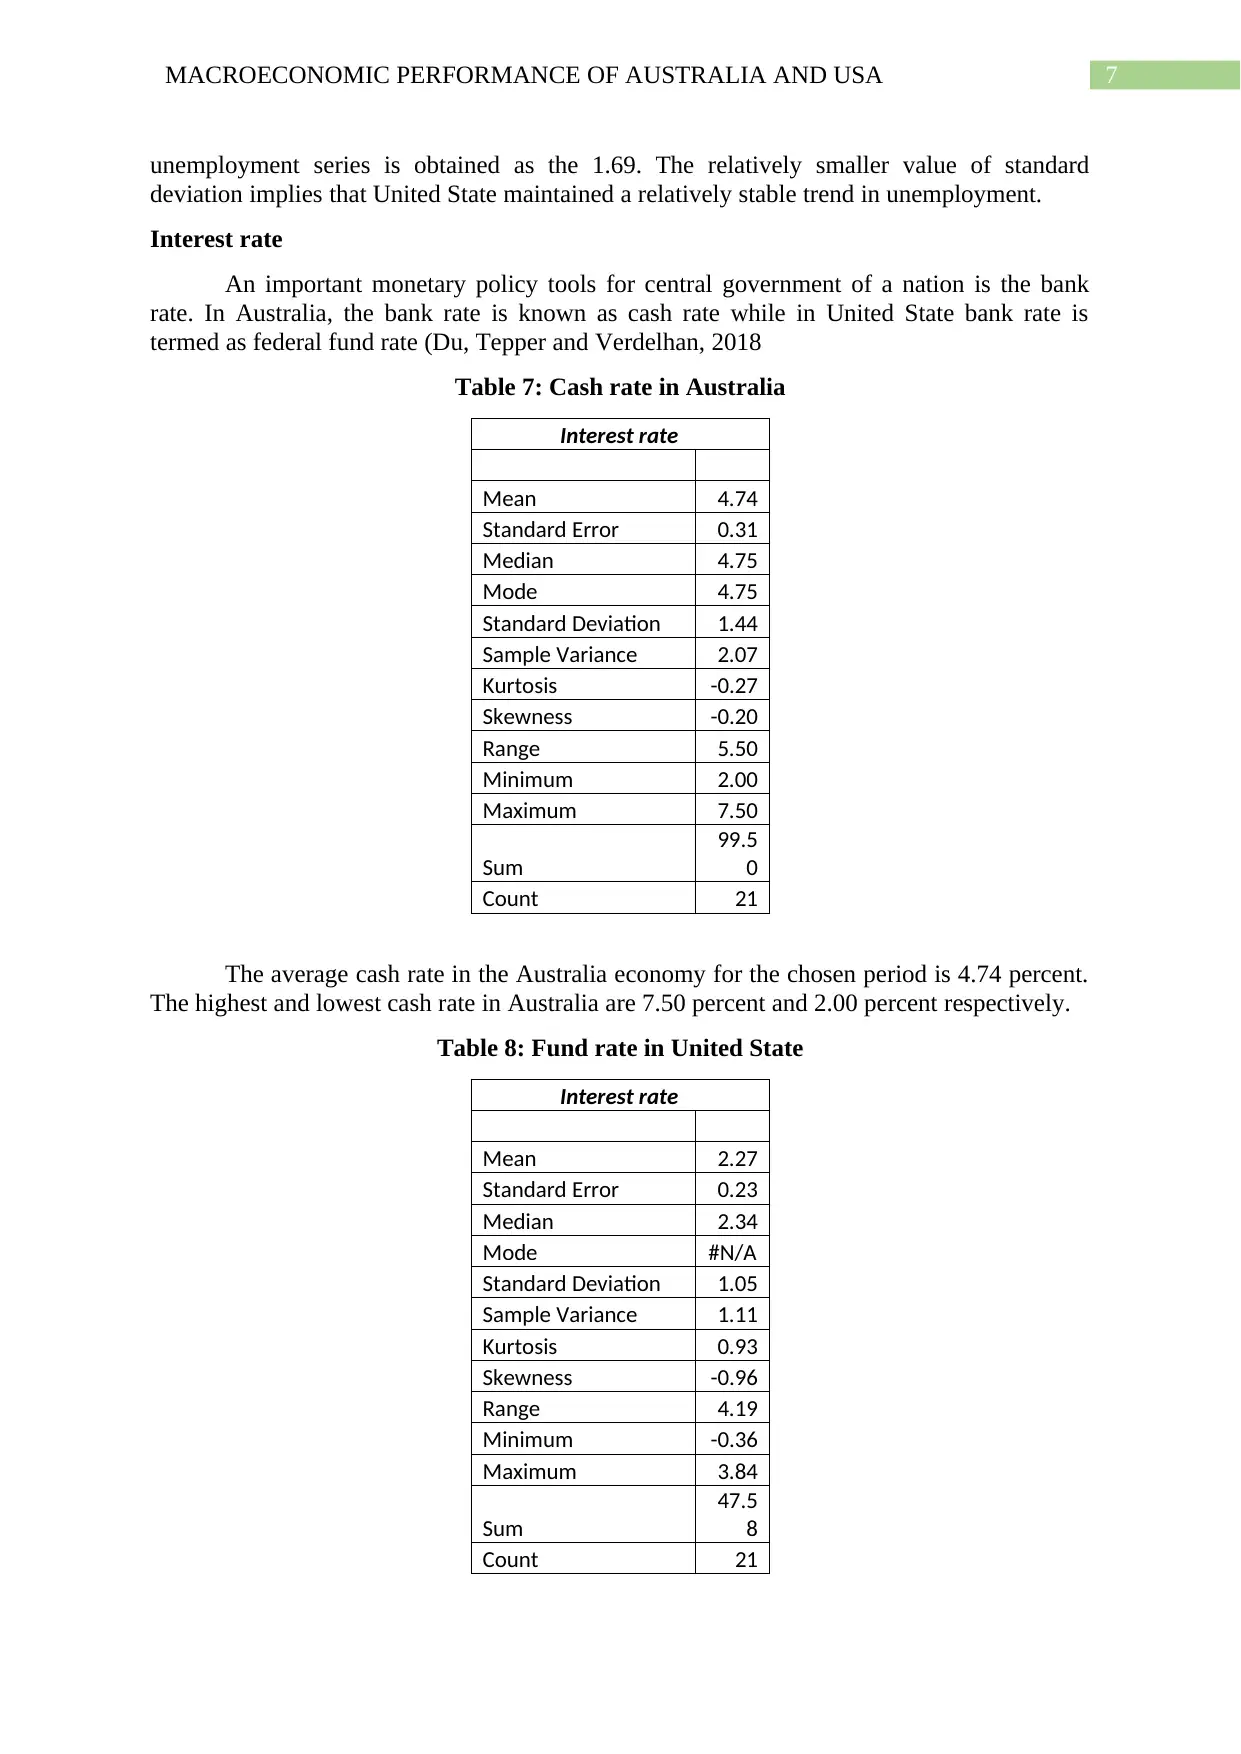
Interest rate
An important monetary policy tools for central government of a nation is the bank
rate. In Australia, the bank rate is known as cash rate while in United State bank rate is
termed as federal fund rate (Du, Tepper and Verdelhan, 2018
Table 7: Cash rate in Australia
Interest rate
Mean 4.74
Standard Error 0.31
Median 4.75
Mode 4.75
Standard Deviation 1.44
Sample Variance 2.07
Kurtosis -0.27
Skewness -0.20
Range 5.50
Minimum 2.00
Maximum 7.50
Sum
99.5
0
Count 21
The average cash rate in the Australia economy for the chosen period is 4.74 percent.
The highest and lowest cash rate in Australia are 7.50 percent and 2.00 percent respectively.
Table 8: Fund rate in United State
Interest rate
Mean 2.27
Standard Error 0.23
Median 2.34
Mode #N/A
Standard Deviation 1.05
Sample Variance 1.11
Kurtosis 0.93
Skewness -0.96
Range 4.19
Minimum -0.36
Maximum 3.84
Sum
47.5
8
Count 21
unemployment series is obtained as the 1.69. The relatively smaller value of standard
deviation implies that United State maintained a relatively stable trend in unemployment.
Interest rate
An important monetary policy tools for central government of a nation is the bank
rate. In Australia, the bank rate is known as cash rate while in United State bank rate is
termed as federal fund rate (Du, Tepper and Verdelhan, 2018
Table 7: Cash rate in Australia
Interest rate
Mean 4.74
Standard Error 0.31
Median 4.75
Mode 4.75
Standard Deviation 1.44
Sample Variance 2.07
Kurtosis -0.27
Skewness -0.20
Range 5.50
Minimum 2.00
Maximum 7.50
Sum
99.5
0
Count 21
The average cash rate in the Australia economy for the chosen period is 4.74 percent.
The highest and lowest cash rate in Australia are 7.50 percent and 2.00 percent respectively.
Table 8: Fund rate in United State
Interest rate
Mean 2.27
Standard Error 0.23
Median 2.34
Mode #N/A
Standard Deviation 1.05
Sample Variance 1.11
Kurtosis 0.93
Skewness -0.96
Range 4.19
Minimum -0.36
Maximum 3.84
Sum
47.5
8
Count 21
8MACROECONOMIC PERFORMANCE OF AUSTRALIA AND USA
The average fund rate in the USA is relatively lower as compared to Australia with
average fund rate being 2.27 percent for the chosen period. The highest and lowest fund rate
in United State are 3.84 percent and -0.36 percent respectively.
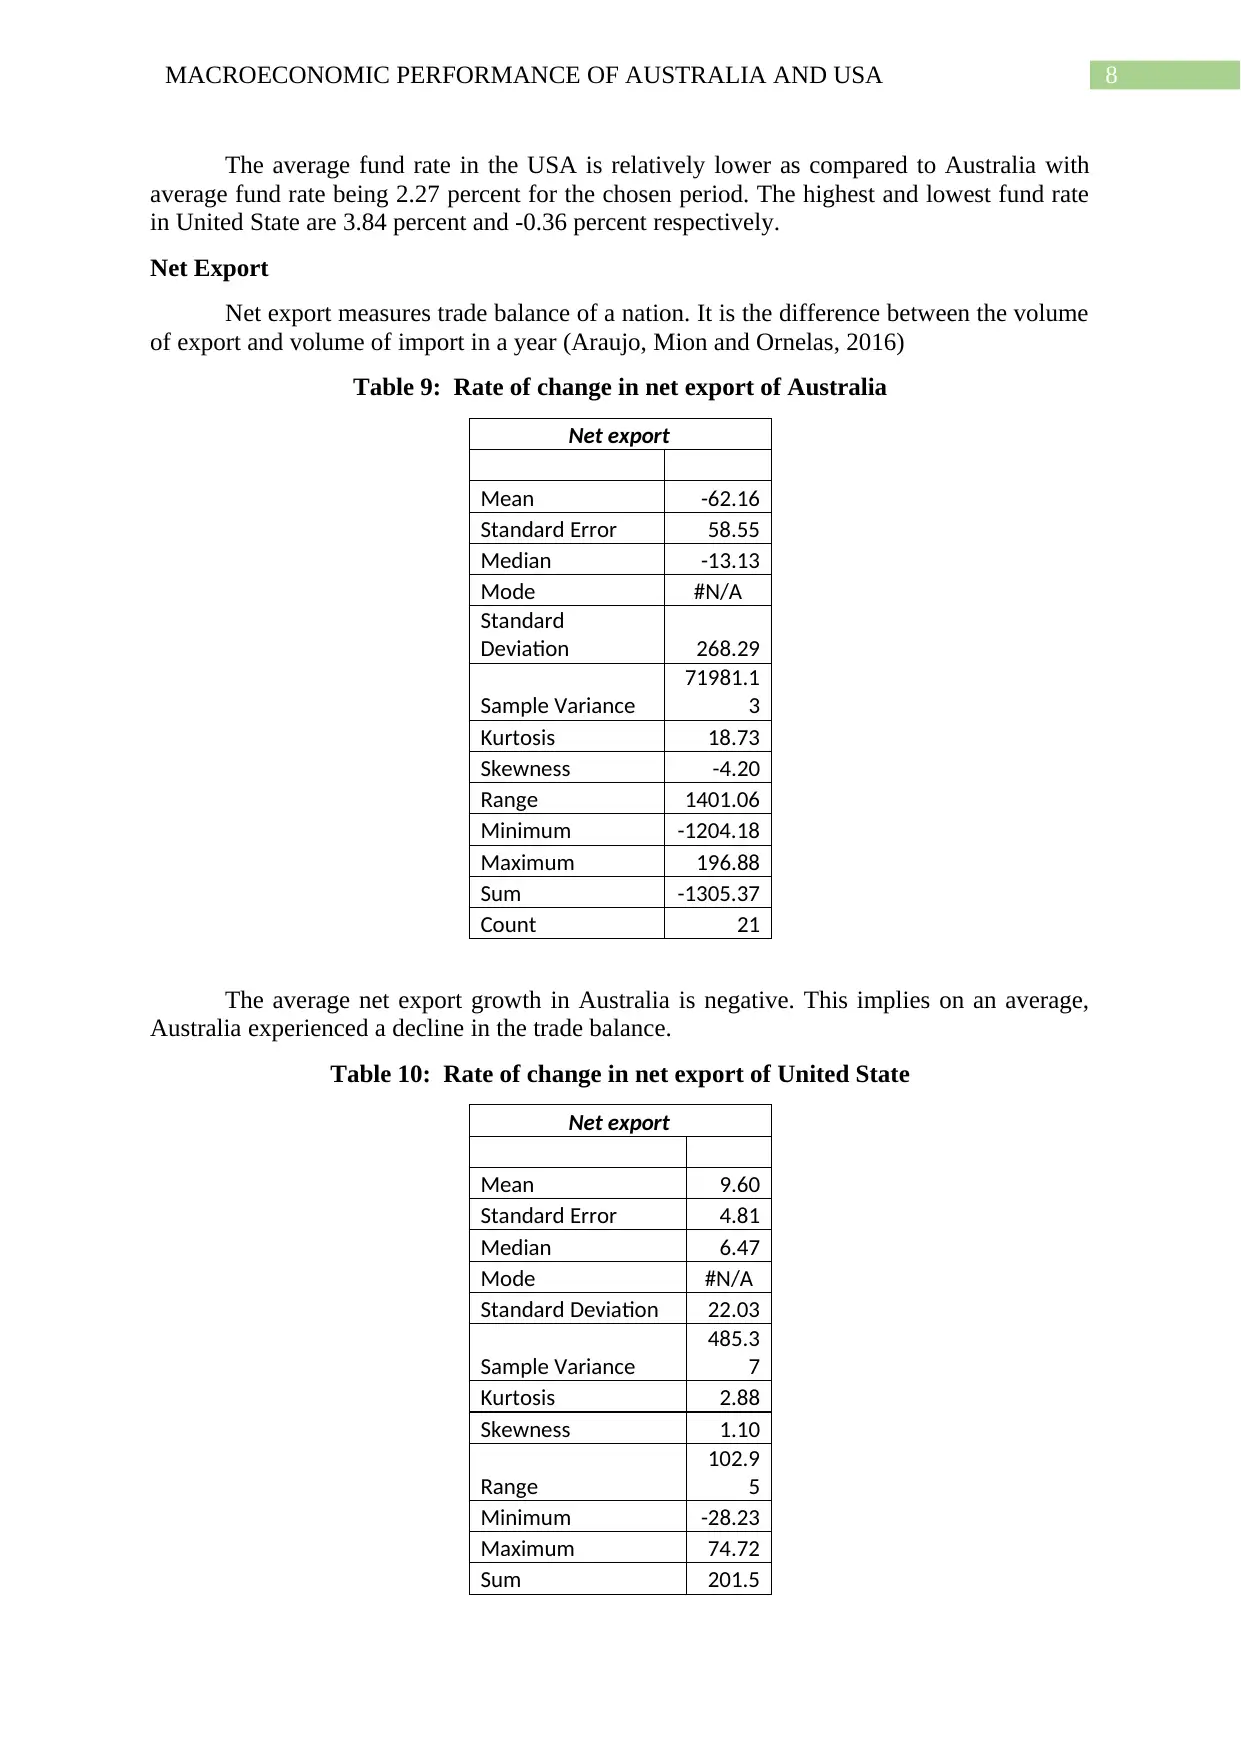
Net Export
Net export measures trade balance of a nation. It is the difference between the volume
of export and volume of import in a year (Araujo, Mion and Ornelas, 2016)
Table 9: Rate of change in net export of Australia
Net export
Mean -62.16
Standard Error 58.55
Median -13.13
Mode #N/A
Standard
Deviation 268.29
Sample Variance
71981.1
3
Kurtosis 18.73
Skewness -4.20
Range 1401.06
Minimum -1204.18
Maximum 196.88
Sum -1305.37
Count 21
The average net export growth in Australia is negative. This implies on an average,
Australia experienced a decline in the trade balance.
Table 10: Rate of change in net export of United State
Net export
Mean 9.60
Standard Error 4.81
Median 6.47
Mode #N/A
Standard Deviation 22.03
Sample Variance
485.3
7
Kurtosis 2.88
Skewness 1.10
Range
102.9
5
Minimum -28.23
Maximum 74.72
Sum 201.5
The average fund rate in the USA is relatively lower as compared to Australia with
average fund rate being 2.27 percent for the chosen period. The highest and lowest fund rate
in United State are 3.84 percent and -0.36 percent respectively.
Net Export
Net export measures trade balance of a nation. It is the difference between the volume
of export and volume of import in a year (Araujo, Mion and Ornelas, 2016)
Table 9: Rate of change in net export of Australia
Net export
Mean -62.16
Standard Error 58.55
Median -13.13
Mode #N/A
Standard
Deviation 268.29
Sample Variance
71981.1
3
Kurtosis 18.73
Skewness -4.20
Range 1401.06
Minimum -1204.18
Maximum 196.88
Sum -1305.37
Count 21
The average net export growth in Australia is negative. This implies on an average,
Australia experienced a decline in the trade balance.
Table 10: Rate of change in net export of United State
Net export
Mean 9.60
Standard Error 4.81
Median 6.47
Mode #N/A
Standard Deviation 22.03
Sample Variance
485.3
7
Kurtosis 2.88
Skewness 1.10
Range
102.9
5
Minimum -28.23
Maximum 74.72
Sum 201.5
⊘ This is a preview!⊘
Do you want full access?
Subscribe today to unlock all pages.
Trusted by 1+ million students worldwide
9MACROECONOMIC PERFORMANCE OF AUSTRALIA AND USA
5
Count 21
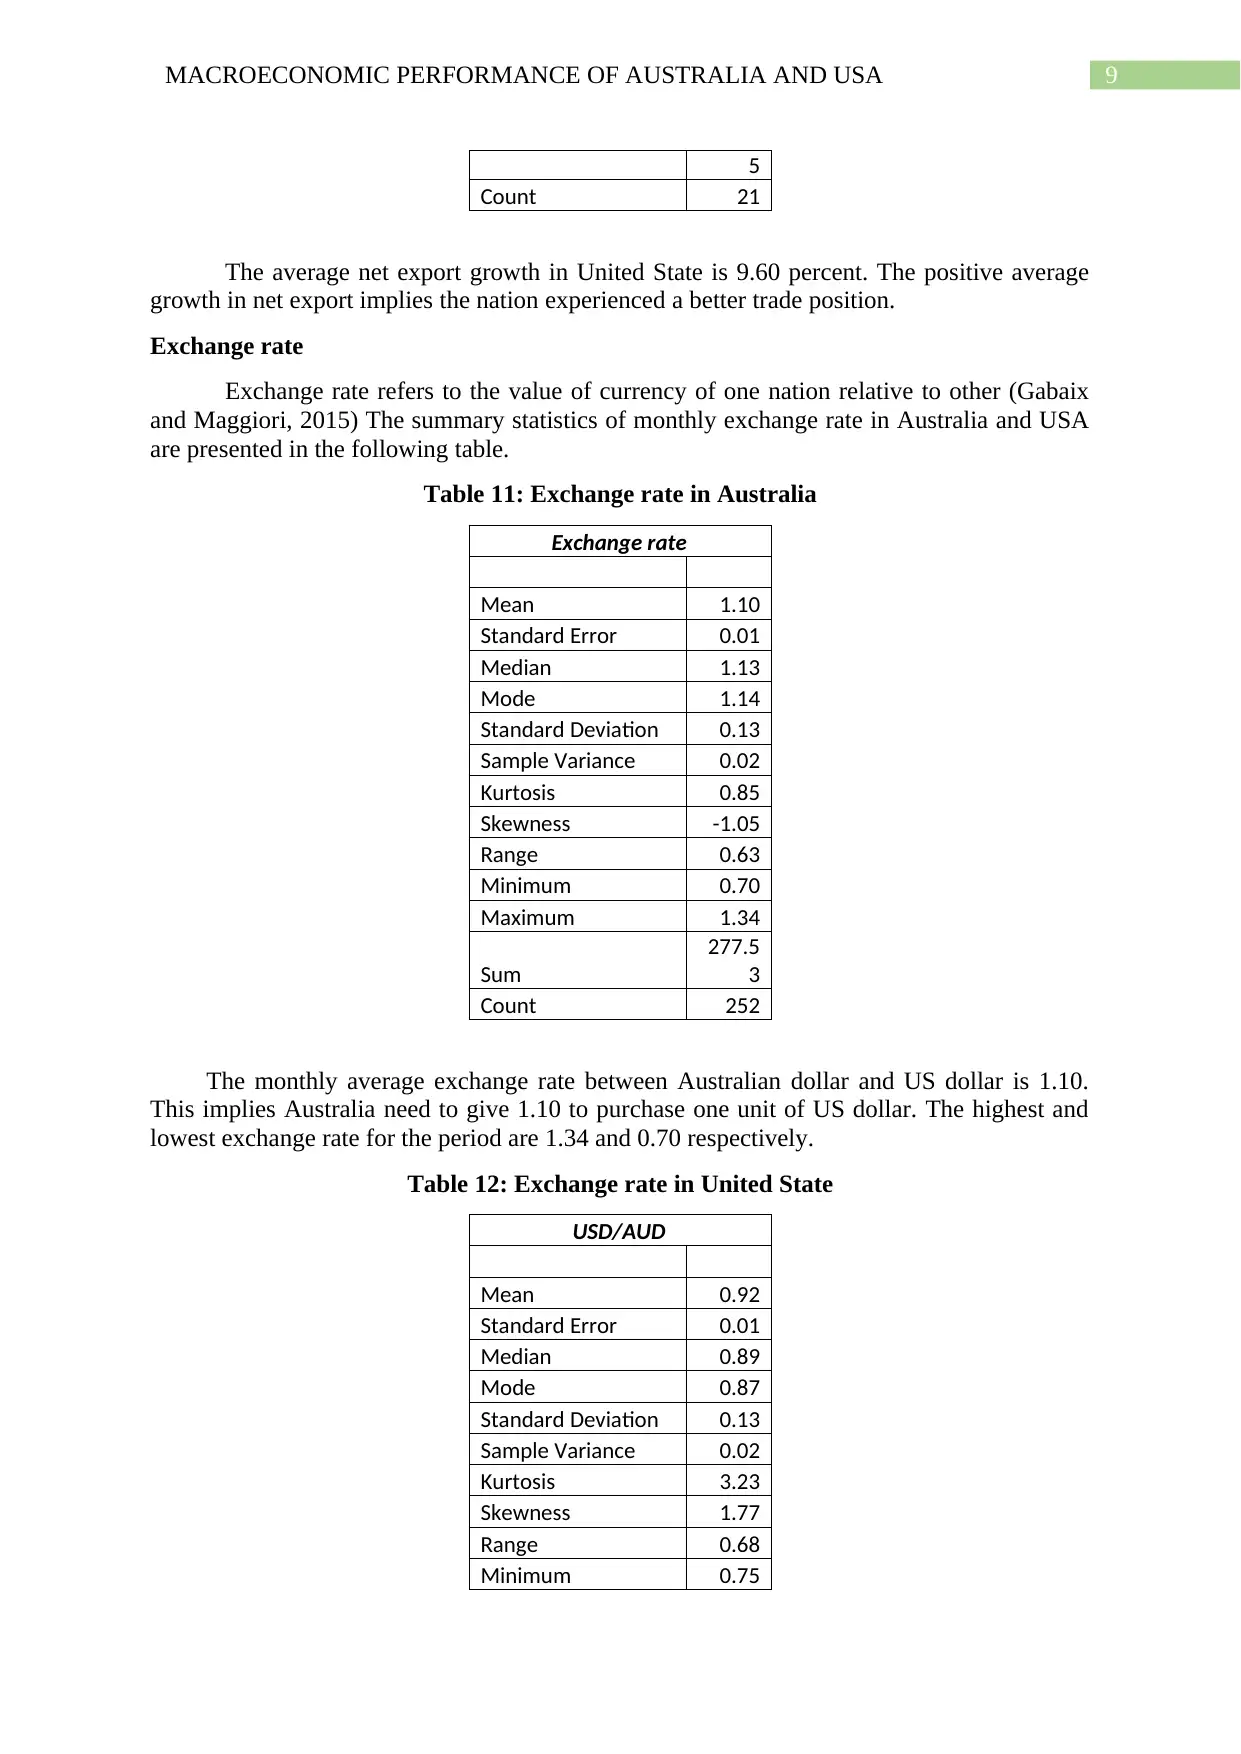
The average net export growth in United State is 9.60 percent. The positive average
growth in net export implies the nation experienced a better trade position.
Exchange rate
Exchange rate refers to the value of currency of one nation relative to other (Gabaix
and Maggiori, 2015) The summary statistics of monthly exchange rate in Australia and USA
are presented in the following table.
Table 11: Exchange rate in Australia
Exchange rate
Mean 1.10
Standard Error 0.01
Median 1.13
Mode 1.14
Standard Deviation 0.13
Sample Variance 0.02
Kurtosis 0.85
Skewness -1.05
Range 0.63
Minimum 0.70
Maximum 1.34
Sum
277.5
3
Count 252
The monthly average exchange rate between Australian dollar and US dollar is 1.10.
This implies Australia need to give 1.10 to purchase one unit of US dollar. The highest and
lowest exchange rate for the period are 1.34 and 0.70 respectively.
Table 12: Exchange rate in United State
USD/AUD
Mean 0.92
Standard Error 0.01
Median 0.89
Mode 0.87
Standard Deviation 0.13
Sample Variance 0.02
Kurtosis 3.23
Skewness 1.77
Range 0.68
Minimum 0.75
5
Count 21
The average net export growth in United State is 9.60 percent. The positive average
growth in net export implies the nation experienced a better trade position.
Exchange rate
Exchange rate refers to the value of currency of one nation relative to other (Gabaix
and Maggiori, 2015) The summary statistics of monthly exchange rate in Australia and USA
are presented in the following table.
Table 11: Exchange rate in Australia
Exchange rate
Mean 1.10
Standard Error 0.01
Median 1.13
Mode 1.14
Standard Deviation 0.13
Sample Variance 0.02
Kurtosis 0.85
Skewness -1.05
Range 0.63
Minimum 0.70
Maximum 1.34
Sum
277.5
3
Count 252
The monthly average exchange rate between Australian dollar and US dollar is 1.10.
This implies Australia need to give 1.10 to purchase one unit of US dollar. The highest and
lowest exchange rate for the period are 1.34 and 0.70 respectively.
Table 12: Exchange rate in United State
USD/AUD
Mean 0.92
Standard Error 0.01
Median 0.89
Mode 0.87
Standard Deviation 0.13
Sample Variance 0.02
Kurtosis 3.23
Skewness 1.77
Range 0.68
Minimum 0.75
Paraphrase This Document
Need a fresh take? Get an instant paraphrase of this document with our AI Paraphraser
10MACROECONOMIC PERFORMANCE OF AUSTRALIA AND USA
Maximum 1.43
Sum
232.7
2
Count 252
The average monthly exchange rate for US dollar against Australian dollar is 0.92.
This implies USA on an average need to exchange 0.92 USD for one unit of AUD. The
highest and lowest exchange rate for the period are 1.43 and 0.75 respectively.
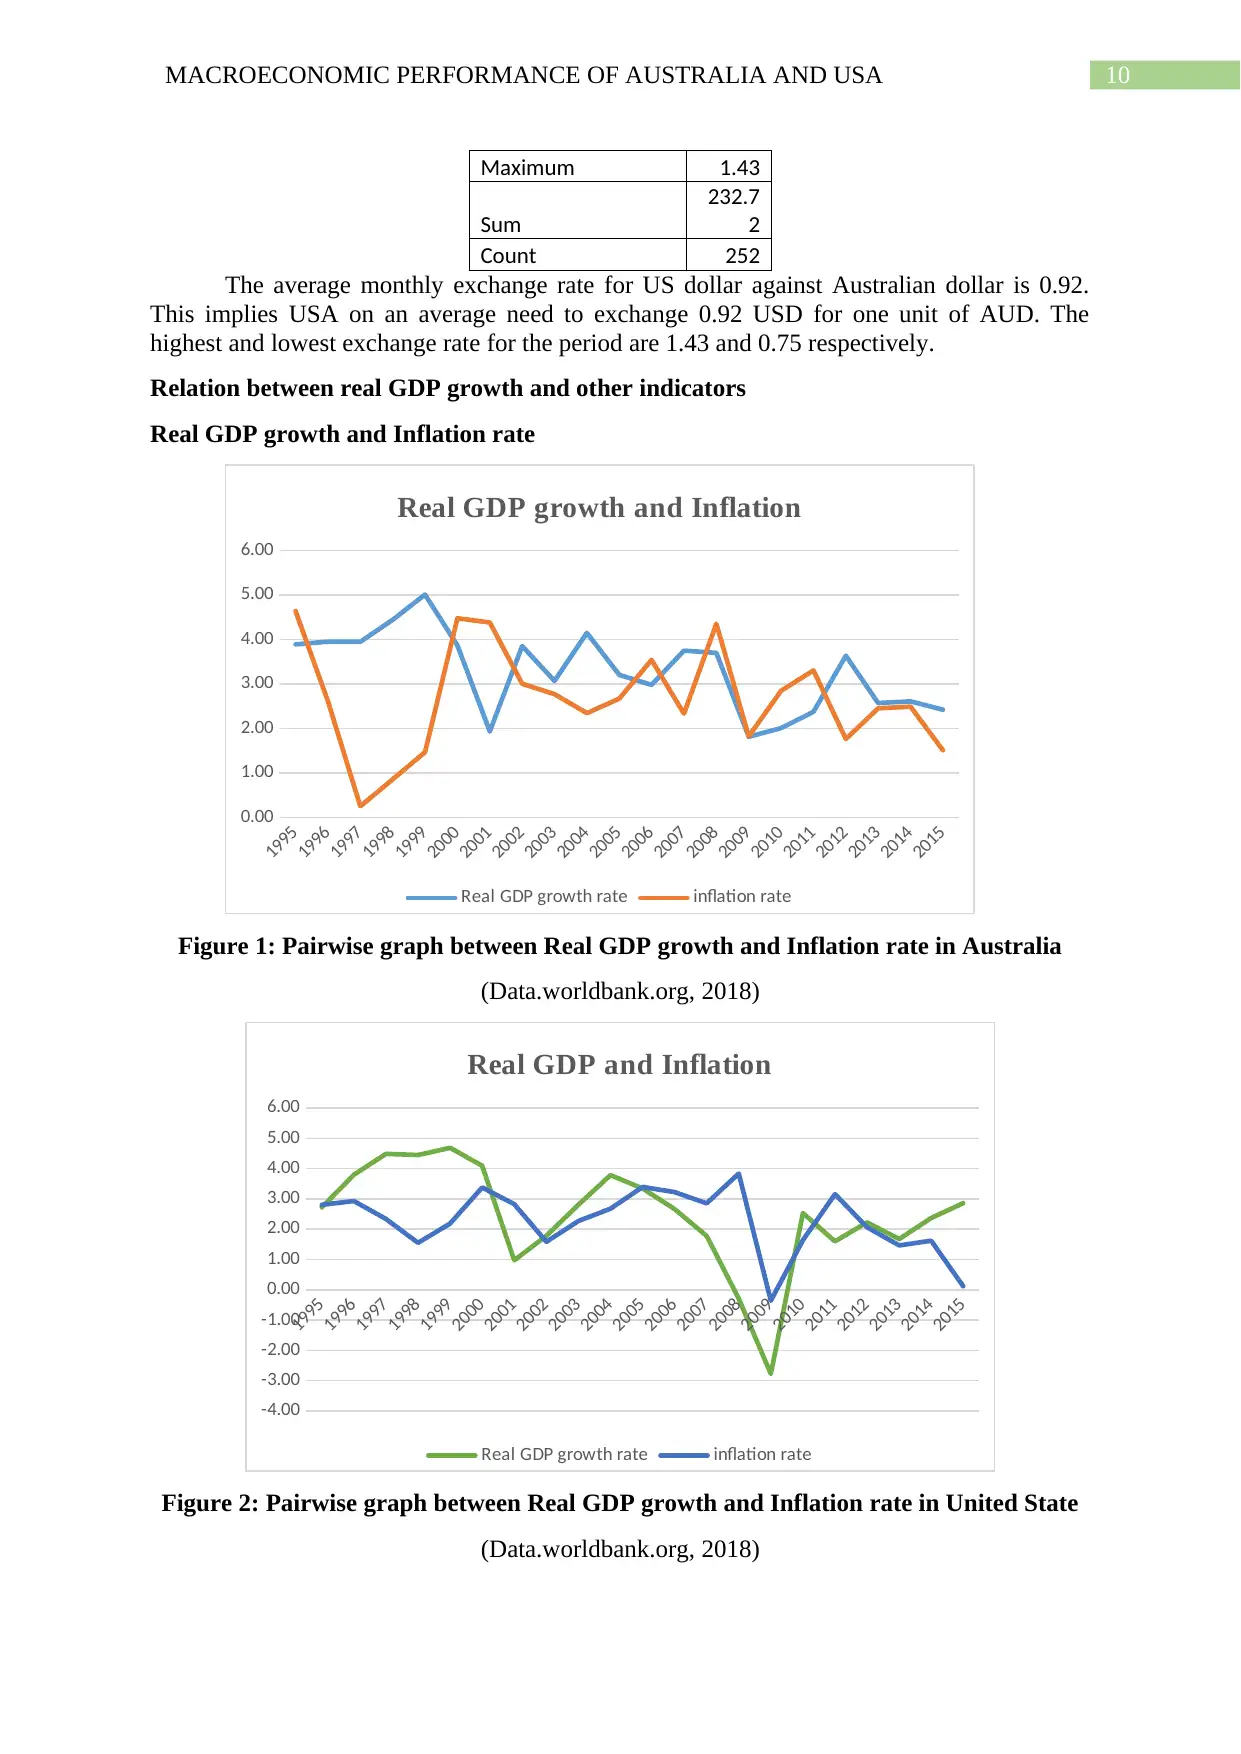
Relation between real GDP growth and other indicators
Real GDP growth and Inflation rate
1995
1996
1997
1998
1999
2000
2001
2002
2003
2004
2005
2006
2007
2008
2009
2010
2011
2012
2013
2014
2015
0.00
1.00
2.00
3.00
4.00
5.00
6.00
Real GDP growth and Inflation
Real GDP growth rate inflation rate
Figure 1: Pairwise graph between Real GDP growth and Inflation rate in Australia
(Data.worldbank.org, 2018)
1995
1996
1997
1998
1999
2000
2001
2002
2003
2004
2005
2006
2007
2008
2009
2010
2011
2012
2013
2014
2015
-4.00
-3.00
-2.00
-1.00
0.00
1.00
2.00
3.00
4.00
5.00
6.00
Real GDP and Inflation
Real GDP growth rate inflation rate
Figure 2: Pairwise graph between Real GDP growth and Inflation rate in United State
(Data.worldbank.org, 2018)
Maximum 1.43
Sum
232.7
2
Count 252
The average monthly exchange rate for US dollar against Australian dollar is 0.92.
This implies USA on an average need to exchange 0.92 USD for one unit of AUD. The
highest and lowest exchange rate for the period are 1.43 and 0.75 respectively.
Relation between real GDP growth and other indicators
Real GDP growth and Inflation rate
1995
1996
1997
1998
1999
2000
2001
2002
2003
2004
2005
2006
2007
2008
2009
2010
2011
2012
2013
2014
2015
0.00
1.00
2.00
3.00
4.00
5.00
6.00
Real GDP growth and Inflation
Real GDP growth rate inflation rate
Figure 1: Pairwise graph between Real GDP growth and Inflation rate in Australia
(Data.worldbank.org, 2018)
1995
1996
1997
1998
1999
2000
2001
2002
2003
2004
2005
2006
2007
2008
2009
2010
2011
2012
2013
2014
2015
-4.00
-3.00
-2.00
-1.00
0.00
1.00
2.00
3.00
4.00
5.00
6.00
Real GDP and Inflation
Real GDP growth rate inflation rate
Figure 2: Pairwise graph between Real GDP growth and Inflation rate in United State
(Data.worldbank.org, 2018)

11MACROECONOMIC PERFORMANCE OF AUSTRALIA AND USA
⊘ This is a preview!⊘
Do you want full access?
Subscribe today to unlock all pages.
Trusted by 1+ million students worldwide
1 out of 21
Related Documents


Your All-in-One AI-Powered Toolkit for Academic Success.
+13062052269
info@desklib.com
Available 24*7 on WhatsApp / Email
![[object Object]](/_next/static/media/star-bottom.7253800d.svg)
Unlock your academic potential
Copyright © 2020–2026 A2Z Services. All Rights Reserved. Developed and managed by ZUCOL.