Analysis of Macroeconomic Performance: Australia vs USA (1985-2015)
VerifiedAdded on 2020/04/01
|16
|2914
|68
Report
AI Summary
This report provides a comparative analysis of the macroeconomic performance of Australia and the USA from 1985 to 2015, focusing on key indicators such as real GDP growth, yearly exchange rate movements, net exports growth rate, and real interest rates. The study aims to determine the extent to which the Australian economy is influenced by changes in the USA's real GDP, considering that both countries are significant trading partners. The report examines these factors over a thirty-year period, using data from the World Bank, and divides the period into three distinct segments to observe the trends. The findings suggest that while both economies are affected by global events, the Australian economy demonstrates a degree of independence from the fluctuations in the USA's GDP, particularly during periods of recession and negative export rates in the USA. The report concludes by highlighting the discrete GDP trends, exchange rate impacts, export patterns, and interest rate dynamics of both countries. The report offers a detailed overview of the economic relationship between the two nations.
Running head: EVALUATION OF MACROECONOMIC PERFORMANCE
EVALUATION OF MACROECONOMIC PERFORMANCE OF AUSTRALIA AND USA
Name of student:
Name of University:
Author note:
EVALUATION OF MACROECONOMIC PERFORMANCE OF AUSTRALIA AND USA
Name of student:
Name of University:
Author note:
Paraphrase This Document
Need a fresh take? Get an instant paraphrase of this document with our AI Paraphraser
Running head: EVALUATION OF MACROECONOMIC PERFORMANCE
Executive summary
This report on Australian economy and USA economy shows that Australia is not
affected by changes occurred in USA. For assessing the result this report considered period
from 1985 to 2015 and focused on domains that are GDP, interest rate, net export and
exchange rate. Result from these domains shows that Australia is not being affected by USA
economy. Although both countries performance are being affected by global events which in
turn affected the performance of the both economies.
Running head: EVALUATION OF MACROECONOMIC PERFORMANCE
Table of Contents
Introduction.............................................................................................................5
Discussion................................................................................................................ 6
Real GDP growth of Australia and USA.................................................................7
Yearly Exchange rate movement in Australia and USA.........................................9
Net Exports growth rate of Australia and USA....................................................11
Real Interest rate of Australia and USA..............................................................13
Conclusion..............................................................................................................15
References.............................................................................................................16
⊘ This is a preview!⊘
Do you want full access?
Subscribe today to unlock all pages.
Trusted by 1+ million students worldwide
Running head: EVALUATION OF MACROECONOMIC PERFORMANCE
Introduction
Australian economy is a developed economy and it stands as one of the largest
economy in the world. Australia also considered as one of the wealthiest nation in the world.
The economy considered as 14th largest in terms of national GDP, 20th largest with respect to
purchasing power parity and 25th largest as exporter of goods and finally 20th largest with
respect to importer of goods. Australian economy previously was dominated by mining sector
and the reason was due to large level of availability of natural resources and this availability due
to location of the economy, but over the years the scenario changed the economy which was
run by the mining sector, now dominated by the service sector and this was due to decline in
mining sector (Downes, Hanslow and Tulip, 2014).
USA economy is considered as world’s largest economy. In terms of purchasing power
parity economy stands in the second position .In terms of GDP economy is 7th highest with
compared to other nations. Economy of USA is a mixed one and has maintained GDP with
stability over the past decades. With respect to availability of natural resources the economy
stands in highest position. Production level of the economy is also high for which economy has
been able to achieve its desired goal over the years (Summers, 2014).
Now if the economy of Australia is compared to USA then a rigid result can be obtained
regarding in their terms of growth. The aim of this report is to explore whether Australian
economy changes due to changes in USA’s real GDP. The reason behind investigating this kind
of study because Australia and USA are trading economies and trade with each other, however
Paraphrase This Document
Need a fresh take? Get an instant paraphrase of this document with our AI Paraphraser
Running head: EVALUATION OF MACROECONOMIC PERFORMANCE
Australian economy is much smaller than USA. Yet the study is a relevant one because both
economies are very important to be researched.
The study mainly aims to compare and contrast and evaluate the results obtained. For
comparing the two economies, some of the significant factors are considered in this study they
are related to real GDP growth rates, yearly exchange rate movements, net exports growth rate
and interest rate. After comparing these factors of both economies they are evaluated to reach
the result.
Discussion
Over the years Australian economy and USA economy has changed a lot. With respect
to development, both economies have shown development in terms of various indicators and
these indicators in turn have shown its impact on countries development process. With
development, both economies have participated in trade with each country which has
contributed towards the growth of each economy. Both economies are diversified one as they
comprises of both negative and positive side. Back in 1945 U.S proposed a free trade
agreement to Australia. Later, in 1980 both the countries initiated free trade agreement. Free
trade agreement lays conditions regarding types of goods to be traded that are subject to non
discretionary treatment.
The purpose of this report is to provide an understanding of Australian economy if
affected due to changes in real GDP of USA. Time period chosen for this report is 1985 to 2015.
To reach the result four aspects are considered and detailed study is provided below.
Running head: EVALUATION OF MACROECONOMIC PERFORMANCE
Real GDP growth of Australia and USA
GDP growth rate generally shows the economy’s growing pattern. This pattern is
measured by comparing one quarter of country’s GDP to its previous quarter. GDP mainly
comprises of four components and these four components are – personal consumption and this
includes retail sales, the second component is business investment and it includes construction
and inventory levels, the third component is the government spending and it is largest
categories include social security, Medicare benefits and defense spending and finally last and
the fourth component is net trade which shows import and export of goods and services
(Gordon, 2012).
Growth rate of GDP is regarded as an important indicator of economic health. This rate
is sensitive to four phases of business cycle which incorporates: expansion, peak, contraction
and trough. Thus considering GDP growth rate gives significant insights about the results that
are required for this particular study.
The GDP growth rate of Australia and USA is considered over the period from 1985 to
2015. Various events happened in both the countries during this period and these events
affected the GDP growth rate in a significant way. The graph is plotted by considering dataset
from World Bank reports. Time period used is specific as it will show the impact of GDP growth
of both the economies in clear way. This time gap of thirty years is quite significant to capture
the effect.
⊘ This is a preview!⊘
Do you want full access?
Subscribe today to unlock all pages.
Trusted by 1+ million students worldwide
Running head: EVALUATION OF MACROECONOMIC PERFORMANCE
1985
1988
1991
1994
1997
2000
2003
2006
2009
2012
2015
-4
-2
0
2
4
6
8
Australia(GDP growth %)
USA(GDP growth %)
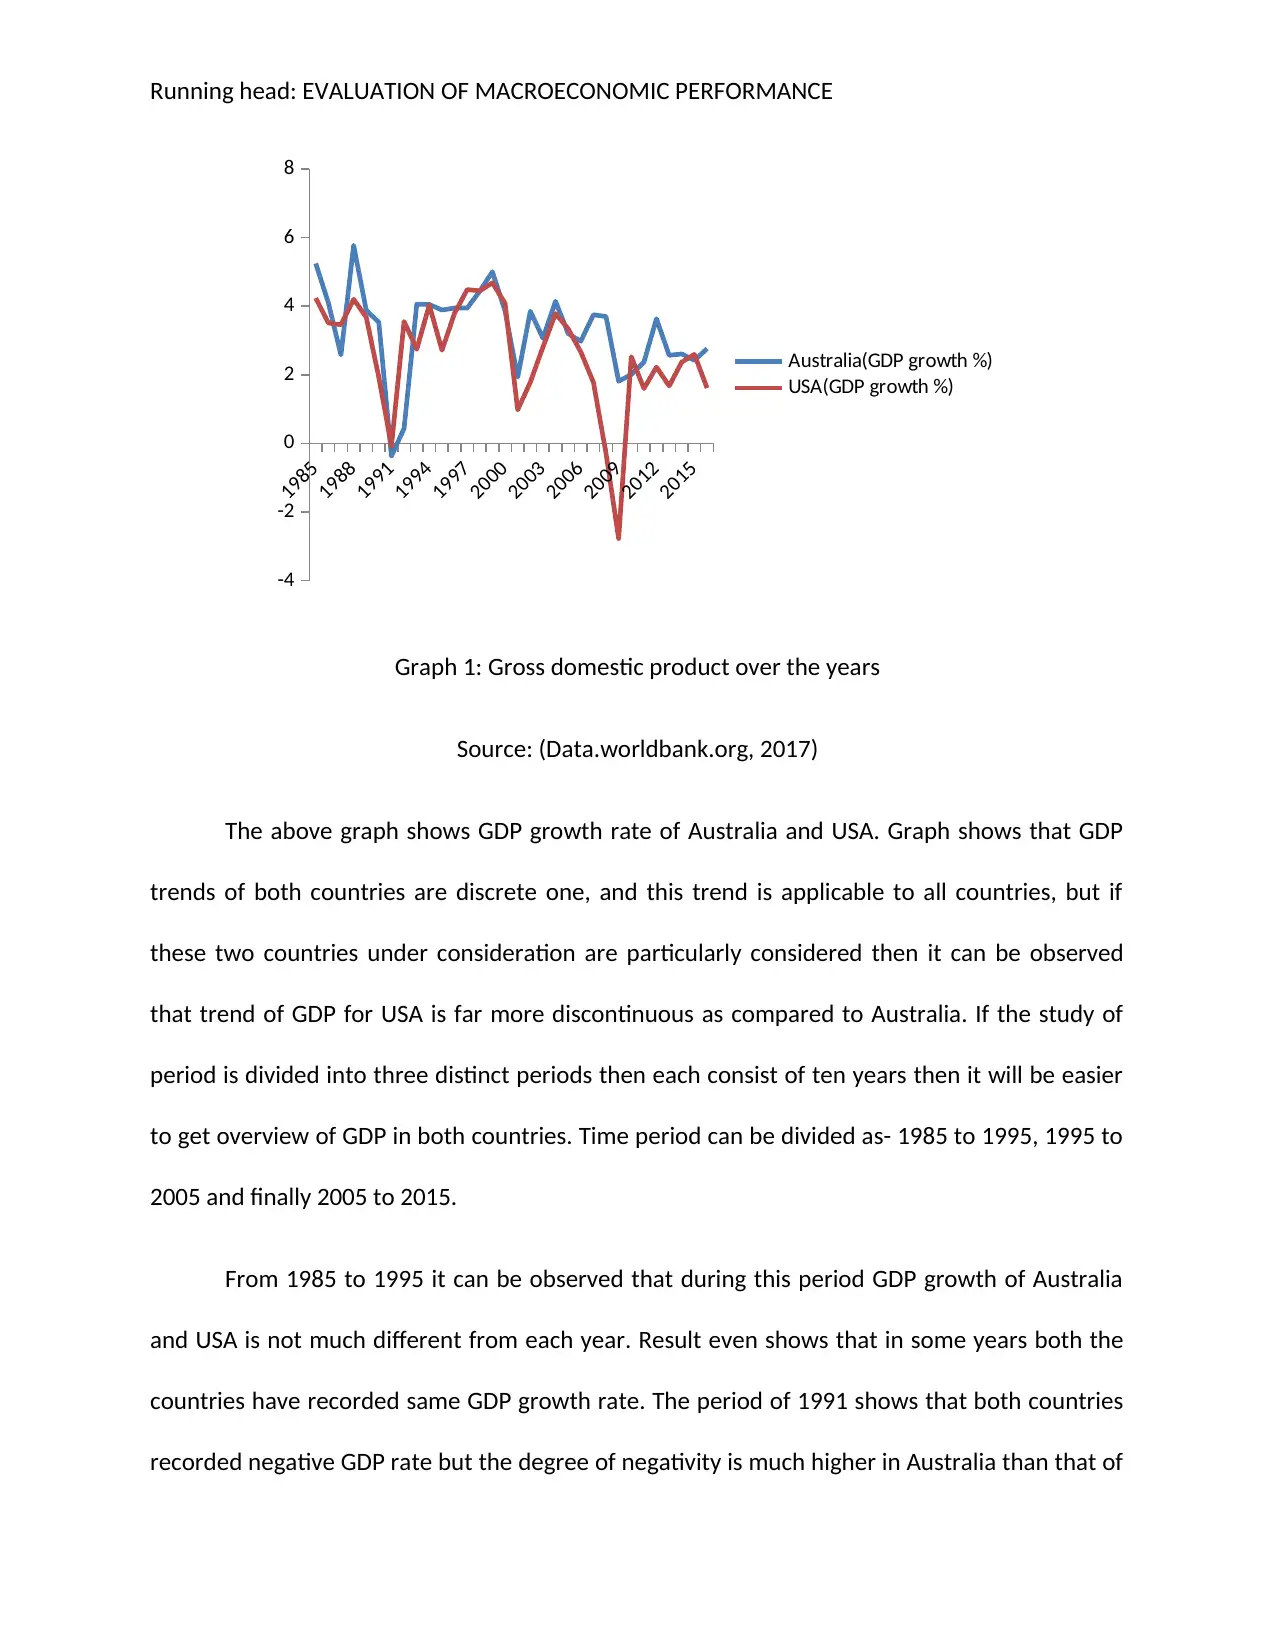
Graph 1: Gross domestic product over the years
Source: (Data.worldbank.org, 2017)
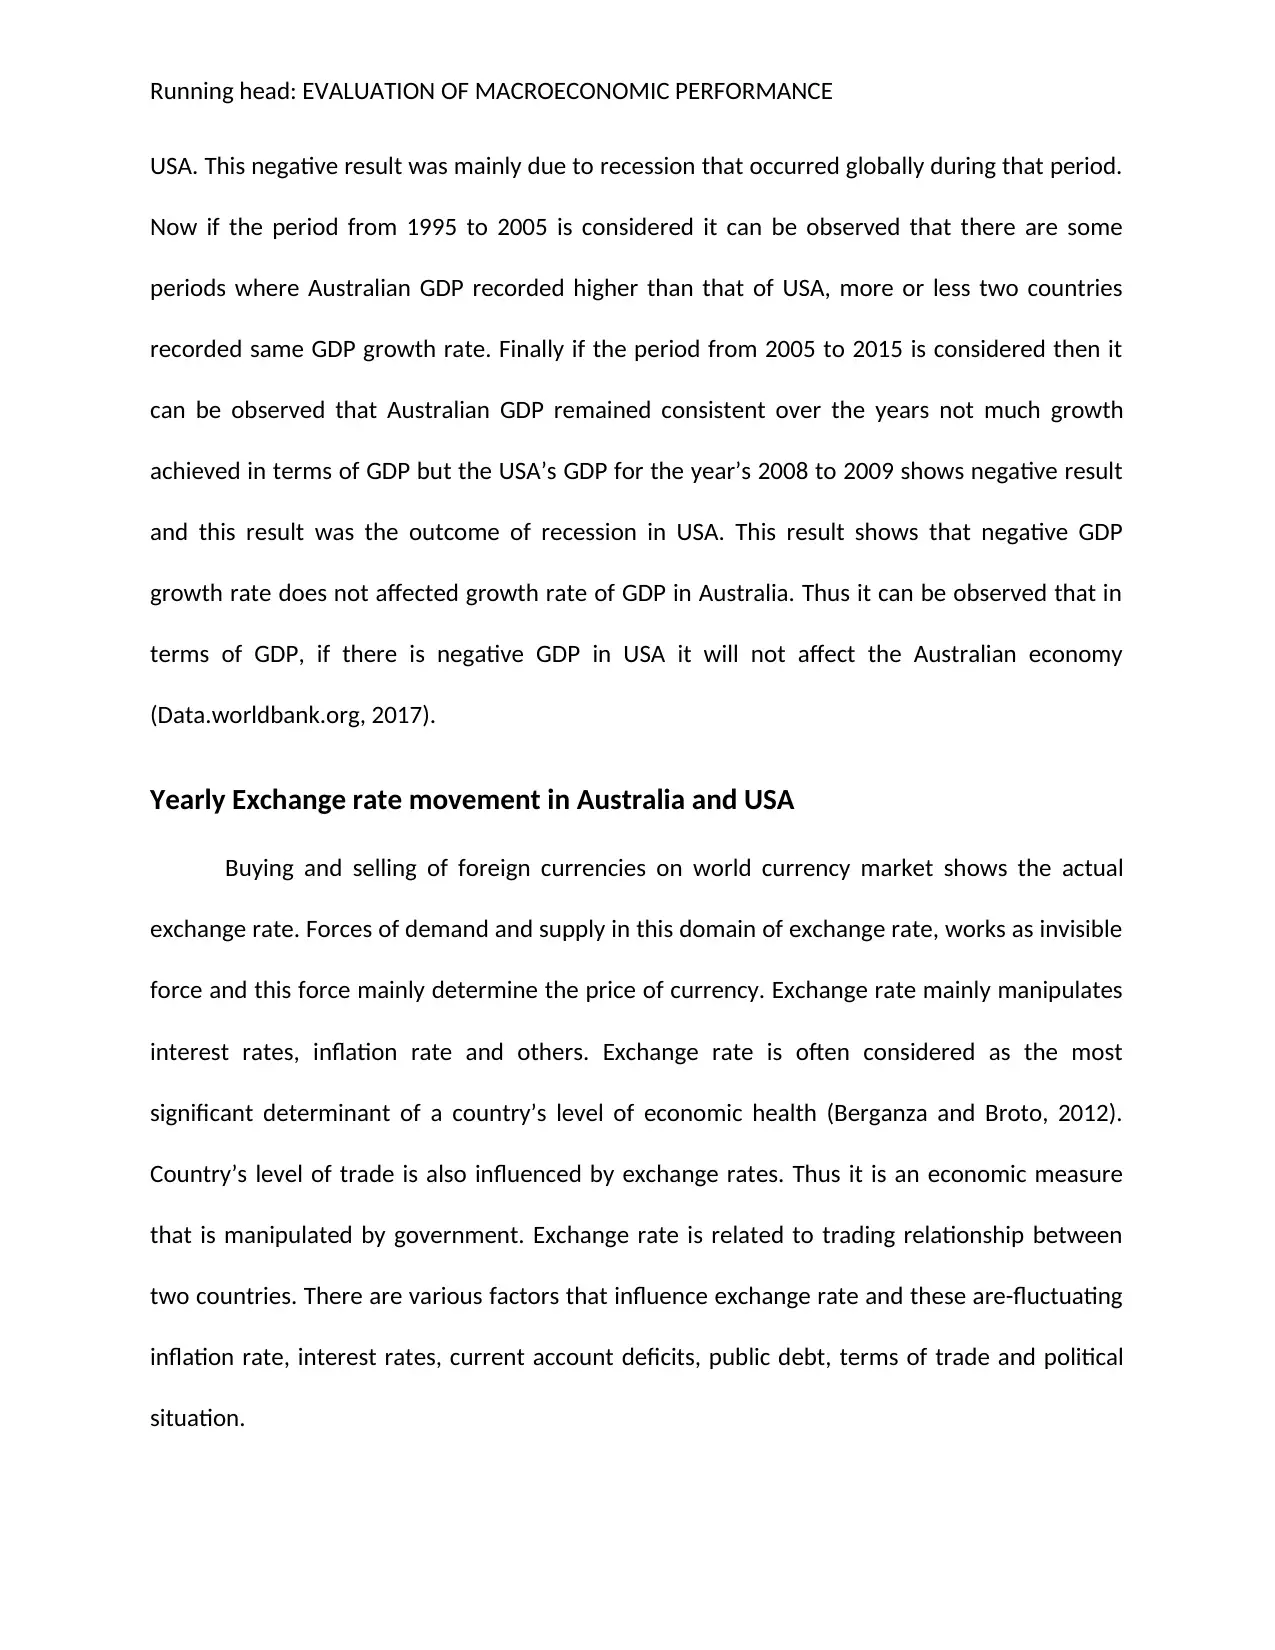
The above graph shows GDP growth rate of Australia and USA. Graph shows that GDP
trends of both countries are discrete one, and this trend is applicable to all countries, but if
these two countries under consideration are particularly considered then it can be observed
that trend of GDP for USA is far more discontinuous as compared to Australia. If the study of
period is divided into three distinct periods then each consist of ten years then it will be easier
to get overview of GDP in both countries. Time period can be divided as- 1985 to 1995, 1995 to
2005 and finally 2005 to 2015.
From 1985 to 1995 it can be observed that during this period GDP growth of Australia
and USA is not much different from each year. Result even shows that in some years both the
countries have recorded same GDP growth rate. The period of 1991 shows that both countries
recorded negative GDP rate but the degree of negativity is much higher in Australia than that of
1985
1988
1991
1994
1997
2000
2003
2006
2009
2012
2015
-4
-2
0
2
4
6
8
Australia(GDP growth %)
USA(GDP growth %)
Graph 1: Gross domestic product over the years
Source: (Data.worldbank.org, 2017)
The above graph shows GDP growth rate of Australia and USA. Graph shows that GDP
trends of both countries are discrete one, and this trend is applicable to all countries, but if
these two countries under consideration are particularly considered then it can be observed
that trend of GDP for USA is far more discontinuous as compared to Australia. If the study of
period is divided into three distinct periods then each consist of ten years then it will be easier
to get overview of GDP in both countries. Time period can be divided as- 1985 to 1995, 1995 to
2005 and finally 2005 to 2015.
From 1985 to 1995 it can be observed that during this period GDP growth of Australia
and USA is not much different from each year. Result even shows that in some years both the
countries have recorded same GDP growth rate. The period of 1991 shows that both countries
recorded negative GDP rate but the degree of negativity is much higher in Australia than that of
Paraphrase This Document
Need a fresh take? Get an instant paraphrase of this document with our AI Paraphraser
Running head: EVALUATION OF MACROECONOMIC PERFORMANCE
USA. This negative result was mainly due to recession that occurred globally during that period.
Now if the period from 1995 to 2005 is considered it can be observed that there are some
periods where Australian GDP recorded higher than that of USA, more or less two countries
recorded same GDP growth rate. Finally if the period from 2005 to 2015 is considered then it
can be observed that Australian GDP remained consistent over the years not much growth
achieved in terms of GDP but the USA’s GDP for the year’s 2008 to 2009 shows negative result
and this result was the outcome of recession in USA. This result shows that negative GDP
growth rate does not affected growth rate of GDP in Australia. Thus it can be observed that in
terms of GDP, if there is negative GDP in USA it will not affect the Australian economy
(Data.worldbank.org, 2017).
Yearly Exchange rate movement in Australia and USA
Buying and selling of foreign currencies on world currency market shows the actual
exchange rate. Forces of demand and supply in this domain of exchange rate, works as invisible
force and this force mainly determine the price of currency. Exchange rate mainly manipulates
interest rates, inflation rate and others. Exchange rate is often considered as the most
significant determinant of a country’s level of economic health (Berganza and Broto, 2012).
Country’s level of trade is also influenced by exchange rates. Thus it is an economic measure
that is manipulated by government. Exchange rate is related to trading relationship between
two countries. There are various factors that influence exchange rate and these are-fluctuating
inflation rate, interest rates, current account deficits, public debt, terms of trade and political
situation.
Running head: EVALUATION OF MACROECONOMIC PERFORMANCE
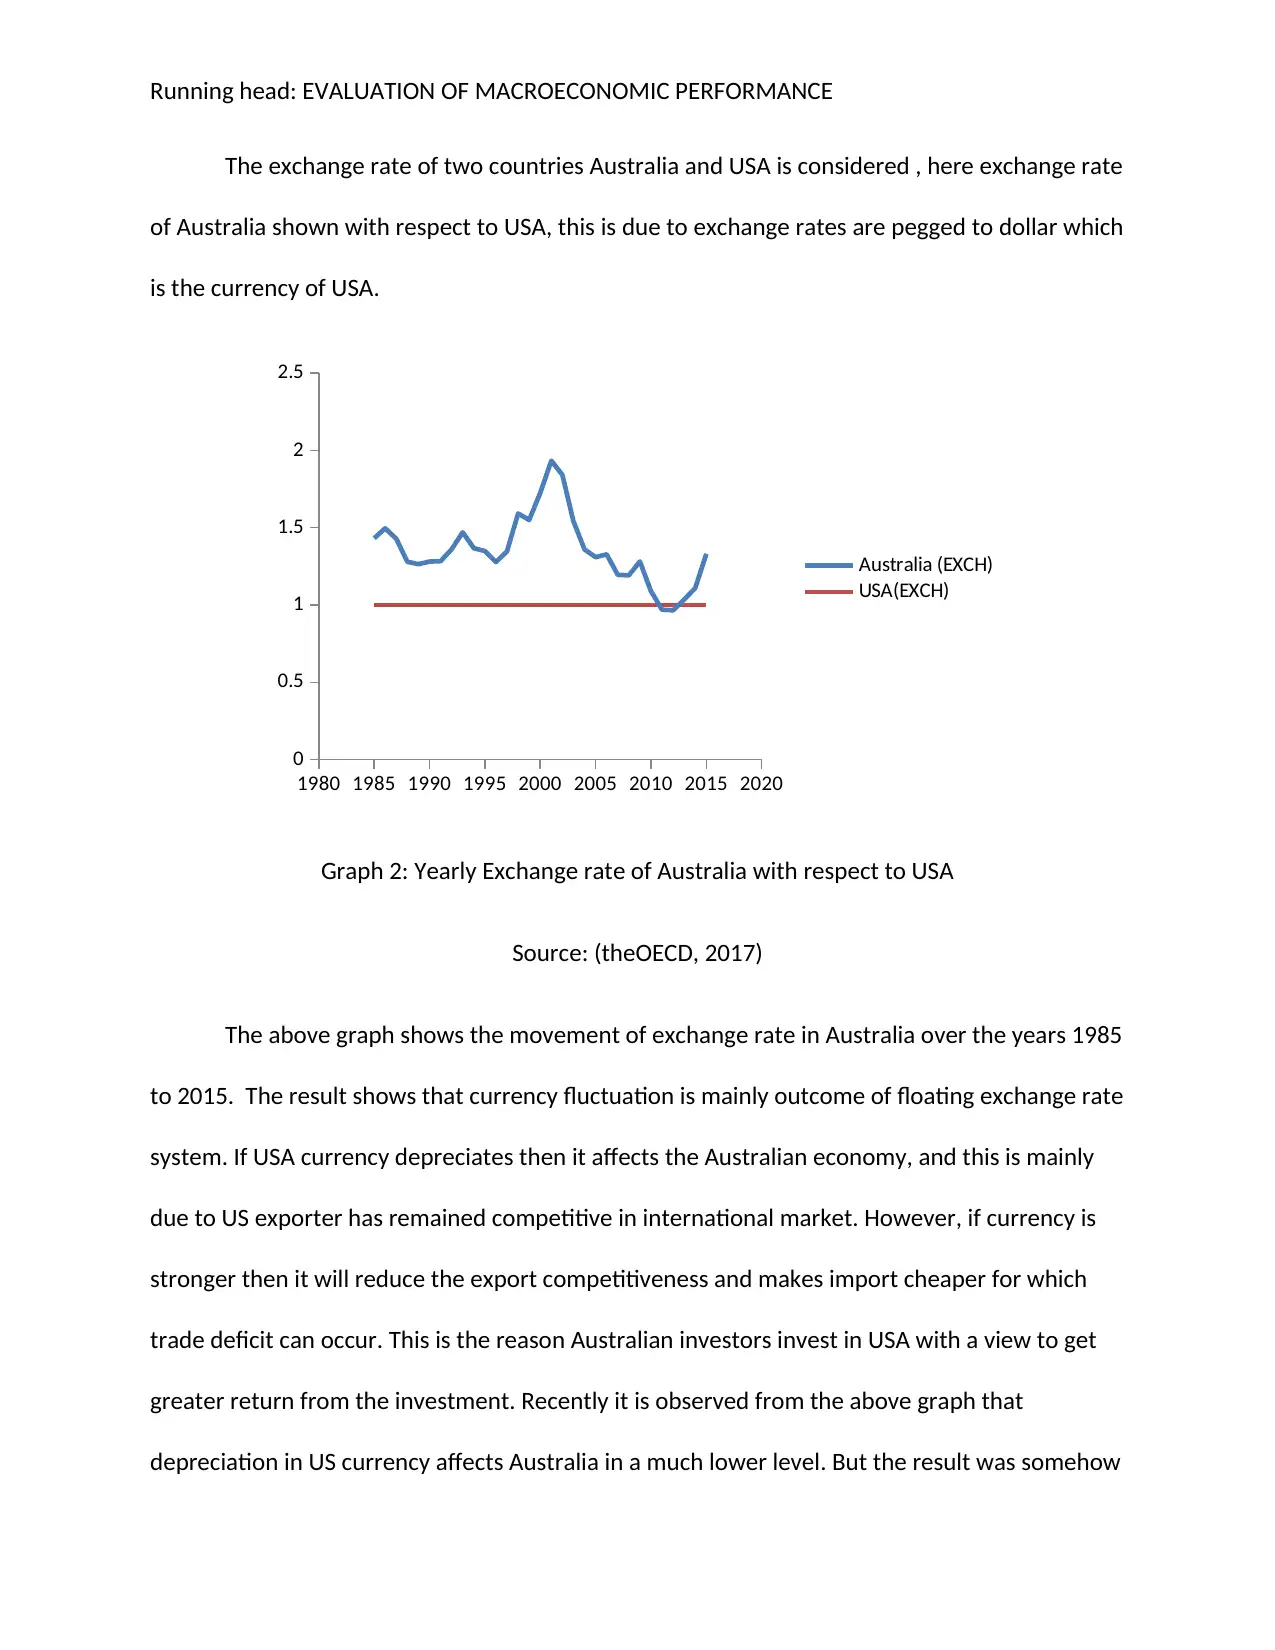
The exchange rate of two countries Australia and USA is considered , here exchange rate
of Australia shown with respect to USA, this is due to exchange rates are pegged to dollar which
is the currency of USA.
1980 1985 1990 1995 2000 2005 2010 2015 2020
0
0.5
1
1.5
2
2.5
Australia (EXCH)
USA(EXCH)
Graph 2: Yearly Exchange rate of Australia with respect to USA
Source: (theOECD, 2017)
The above graph shows the movement of exchange rate in Australia over the years 1985
to 2015. The result shows that currency fluctuation is mainly outcome of floating exchange rate
system. If USA currency depreciates then it affects the Australian economy, and this is mainly
due to US exporter has remained competitive in international market. However, if currency is
stronger then it will reduce the export competitiveness and makes import cheaper for which
trade deficit can occur. This is the reason Australian investors invest in USA with a view to get
greater return from the investment. Recently it is observed from the above graph that
depreciation in US currency affects Australia in a much lower level. But the result was somehow
⊘ This is a preview!⊘
Do you want full access?
Subscribe today to unlock all pages.
Trusted by 1+ million students worldwide
Running head: EVALUATION OF MACROECONOMIC PERFORMANCE
much critical back in the 2001, the value of Australian dollar went below US 50 cents. Thus this
depreciation allows foreign currencies to buy more goods from Australia. Australian consumers
pay more for imported goods. As a result foreign investment also falls in Australia. With an
appreciating currency Australia's exports become comparatively more expensive to foreign
buyers.
Net Exports growth rate of Australia and USA
Exports play an important role in any economy; it mainly influences the level of
economic growth and balance of payments. Exports volume over the years have increased and
this is due to lower transport cost, post globalization, post war period, economies of scale and
reduction in tariff. Export is important for country because it helps several other factors to
stabilize the loss of degree. In the domain of employment, economic growth and current
account deficit, export helps a lot to overcome the problems faced by these domains
(Eichengreen and Gupta, 2013).
Considering the export data of Australia and USA, an overview of both the economies
can be obtained from 1985 to 2015.
Paraphrase This Document
Need a fresh take? Get an instant paraphrase of this document with our AI Paraphraser
Running head: EVALUATION OF MACROECONOMIC PERFORMANCE
1985
1988
1991
1994
1997
2000
2003
2006
2009
2012
2015
-10
-5
0
5
10
15
20
25
30
USA(Export of goods and
services)
Australia(Export of goods
and services)
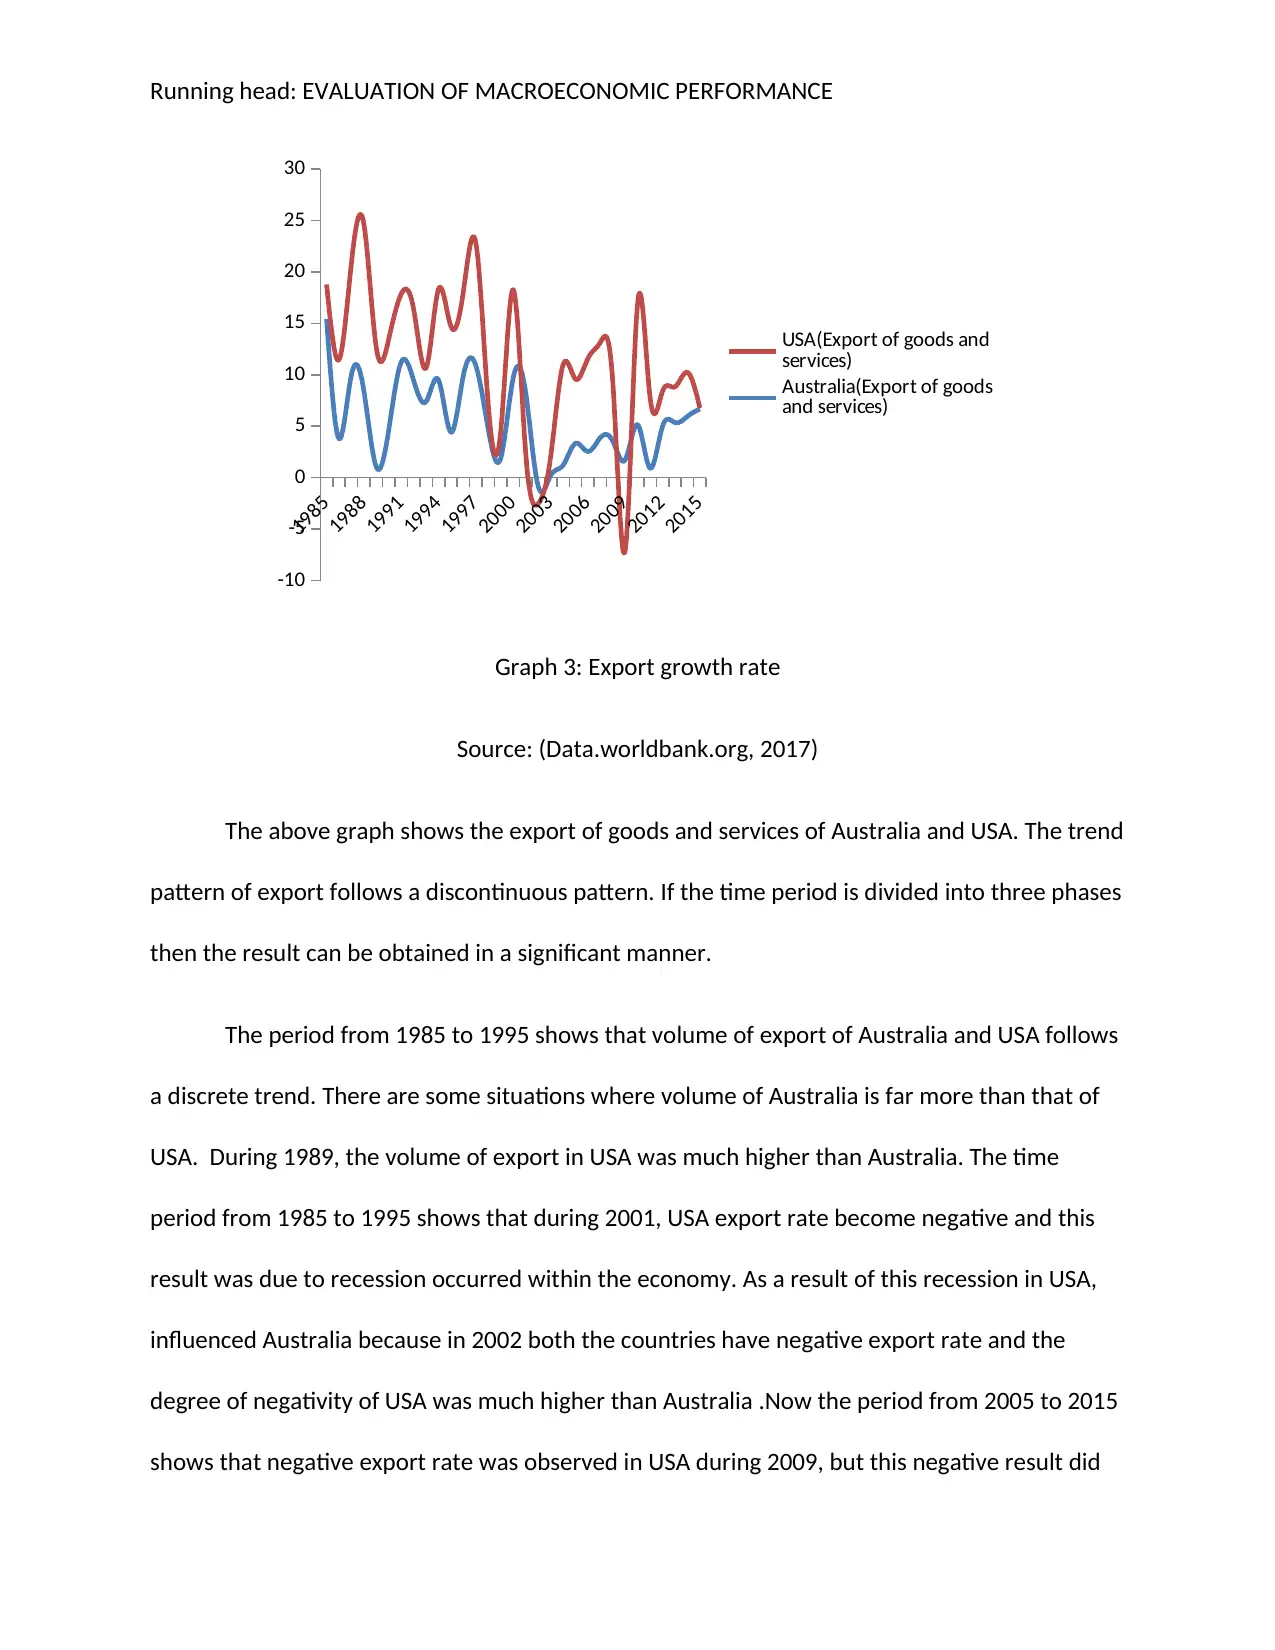
Graph 3: Export growth rate
Source: (Data.worldbank.org, 2017)
The above graph shows the export of goods and services of Australia and USA. The trend
pattern of export follows a discontinuous pattern. If the time period is divided into three phases
then the result can be obtained in a significant manner.
The period from 1985 to 1995 shows that volume of export of Australia and USA follows
a discrete trend. There are some situations where volume of Australia is far more than that of
USA. During 1989, the volume of export in USA was much higher than Australia. The time
period from 1985 to 1995 shows that during 2001, USA export rate become negative and this
result was due to recession occurred within the economy. As a result of this recession in USA,
influenced Australia because in 2002 both the countries have negative export rate and the
degree of negativity of USA was much higher than Australia .Now the period from 2005 to 2015
shows that negative export rate was observed in USA during 2009, but this negative result did
1985
1988
1991
1994
1997
2000
2003
2006
2009
2012
2015
-10
-5
0
5
10
15
20
25
30
USA(Export of goods and
services)
Australia(Export of goods
and services)
Graph 3: Export growth rate
Source: (Data.worldbank.org, 2017)
The above graph shows the export of goods and services of Australia and USA. The trend
pattern of export follows a discontinuous pattern. If the time period is divided into three phases
then the result can be obtained in a significant manner.
The period from 1985 to 1995 shows that volume of export of Australia and USA follows
a discrete trend. There are some situations where volume of Australia is far more than that of
USA. During 1989, the volume of export in USA was much higher than Australia. The time
period from 1985 to 1995 shows that during 2001, USA export rate become negative and this
result was due to recession occurred within the economy. As a result of this recession in USA,
influenced Australia because in 2002 both the countries have negative export rate and the
degree of negativity of USA was much higher than Australia .Now the period from 2005 to 2015
shows that negative export rate was observed in USA during 2009, but this negative result did
Running head: EVALUATION OF MACROECONOMIC PERFORMANCE
not effected the Australian basket of export of goods and services as Australia shows positive
growth rate. Thus it can be observed that Australian economy was not much influenced due to
USA negative export rate.
Real Interest rate of Australia and USA
Real interest rate mainly shows the interest rate that an investor, saver and lender
receive after considering the effect of inflation rate. This concept of real interest rate used in
various studies as it determines the phenomena of capital fight, economic bubbles and business
cycle. The change in interest rate effect the consumption and saving pattern and they are
inversely related. Thus, capital revolves around market where the interest rate is high (Rachel
and Smith, 2015).
U.S Federal Reserve construct interest rate at which they provide loan to banks and this
activity is mandatory to set monetary policy. This is the federal fund rate. If this rate is low then
bank encourage borrowing and this in turn increases economic activity.
Now with respect to Australia interest rate is called official cash rate and it is Australian
base rate. A rise or fall in the cash rate leads to a change in the interest rates for loans
mortgages and savings.
Comparison of federal fund rate and cash rate over the years 1985 to 2015 is shown
below.
⊘ This is a preview!⊘
Do you want full access?
Subscribe today to unlock all pages.
Trusted by 1+ million students worldwide
1 out of 16
Related Documents


Your All-in-One AI-Powered Toolkit for Academic Success.
+13062052269
info@desklib.com
Available 24*7 on WhatsApp / Email
![[object Object]](/_next/static/media/star-bottom.7253800d.svg)
Unlock your academic potential
Copyright © 2020–2026 A2Z Services. All Rights Reserved. Developed and managed by ZUCOL.