BUS700 Trimester 3: Macroeconomic Performance of Australia and USA
VerifiedAdded on 2023/04/21
|20
|4878
|83
Report
AI Summary
This report presents a comparative analysis of the macroeconomic performance of Australia and the USA from 1995 to 2015. The study examines key economic indicators including real GDP growth, inflation rates, unemployment rates, interest rates, exchange rates, and net exports for both countries. Summary statistics for each indicator are provided and discussed. The report provides a detailed examination of the economic stability and growth of both nations over the specified period, comparing the trends and fluctuations in each indicator. Furthermore, the report analyzes the macroeconomic policies undertaken in both countries during the period and provides a summary of economic outlook for Australia. The analysis is structured to provide insights into the strengths, weaknesses, and overall economic performance of Australia and the USA, using the collected data to draw conclusions about their respective economic trajectories.
Running head: MACROECONOMIC PERFORMANCE OF AUSTRALIA AND USA
Macroeconomic Performance of Australia and USA
Name of the Student
Name of the University
Student ID
Macroeconomic Performance of Australia and USA
Name of the Student
Name of the University
Student ID
Paraphrase This Document
Need a fresh take? Get an instant paraphrase of this document with our AI Paraphraser
1
MACROECONOMIC PERFORMANCE OF AUSTRALIA AND USA
Executive Summary
The paper intends to analyze economic performance of two of the most developed nations – USA
and Australia. In the world economy, USA though has a dominating global power, the fast growth of
Australia make Australian economy comparable to that of USA. The report compares economic
performance of Australia to that of USA from 1995 to 2015. There are several indicators those are
considered to analyze economic conditions of both nations. These include rate of growth in real
GDP, rate of inflation, unemployment rate, interest rate, growth of net export and exchange rate.
Each of these indicators are related with economic growth rate either directly or indirectly. Design of
macroeconomic policy is crucial in ensuring a stable economic growth. Two main policy measures in
this regard are fiscal policy and monetary policy. Government may take various other policies to
sustain steady economic performance.
2
MACROECONOMIC PERFORMANCE OF AUSTRALIA AND USA
Table of Contents
Introduction...........................................................................................................................................3
Macroeconomic performance of Australia and USA.............................................................................3
Australia............................................................................................................................................4
USA....................................................................................................................................................7
Relation between GDP and other economic indicators.......................................................................10
Australia..........................................................................................................................................10
USA..................................................................................................................................................12
Macroeconomic policies undertaken in Australia and USA.................................................................14
Australia..........................................................................................................................................15
USA..................................................................................................................................................15
Economic outlook for Australia...........................................................................................................15
Conclusion...........................................................................................................................................16
Reference list.......................................................................................................................................17
⊘ This is a preview!⊘
Do you want full access?
Subscribe today to unlock all pages.
Trusted by 1+ million students worldwide
3
MACROECONOMIC PERFORMANCE OF AUSTRALIA AND USA
Introduction
Australia when compared in terms of GDP, ranked second in the world. The economy stands
just behind USA. In the past two decades, Australia successfully maintained a steady growth along
with low inflation and low unemployment. Service sector constitutes a dominating share in the
Australian economy with the share being 70 percent in GDP ad 75 percent in employment. The
steady banking and financial sector has helped the economy to escape from global economic crisis
(Nielsen, 2017) Australia is largely benefitted by a dramatic increase in terms of trade in recent
years. Australia is a leading exporter of energy, natural resource and agricultural commodities.
The USA economy is considered as the highly developed mixed economy. The economy
account world’s largest nominal GDP and second highest purchasing power parity. The economy has
a highly developed and diversified industrial sector. The huge stock of natural resources,
infrastructural facilities and high productivity fueled economic growth of the economy. The great
recession in 2008 caused a huge economic downturn in USA (Reinhart, C.M. and Rogoff, 2015) The
economy took a considerably long time to recover attack of crisis and return to previous growth rate.
The paper prepares a brief report on economic performance of Australia and USA for a
period of twenty-one years from 1995 to 2015.
Macroeconomic performance of Australia and USA
Macroeconomic performances of a nation are evaluated based on some key economic
indicators. Growth of aggregate output is a primary indicator of economic performance. Aggregate
output of a nation is measured in terms of GDP of the nation. Gross Domestic Product or GDP is a
standard measure for computing value of produced in an accounting year. Changes in GDP from one
year to the next is known is growth rate of GDP (Goodwin, et al., 2015). Growth in the aggregate
output is considered as economic growth. GDP growth becomes more accurate measure of
economic growth when aggregate output is valued using market price of a base year. This is then
called real GDP growth rate. The movement of price level is next important determinant of economic
stability. This is examined by observing the trend in inflation rate. Rate of inflation is the percentage
change in the consumer price index which include a certain basket of goods and service necessary
for sustaining everyday life. Steady economic growth and stability in the price level have implication
for labor market (Uribe and Schmitt-Grohe, 2017) State of labor market in an economy is
determined from the trend in unemployment rate. Unemployment refers to an economic condition
of labor where some members of the labor force are unable to find jobs despite active job search.
Real interest rate has implication for investment in the economy. To understand trend in real
interest rate, the paper considers interest rate determined by the central banks of the respective
nations. Two indicator related to degree of openness of a country are exchange rate and net export.
Net export refers to the trade balance in the current account of balance of payment and it obtained
by subtracting values of import from that of export. Higher the value of net export higher is the
economic growth and vice versa (Heijdra, 2017). One important determinant of international trade is
exchange rate between nations. It is unit of one country’s currencies exchanged for unit of another
currency.
This section discusses the summary statistics of above mentioned indicators for the selected
time frame for both Australia and USA.
Paraphrase This Document
Need a fresh take? Get an instant paraphrase of this document with our AI Paraphraser
4
MACROECONOMIC PERFORMANCE OF AUSTRALIA AND USA
Australia
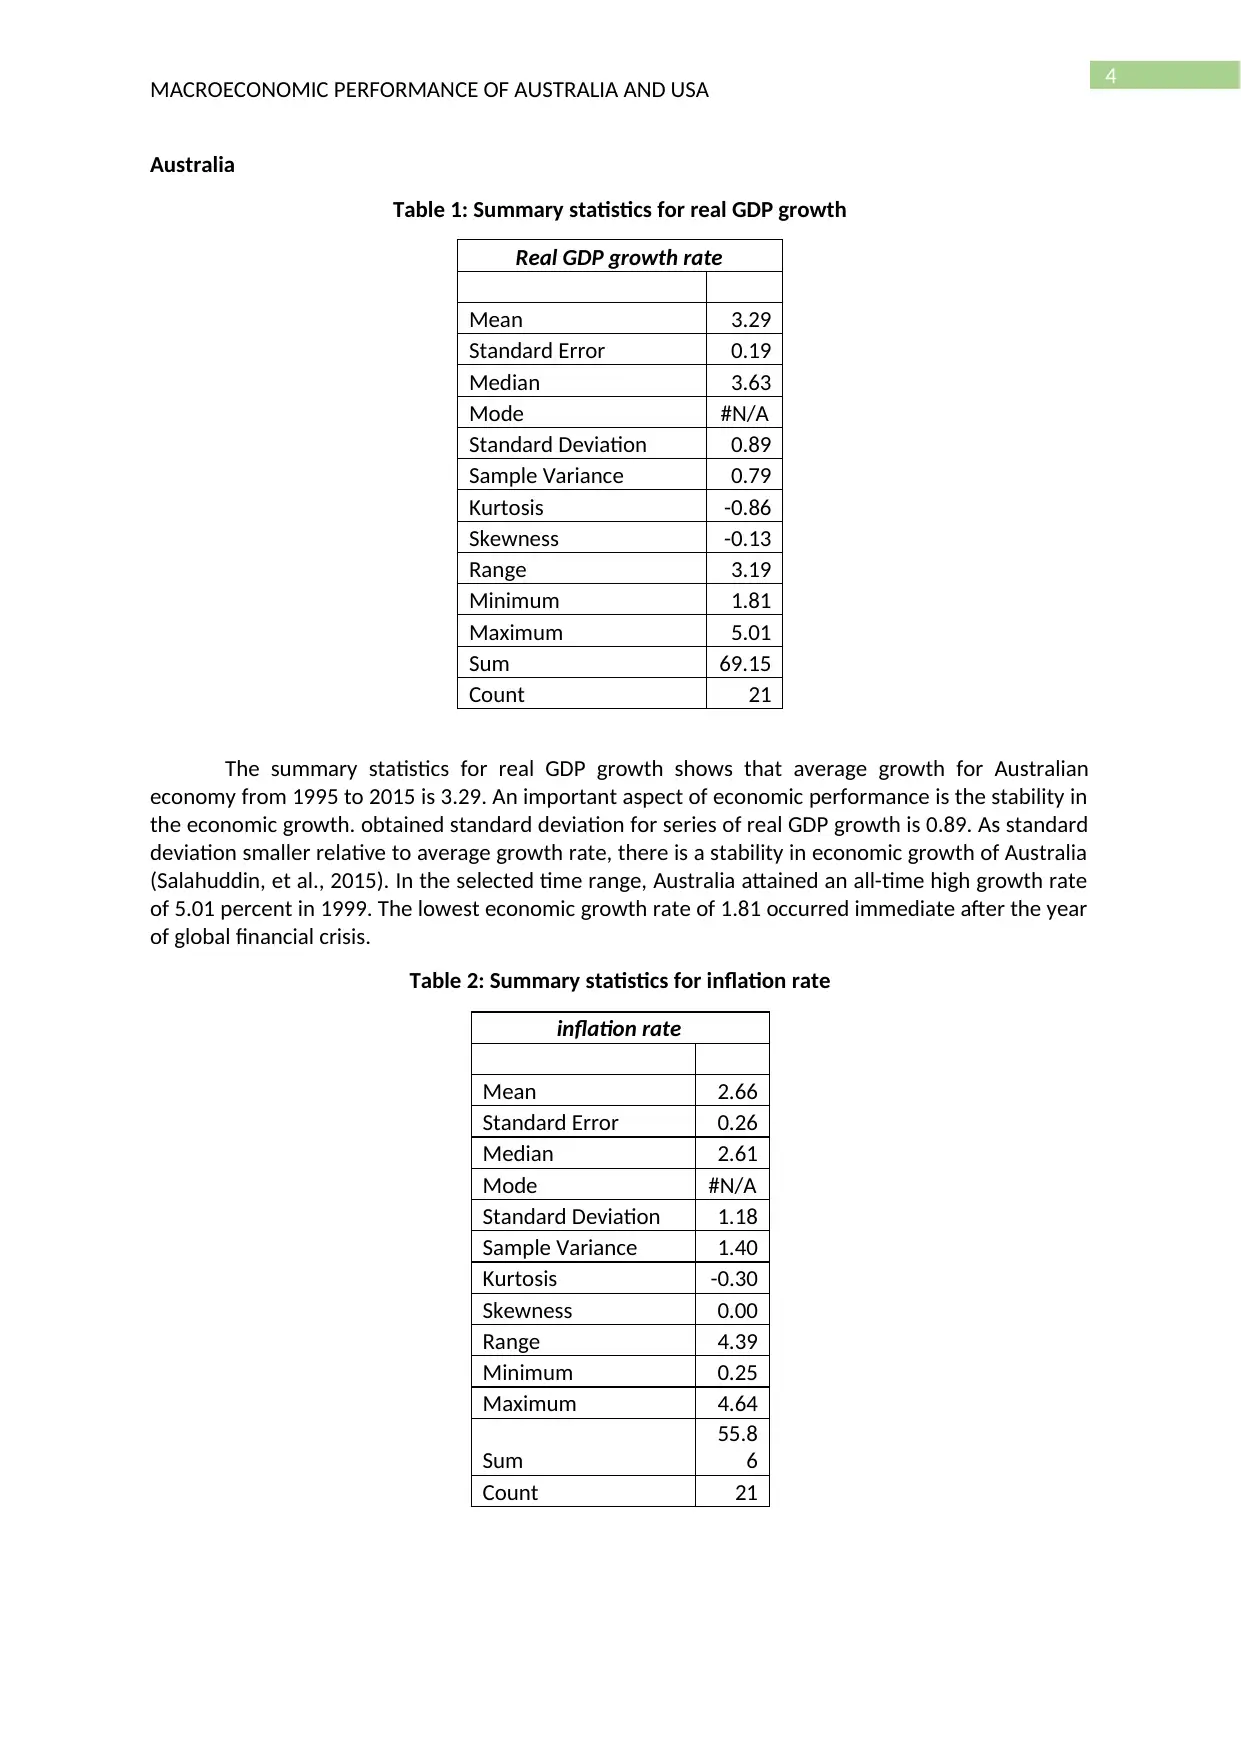
Table 1: Summary statistics for real GDP growth
Real GDP growth rate
Mean 3.29
Standard Error 0.19
Median 3.63
Mode #N/A
Standard Deviation 0.89
Sample Variance 0.79
Kurtosis -0.86
Skewness -0.13
Range 3.19
Minimum 1.81
Maximum 5.01
Sum 69.15
Count 21
The summary statistics for real GDP growth shows that average growth for Australian
economy from 1995 to 2015 is 3.29. An important aspect of economic performance is the stability in
the economic growth. obtained standard deviation for series of real GDP growth is 0.89. As standard
deviation smaller relative to average growth rate, there is a stability in economic growth of Australia
(Salahuddin, et al., 2015). In the selected time range, Australia attained an all-time high growth rate
of 5.01 percent in 1999. The lowest economic growth rate of 1.81 occurred immediate after the year
of global financial crisis.
Table 2: Summary statistics for inflation rate
inflation rate
Mean 2.66
Standard Error 0.26
Median 2.61
Mode #N/A
Standard Deviation 1.18
Sample Variance 1.40
Kurtosis -0.30
Skewness 0.00
Range 4.39
Minimum 0.25
Maximum 4.64
Sum
55.8
6
Count 21
MACROECONOMIC PERFORMANCE OF AUSTRALIA AND USA
Australia
Table 1: Summary statistics for real GDP growth
Real GDP growth rate
Mean 3.29
Standard Error 0.19
Median 3.63
Mode #N/A
Standard Deviation 0.89
Sample Variance 0.79
Kurtosis -0.86
Skewness -0.13
Range 3.19
Minimum 1.81
Maximum 5.01
Sum 69.15
Count 21
The summary statistics for real GDP growth shows that average growth for Australian
economy from 1995 to 2015 is 3.29. An important aspect of economic performance is the stability in
the economic growth. obtained standard deviation for series of real GDP growth is 0.89. As standard
deviation smaller relative to average growth rate, there is a stability in economic growth of Australia
(Salahuddin, et al., 2015). In the selected time range, Australia attained an all-time high growth rate
of 5.01 percent in 1999. The lowest economic growth rate of 1.81 occurred immediate after the year
of global financial crisis.
Table 2: Summary statistics for inflation rate
inflation rate
Mean 2.66
Standard Error 0.26
Median 2.61
Mode #N/A
Standard Deviation 1.18
Sample Variance 1.40
Kurtosis -0.30
Skewness 0.00
Range 4.39
Minimum 0.25
Maximum 4.64
Sum
55.8
6
Count 21
5
MACROECONOMIC PERFORMANCE OF AUSTRALIA AND USA
The mean inflation rate of 2.66 percent implies that price level in the economy grew at an
average rate of 2.66 percent. Stability in the price level can be predicted from a relatively lower
standard deviation for inflation rate in the selected sample period. The estimated standard deviation
is 1.18. The inflation rate in the economy varies between a maximum of 4.64 percent and a
minimum of 0.25 percent.
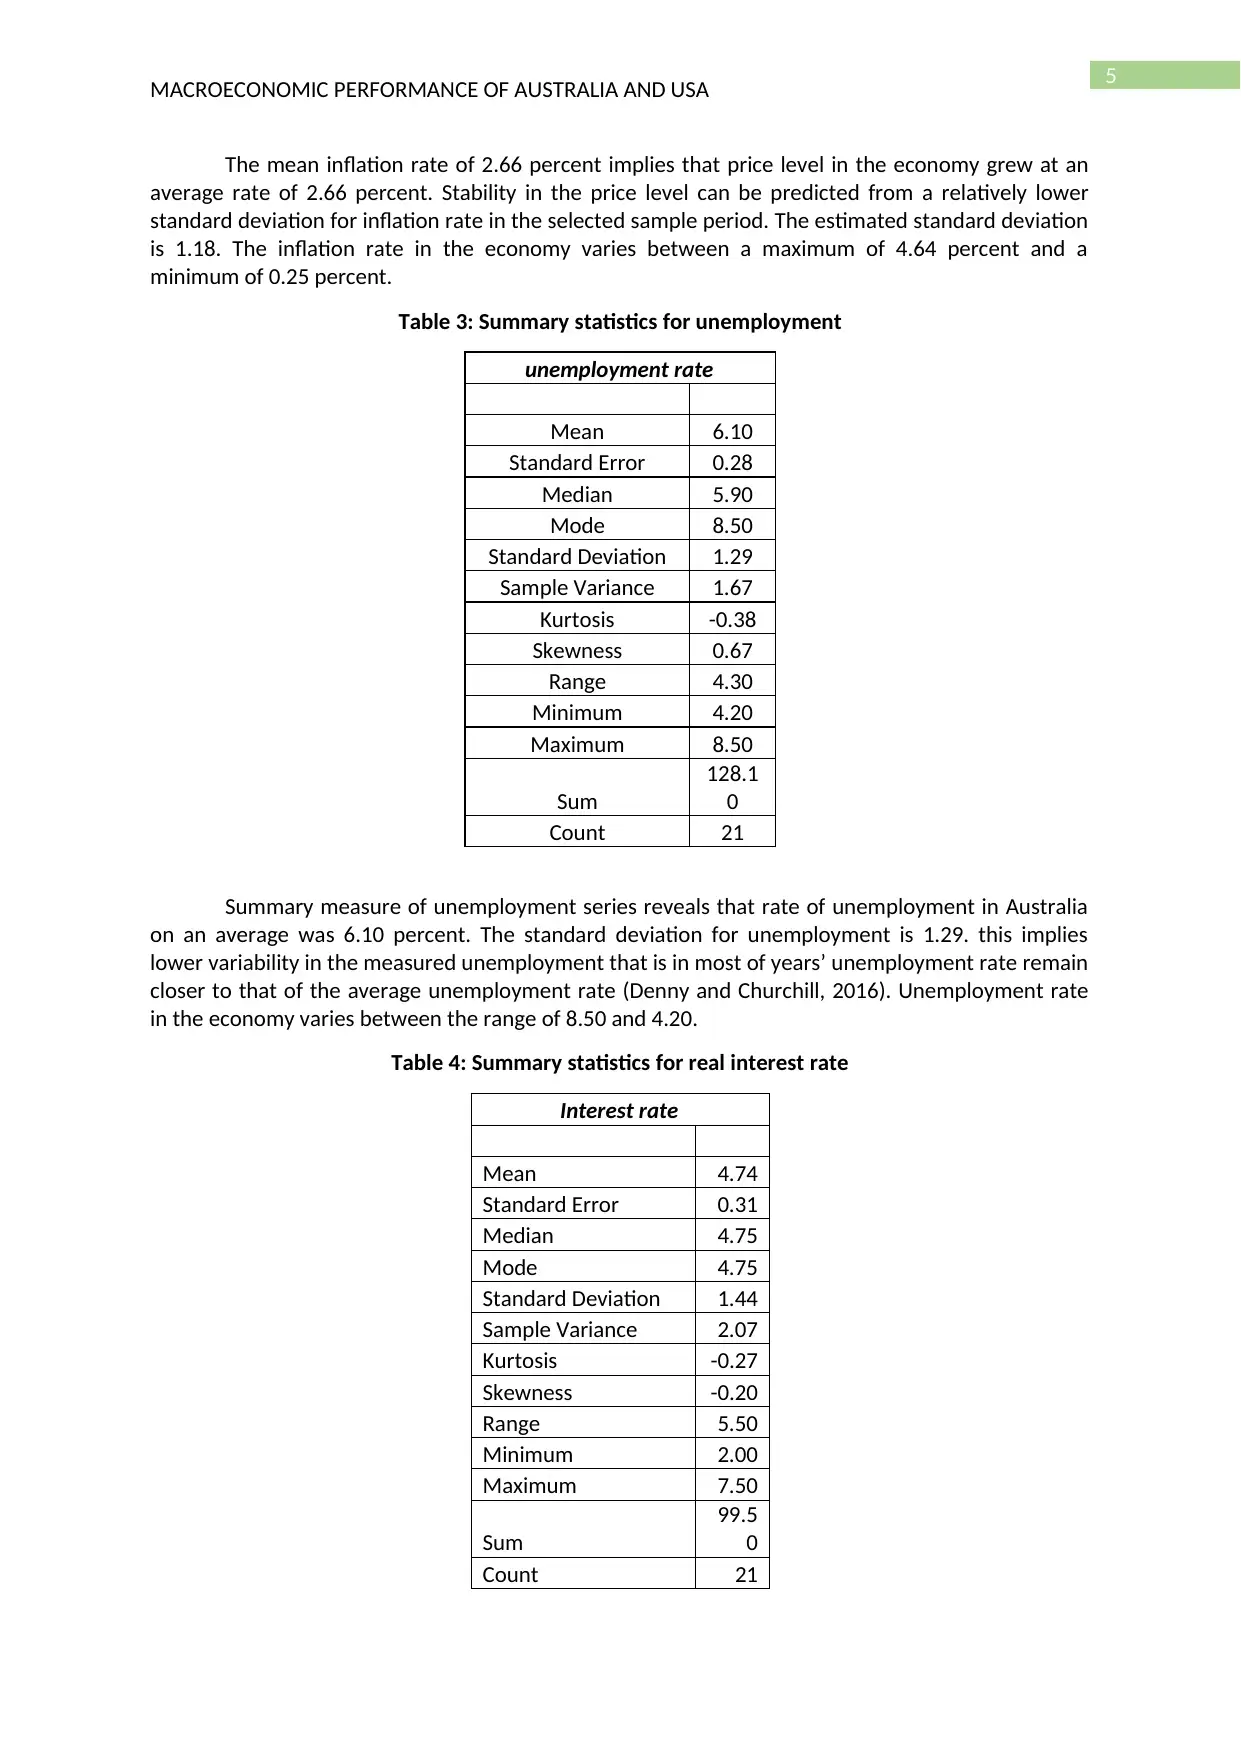
Table 3: Summary statistics for unemployment
unemployment rate
Mean 6.10
Standard Error 0.28
Median 5.90
Mode 8.50
Standard Deviation 1.29
Sample Variance 1.67
Kurtosis -0.38
Skewness 0.67
Range 4.30
Minimum 4.20
Maximum 8.50
Sum
128.1
0
Count 21
Summary measure of unemployment series reveals that rate of unemployment in Australia
on an average was 6.10 percent. The standard deviation for unemployment is 1.29. this implies
lower variability in the measured unemployment that is in most of years’ unemployment rate remain
closer to that of the average unemployment rate (Denny and Churchill, 2016). Unemployment rate
in the economy varies between the range of 8.50 and 4.20.
Table 4: Summary statistics for real interest rate
Interest rate
Mean 4.74
Standard Error 0.31
Median 4.75
Mode 4.75
Standard Deviation 1.44
Sample Variance 2.07
Kurtosis -0.27
Skewness -0.20
Range 5.50
Minimum 2.00
Maximum 7.50
Sum
99.5
0
Count 21
MACROECONOMIC PERFORMANCE OF AUSTRALIA AND USA
The mean inflation rate of 2.66 percent implies that price level in the economy grew at an
average rate of 2.66 percent. Stability in the price level can be predicted from a relatively lower
standard deviation for inflation rate in the selected sample period. The estimated standard deviation
is 1.18. The inflation rate in the economy varies between a maximum of 4.64 percent and a
minimum of 0.25 percent.
Table 3: Summary statistics for unemployment
unemployment rate
Mean 6.10
Standard Error 0.28
Median 5.90
Mode 8.50
Standard Deviation 1.29
Sample Variance 1.67
Kurtosis -0.38
Skewness 0.67
Range 4.30
Minimum 4.20
Maximum 8.50
Sum
128.1
0
Count 21
Summary measure of unemployment series reveals that rate of unemployment in Australia
on an average was 6.10 percent. The standard deviation for unemployment is 1.29. this implies
lower variability in the measured unemployment that is in most of years’ unemployment rate remain
closer to that of the average unemployment rate (Denny and Churchill, 2016). Unemployment rate
in the economy varies between the range of 8.50 and 4.20.
Table 4: Summary statistics for real interest rate
Interest rate
Mean 4.74
Standard Error 0.31
Median 4.75
Mode 4.75
Standard Deviation 1.44
Sample Variance 2.07
Kurtosis -0.27
Skewness -0.20
Range 5.50
Minimum 2.00
Maximum 7.50
Sum
99.5
0
Count 21
⊘ This is a preview!⊘
Do you want full access?
Subscribe today to unlock all pages.
Trusted by 1+ million students worldwide
6
MACROECONOMIC PERFORMANCE OF AUSTRALIA AND USA
The Reserve Bank of Australia determines the cash rate in the economy. The cash rate for
Australian economy is on average remained at 4.74. In order to maintain a stability in the economy
RBA prefers to keep the cash to a relatively stable state (Makin, Pearce and Ratnasiri, 2019) For the
series of interest rate, the standard deviation 1.44 which is much smaller than the mean. The cash
rate was at the highest level of 7.50 percent at the beginning of sample period that is in 1995. The
expansionary monetary policy since then pushed the cash rate to the lowest level to 2.00 in 2015.
Table 5: Summary statistics for net export
Net export
Mean -62.16
Standard Error 58.55
Median -13.13
Mode #N/A
Standard
Deviation 268.29
Sample Variance
71981.1
3
Kurtosis 18.73
Skewness -4.20
Range 1401.06
Minimum -1204.18
Maximum 196.88
Sum -1305.37
Count 21
The average net export growth in Australia is negative indicating a decline in trade balance
of the economy.
Table 6: Summary statistics for exchange rate
AUD/USD
Mean 1.10
Standard Error 0.01
Median 1.13
Mode 1.14
Standard Deviation 0.13
Sample Variance 0.02
Kurtosis 0.85
Skewness -1.05
Range 0.63
Minimum 0.70
Maximum 1.34
Sum 277.5
Paraphrase This Document
Need a fresh take? Get an instant paraphrase of this document with our AI Paraphraser
7
MACROECONOMIC PERFORMANCE OF AUSTRALIA AND USA
3
Count 252
From the series of monthly exchange rate, the average exchange rate is 1.10. This implies on
an average Australia exchanged 1.10 AUD against 1 USD. The lower standard deviation value of 0.13
implies the exchange rate remains relatively stable. The AUD/USD exchange rate is as high as 1.34
and as low as 0.70.
USA
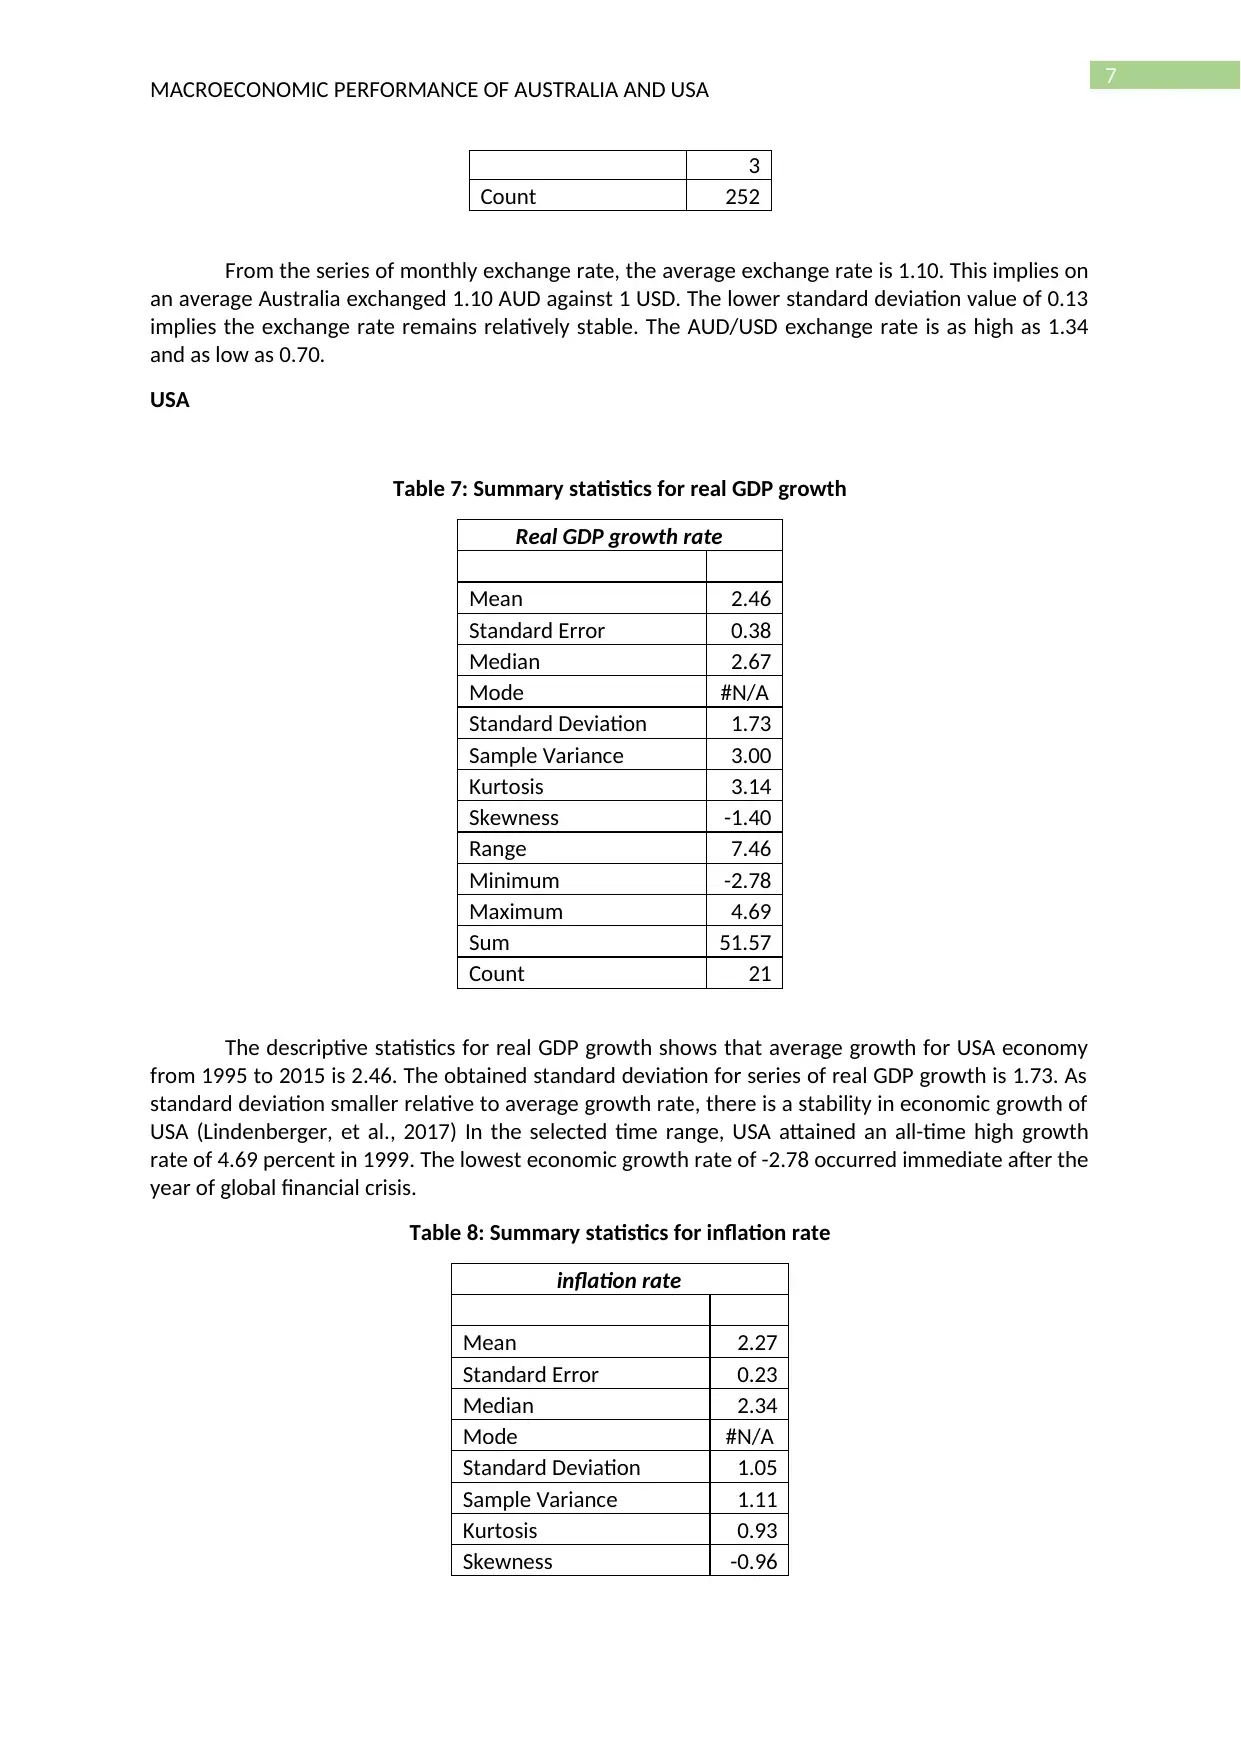
Table 7: Summary statistics for real GDP growth
Real GDP growth rate
Mean 2.46
Standard Error 0.38
Median 2.67
Mode #N/A
Standard Deviation 1.73
Sample Variance 3.00
Kurtosis 3.14
Skewness -1.40
Range 7.46
Minimum -2.78
Maximum 4.69
Sum 51.57
Count 21
The descriptive statistics for real GDP growth shows that average growth for USA economy
from 1995 to 2015 is 2.46. The obtained standard deviation for series of real GDP growth is 1.73. As
standard deviation smaller relative to average growth rate, there is a stability in economic growth of
USA (Lindenberger, et al., 2017) In the selected time range, USA attained an all-time high growth
rate of 4.69 percent in 1999. The lowest economic growth rate of -2.78 occurred immediate after the
year of global financial crisis.
Table 8: Summary statistics for inflation rate
inflation rate
Mean 2.27
Standard Error 0.23
Median 2.34
Mode #N/A
Standard Deviation 1.05
Sample Variance 1.11
Kurtosis 0.93
Skewness -0.96
MACROECONOMIC PERFORMANCE OF AUSTRALIA AND USA
3
Count 252
From the series of monthly exchange rate, the average exchange rate is 1.10. This implies on
an average Australia exchanged 1.10 AUD against 1 USD. The lower standard deviation value of 0.13
implies the exchange rate remains relatively stable. The AUD/USD exchange rate is as high as 1.34
and as low as 0.70.
USA
Table 7: Summary statistics for real GDP growth
Real GDP growth rate
Mean 2.46
Standard Error 0.38
Median 2.67
Mode #N/A
Standard Deviation 1.73
Sample Variance 3.00
Kurtosis 3.14
Skewness -1.40
Range 7.46
Minimum -2.78
Maximum 4.69
Sum 51.57
Count 21
The descriptive statistics for real GDP growth shows that average growth for USA economy
from 1995 to 2015 is 2.46. The obtained standard deviation for series of real GDP growth is 1.73. As
standard deviation smaller relative to average growth rate, there is a stability in economic growth of
USA (Lindenberger, et al., 2017) In the selected time range, USA attained an all-time high growth
rate of 4.69 percent in 1999. The lowest economic growth rate of -2.78 occurred immediate after the
year of global financial crisis.
Table 8: Summary statistics for inflation rate
inflation rate
Mean 2.27
Standard Error 0.23
Median 2.34
Mode #N/A
Standard Deviation 1.05
Sample Variance 1.11
Kurtosis 0.93
Skewness -0.96
8
MACROECONOMIC PERFORMANCE OF AUSTRALIA AND USA
Range 4.19
Minimum -0.36
Maximum 3.84
Sum 47.58
Count 21
The average inflation rate of 2.27 percent implies that price level in the economy grew at an
average rate of 2.27 percent. The average inflation rate in USA is close to that in Australia. Stability in
the price level can be predicted from a relatively lower standard deviation for inflation rate in the
selected sample period. The estimated standard deviation is 1.05. The inflation rate in the economy
varies between a maximum of 3.84 percent and a minimum of -0.36 percent.
Table 9: Summary statistics for unemployment
unemployment rate
Mean 5.98
Standard Error 0.37
Median 5.50
Mode 5.80
Standard Deviation 1.69
Sample Variance 2.85
Kurtosis 0.06
Skewness 1.09
Range 5.60
Minimum 4.00
Maximum 9.60
Sum
125.5
0
Count 21
Summary statistics of unemployment series in United State reveals that rate of
unemployment in USA on an average was 5.98 percent. This is lower than the average
unemployment rate of 6.10 percent in Australia. The standard deviation for unemployment is 1.69.
this implies lower variability in the measured unemployment that is in most of years’ unemployment
rate remain closer to that of the average unemployment rate. Unemployment rate in the economy
varies between the range of 9.60 and 4.00 percent.
Table 10: Summary statistics for real interest rate
Interest rate
Mean 2.72
Standard Error 0.52
Median 1.93
Mode #N/A
Standard Deviation 2.38
Sample Variance 5.66
⊘ This is a preview!⊘
Do you want full access?
Subscribe today to unlock all pages.
Trusted by 1+ million students worldwide
9
MACROECONOMIC PERFORMANCE OF AUSTRALIA AND USA
Kurtosis -1.82
Skewness 0.14
Range 6.15
Minimum 0.09
Maximum 6.24
Sum
57.2
2
Count 21
The Federal Reserve in USA determines the fund rate in the economy. The fund rate for USA
economy is on average remained at 2.72. In order to maintain a stability in the economy the Fed
prefers to keep the cash to a relatively stable state. For the series of interest rate, the standard
deviation 2.38 which is much smaller than the mean. The highest and lowest fund rate is obtained as
6.24 percent and 0.09 percent respectively.
Table 11: Summary statistics for net export
Net export
Mean 9.60
Standard Error 4.81
Median 6.47
Mode #N/A
Standard Deviation 22.03
Sample Variance
485.3
7
Kurtosis 2.88
Skewness 1.10
Range
102.9
5
Minimum -28.23
Maximum 74.72
Sum
201.5
5
Count 21
The mean growth rate for net export is 9.60 percent. The trade balance however is largely
variable for USA as implied by the large value of standard deviation for net export series.
Table 12: Summary statistics for exchange rate
USD/AUD
Mean 0.92
Standard Error 0.01
Median 0.89
Mode 0.87
Standard Deviation 0.13
Sample Variance 0.02
Paraphrase This Document
Need a fresh take? Get an instant paraphrase of this document with our AI Paraphraser
10
MACROECONOMIC PERFORMANCE OF AUSTRALIA AND USA
Kurtosis 3.23
Skewness 1.77
Range 0.68
Minimum 0.75
Maximum 1.43
Sum
232.7
2
Count 252
From the series of monthly exchange rate, the average exchange rate is 0.92. This implies on
an average USA exchanged 0.92 USD against 1 AUD. The lower standard deviation value of 0.13
implies the exchange rate remains relatively stable. The exchange rate between USA and Australia
varied in the range between 1.43 and 0.75.
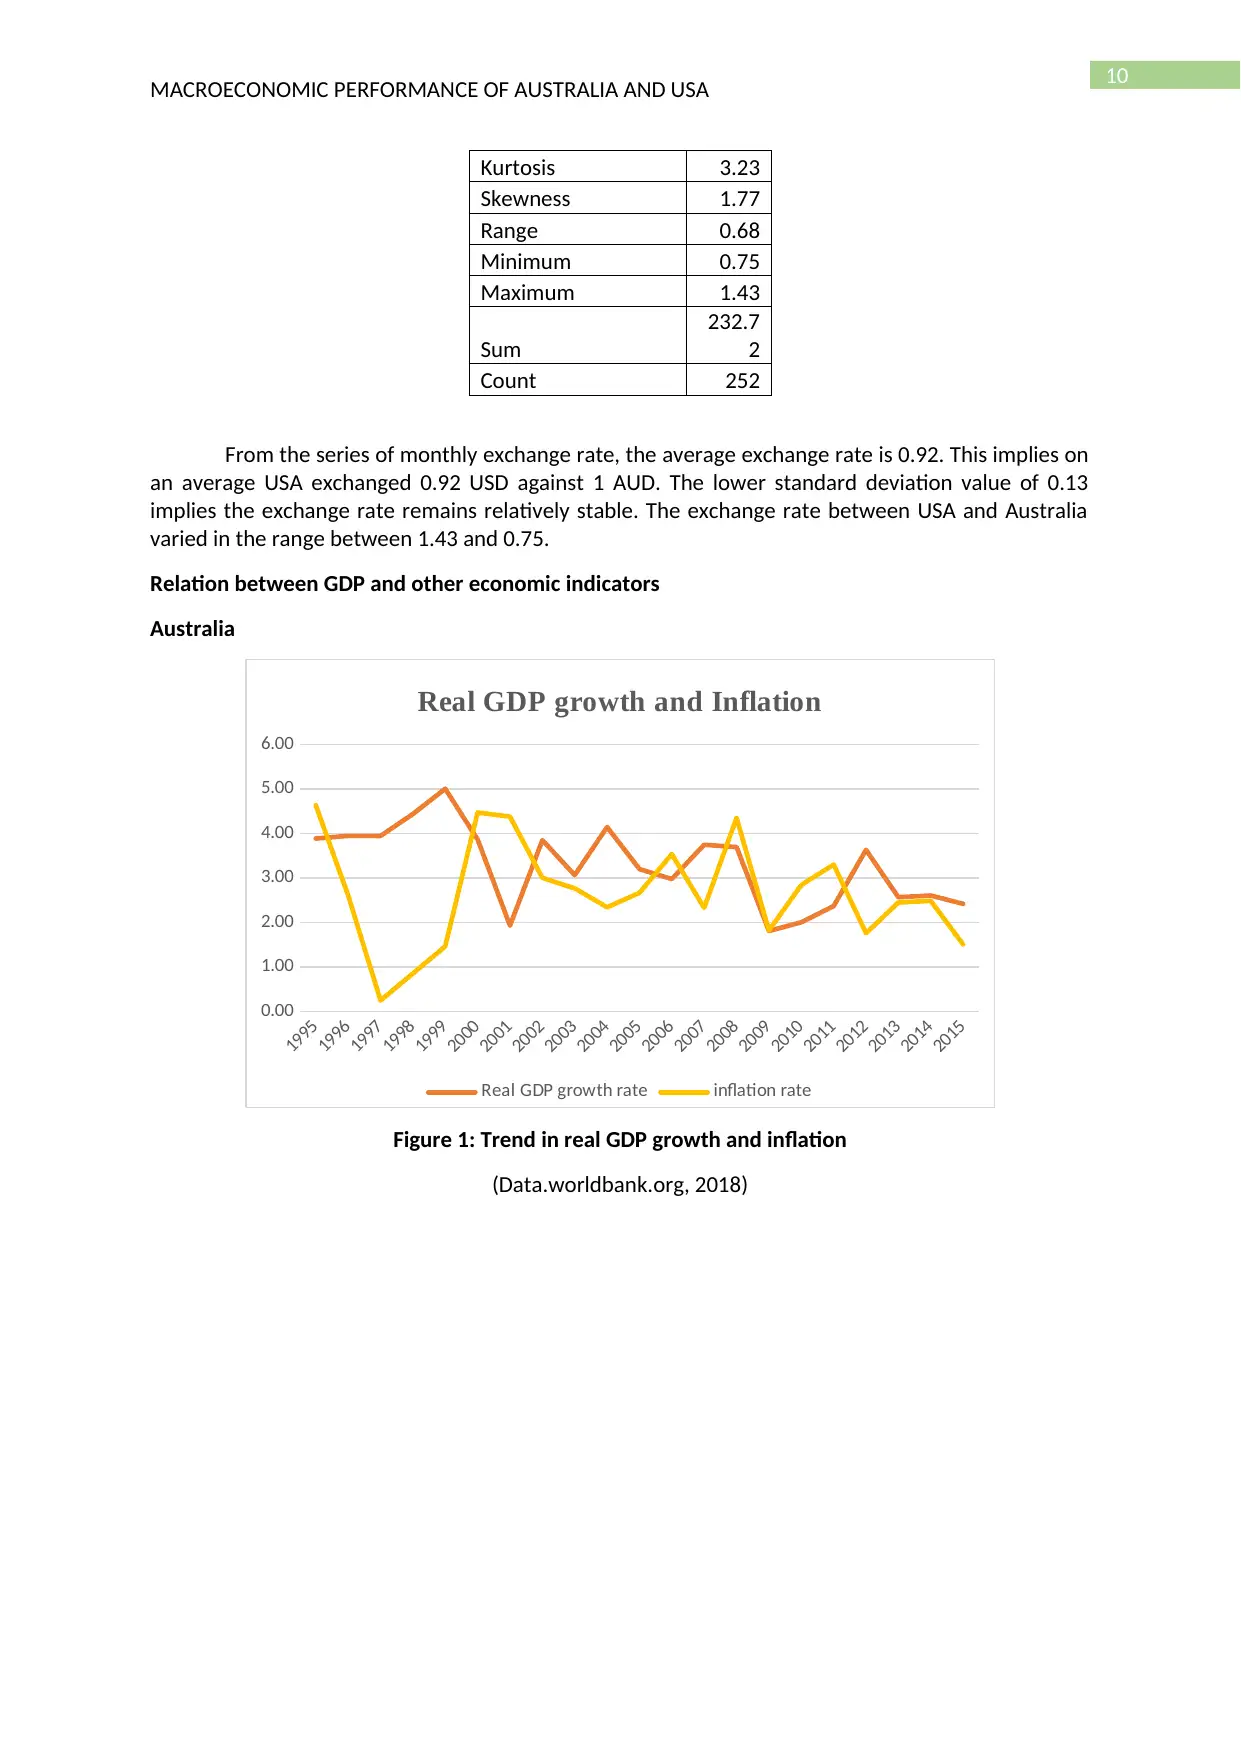
Relation between GDP and other economic indicators
Australia
1995
1996
1997
1998
1999
2000
2001
2002
2003
2004
2005
2006
2007
2008
2009
2010
2011
2012
2013
2014
2015
0.00
1.00
2.00
3.00
4.00
5.00
6.00
Real GDP growth and Inflation
Real GDP growth rate inflation rate
Figure 1: Trend in real GDP growth and inflation
(Data.worldbank.org, 2018)
MACROECONOMIC PERFORMANCE OF AUSTRALIA AND USA
Kurtosis 3.23
Skewness 1.77
Range 0.68
Minimum 0.75
Maximum 1.43
Sum
232.7
2
Count 252
From the series of monthly exchange rate, the average exchange rate is 0.92. This implies on
an average USA exchanged 0.92 USD against 1 AUD. The lower standard deviation value of 0.13
implies the exchange rate remains relatively stable. The exchange rate between USA and Australia
varied in the range between 1.43 and 0.75.
Relation between GDP and other economic indicators
Australia
1995
1996
1997
1998
1999
2000
2001
2002
2003
2004
2005
2006
2007
2008
2009
2010
2011
2012
2013
2014
2015
0.00
1.00
2.00
3.00
4.00
5.00
6.00
Real GDP growth and Inflation
Real GDP growth rate inflation rate
Figure 1: Trend in real GDP growth and inflation
(Data.worldbank.org, 2018)
11
MACROECONOMIC PERFORMANCE OF AUSTRALIA AND USA
1995
1996
1997
1998
1999
2000
2001
2002
2003
2004
2005
2006
2007
2008
2009
2010
2011
2012
2013
2014
2015
0.00
1.00
2.00
3.00
4.00
5.00
6.00
7.00
8.00
9.00
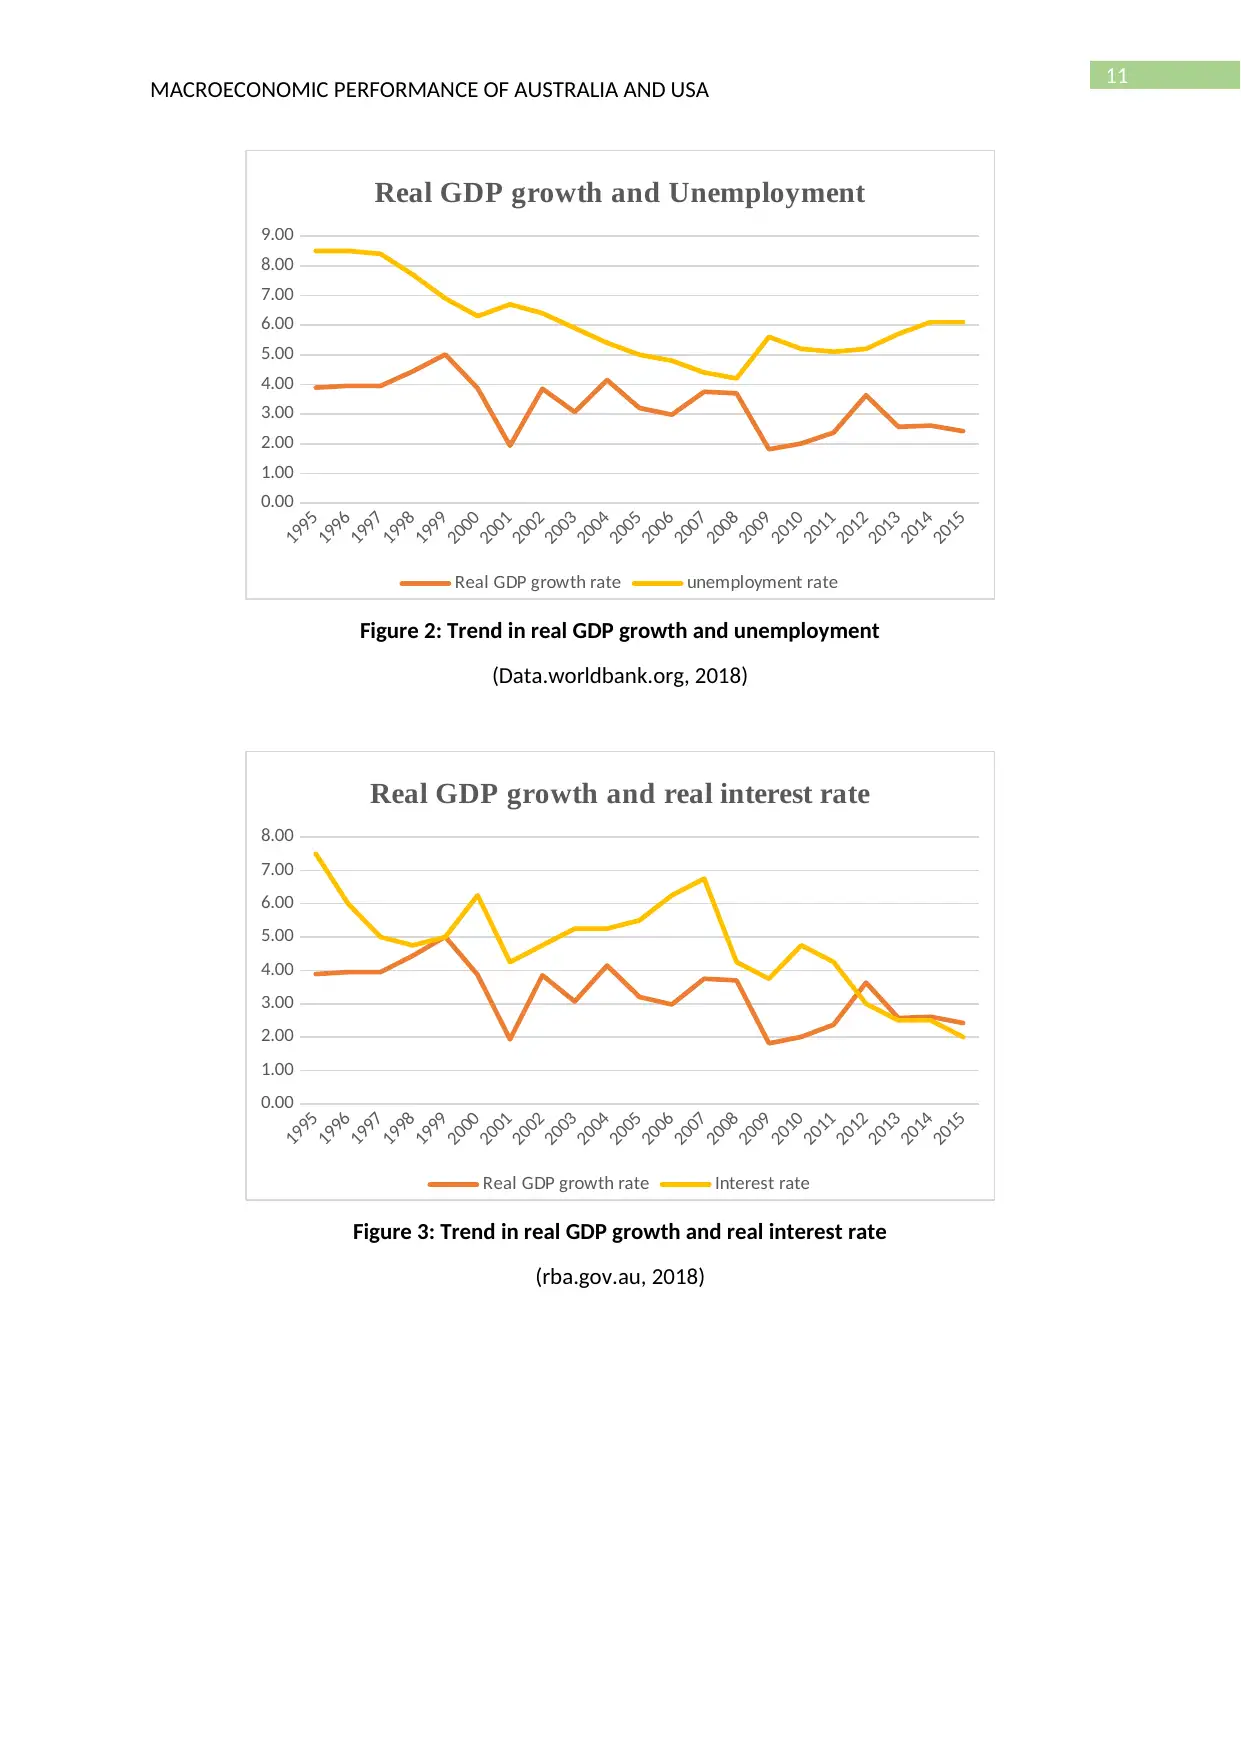
Real GDP growth and Unemployment
Real GDP growth rate unemployment rate
Figure 2: Trend in real GDP growth and unemployment
(Data.worldbank.org, 2018)
1995
1996
1997
1998
1999
2000
2001
2002
2003
2004
2005
2006
2007
2008
2009
2010
2011
2012
2013
2014
2015
0.00
1.00
2.00
3.00
4.00
5.00
6.00
7.00
8.00
Real GDP growth and real interest rate
Real GDP growth rate Interest rate
Figure 3: Trend in real GDP growth and real interest rate
(rba.gov.au, 2018)
MACROECONOMIC PERFORMANCE OF AUSTRALIA AND USA
1995
1996
1997
1998
1999
2000
2001
2002
2003
2004
2005
2006
2007
2008
2009
2010
2011
2012
2013
2014
2015
0.00
1.00
2.00
3.00
4.00
5.00
6.00
7.00
8.00
9.00
Real GDP growth and Unemployment
Real GDP growth rate unemployment rate
Figure 2: Trend in real GDP growth and unemployment
(Data.worldbank.org, 2018)
1995
1996
1997
1998
1999
2000
2001
2002
2003
2004
2005
2006
2007
2008
2009
2010
2011
2012
2013
2014
2015
0.00
1.00
2.00
3.00
4.00
5.00
6.00
7.00
8.00
Real GDP growth and real interest rate
Real GDP growth rate Interest rate
Figure 3: Trend in real GDP growth and real interest rate
(rba.gov.au, 2018)
⊘ This is a preview!⊘
Do you want full access?
Subscribe today to unlock all pages.
Trusted by 1+ million students worldwide
1 out of 20
Related Documents


Your All-in-One AI-Powered Toolkit for Academic Success.
+13062052269
info@desklib.com
Available 24*7 on WhatsApp / Email
![[object Object]](/_next/static/media/star-bottom.7253800d.svg)
Unlock your academic potential
Copyright © 2020–2026 A2Z Services. All Rights Reserved. Developed and managed by ZUCOL.