Comparative Economic Performance: Australia vs UK (2012-2016)
VerifiedAdded on 2020/05/28
|16
|2454
|78
AI Summary
The study compares the economic performances of Australia and the UK from 2012 to 2016. Despite a slight decline in GDP trend relative to the UK, Australia exhibited superior economic health through higher per capita productivity. While the UK entered recession in 2012 before moving into recovery phases by 2013-2016, Australia maintained stable growth during this period. The analysis used production and income approaches for GDP accounting in the respective countries, revealing nuanced insights into their economic dynamics.
ECONOMICS AND INTERNATIONAL TRADE
Name of the Student
Name of the University
Author’s Note
Page 1
Name of the Student
Name of the University
Author’s Note
Page 1
Paraphrase This Document
Need a fresh take? Get an instant paraphrase of this document with our AI Paraphraser
Table of Contents
Introduction......................................................................................................................................3
Economic growth rate, GDP, GDP per capita of UK and Australia during the period 2012-2016.3
Economic growth of Australia and UK.......................................................................................3
GDP of UK and Australia............................................................................................................5
GDP per capita of Australia and UK...........................................................................................8
Production Possibility Frontier (PPF)........................................................................................10
Business Cycle...........................................................................................................................11
GDP accounting method............................................................................................................12
Conclusion.................................................................................................................................13
References......................................................................................................................................14
Page 2
Introduction
This report elucidates on the comparison and contrast of economic growth, GDP and
GDP per capita between the two nations. In this study, the two countries selected for making this
comparison and contrast are UK and Australia. Economic growth of a particular nation signifies
value of commodities produced by an economy and is estimated from real GDP. GDP signifies
the monetary measurement of market value of final products and services produced within the
boundary of the country during particular period of time. Fluctuation in GDP of the nation occurs
due to the concept of business cycle while certain macroeconomic indicators such as rate of
unemployment, inflation rate fluctuate due to variation in country’s GDP. Besides this, GDP per
capita is also useful for comparison between the countries as it reflect on the nation’s relative
performance. In this report, the differences as well as similarities between Australia and UK is
also examined with the help of GDP accounting method, Production Possibility Frontier (PPP)
and business cycle.
Economic growth rate, GDP, GDP per capita of UK and Australia during the period 2012-
2016
Economic growth of Australia and UK
The UK economy has been considered as one of the globalised and highly developed
economies in the globe. According to the office for National Statistics, in the year 2012, the UK
economy again dipped into recession after experiencing partial recovery during the period 2010-
2011. After the year 2007-2008, this nation again went into recession because of several factors
that includes European recession, weakness of the bank’s lending, lower confidence owing to
Page 3
⊘ This is a preview!⊘
Do you want full access?
Subscribe today to unlock all pages.
Trusted by 1+ million students worldwide
austerity measures and declining real incomes. Since the beginning of the year 2013, the
economy of UK has experienced increased economic growth (Hartwell 2017). The recovery has
been relatively stronger especially in the service sector rather than manufacturing sector and the
output of industries. Furthermore, during the year 2016, the economy of UK grew by around
1.8% in comparison with the previous year (Dhingra et al. 2016). During this period, the rate of
inflation has remained stable, the lowest being recorded at 0%in the year 2015. This impact has
also been reflected in the monthly CPI (Consumer Price Inflation) during this year. On the other
hand, the Australian economy has experienced even growth during this period. In addition, the
inflation rate was low, employment rate was high, financial system was stable and public debt
was low during the year 2012-2016. Moreover, the economic growth of Australia had averaged
to 3.5% during this period and was highest as compared to past few decades (Shahiduzzaman
and Alam 2014). This country’s economic growth also remained unaffected by the financial
crisis because of strong banking system and lower inflation rate. Increase in economic growth of
Australia during 2012-2016 was mainly because of increase in balance of trade, rising levels of
FDI (foreign direct investment) due to varied natural resources and fewer restrictions on import
of goods and services. As a result, this increased the nation income of this nation and this in turn
made this country highly dynamic as well as flexible.
Page 4
Paraphrase This Document
Need a fresh take? Get an instant paraphrase of this document with our AI Paraphraser
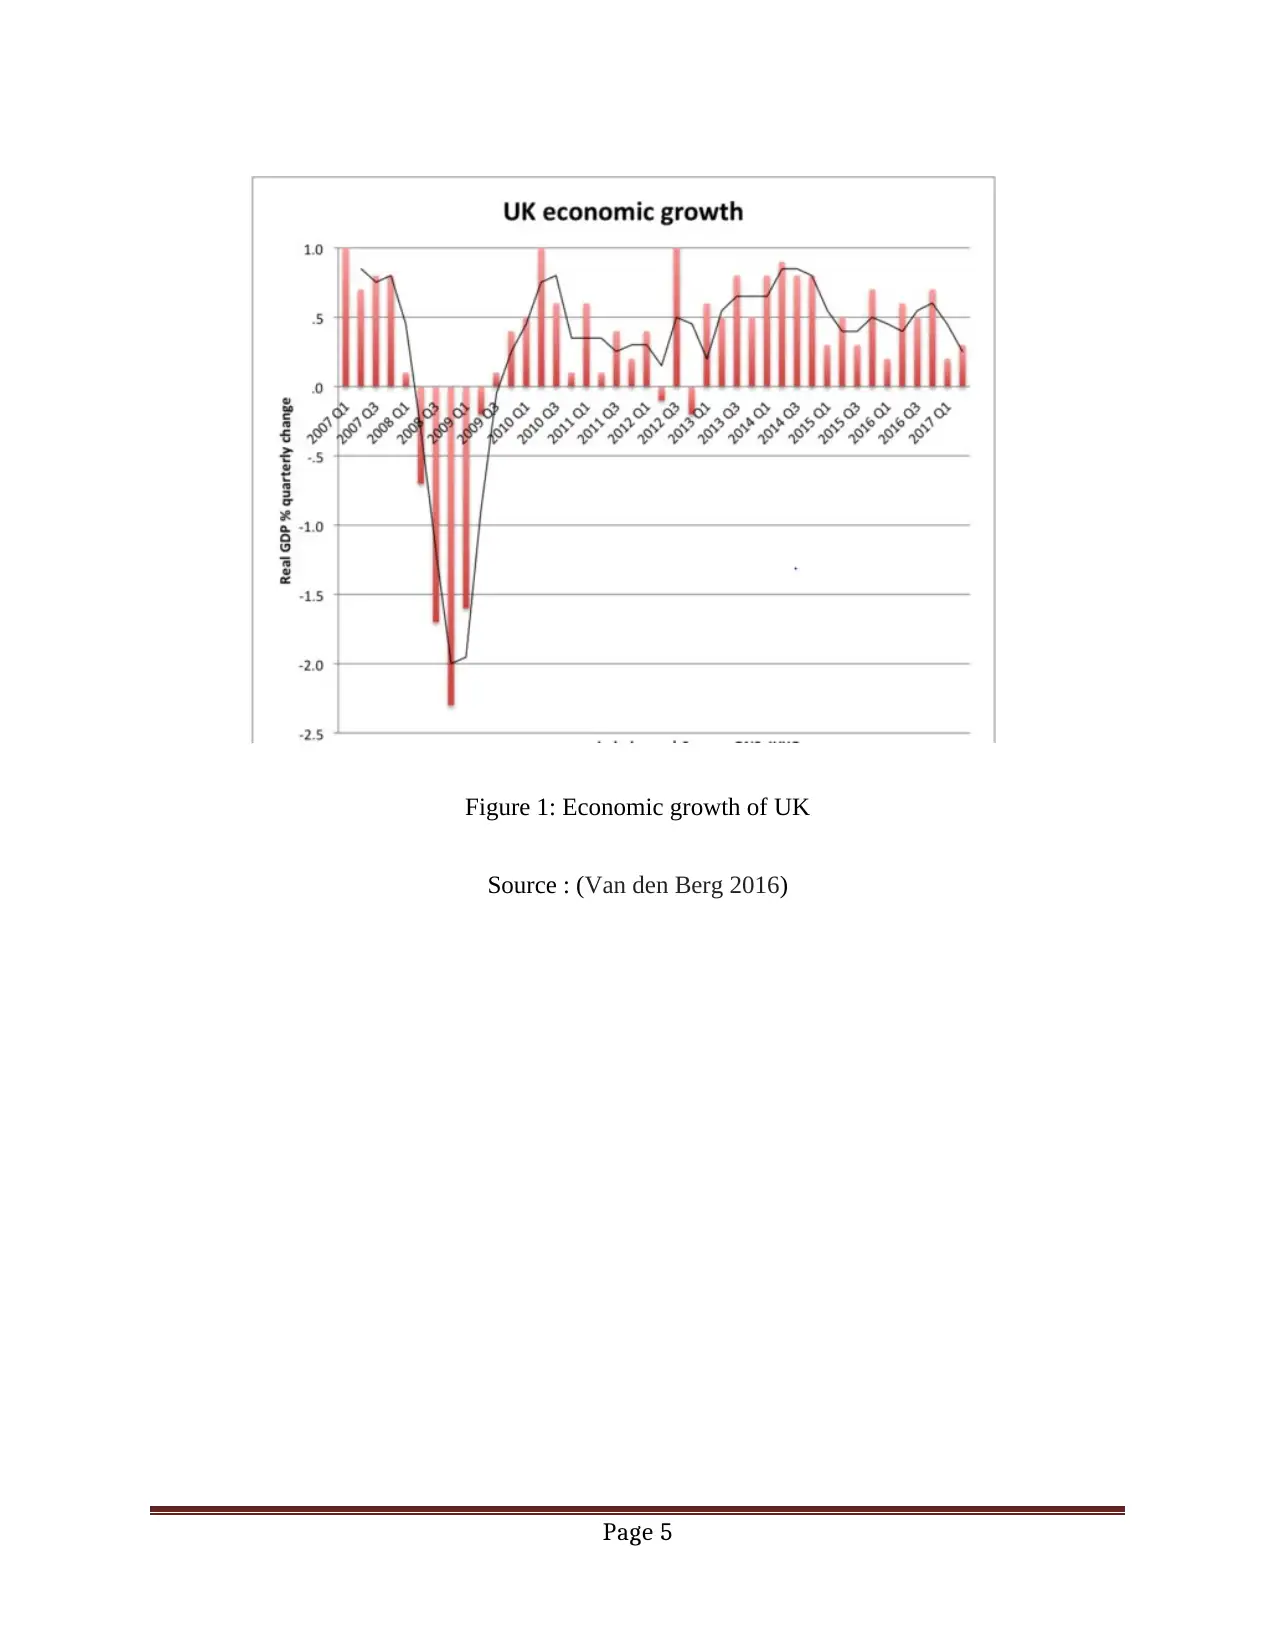
Figure 1: Economic growth of UK
Source : (Van den Berg 2016)
Page 5
Source : (Van den Berg 2016)
Page 5
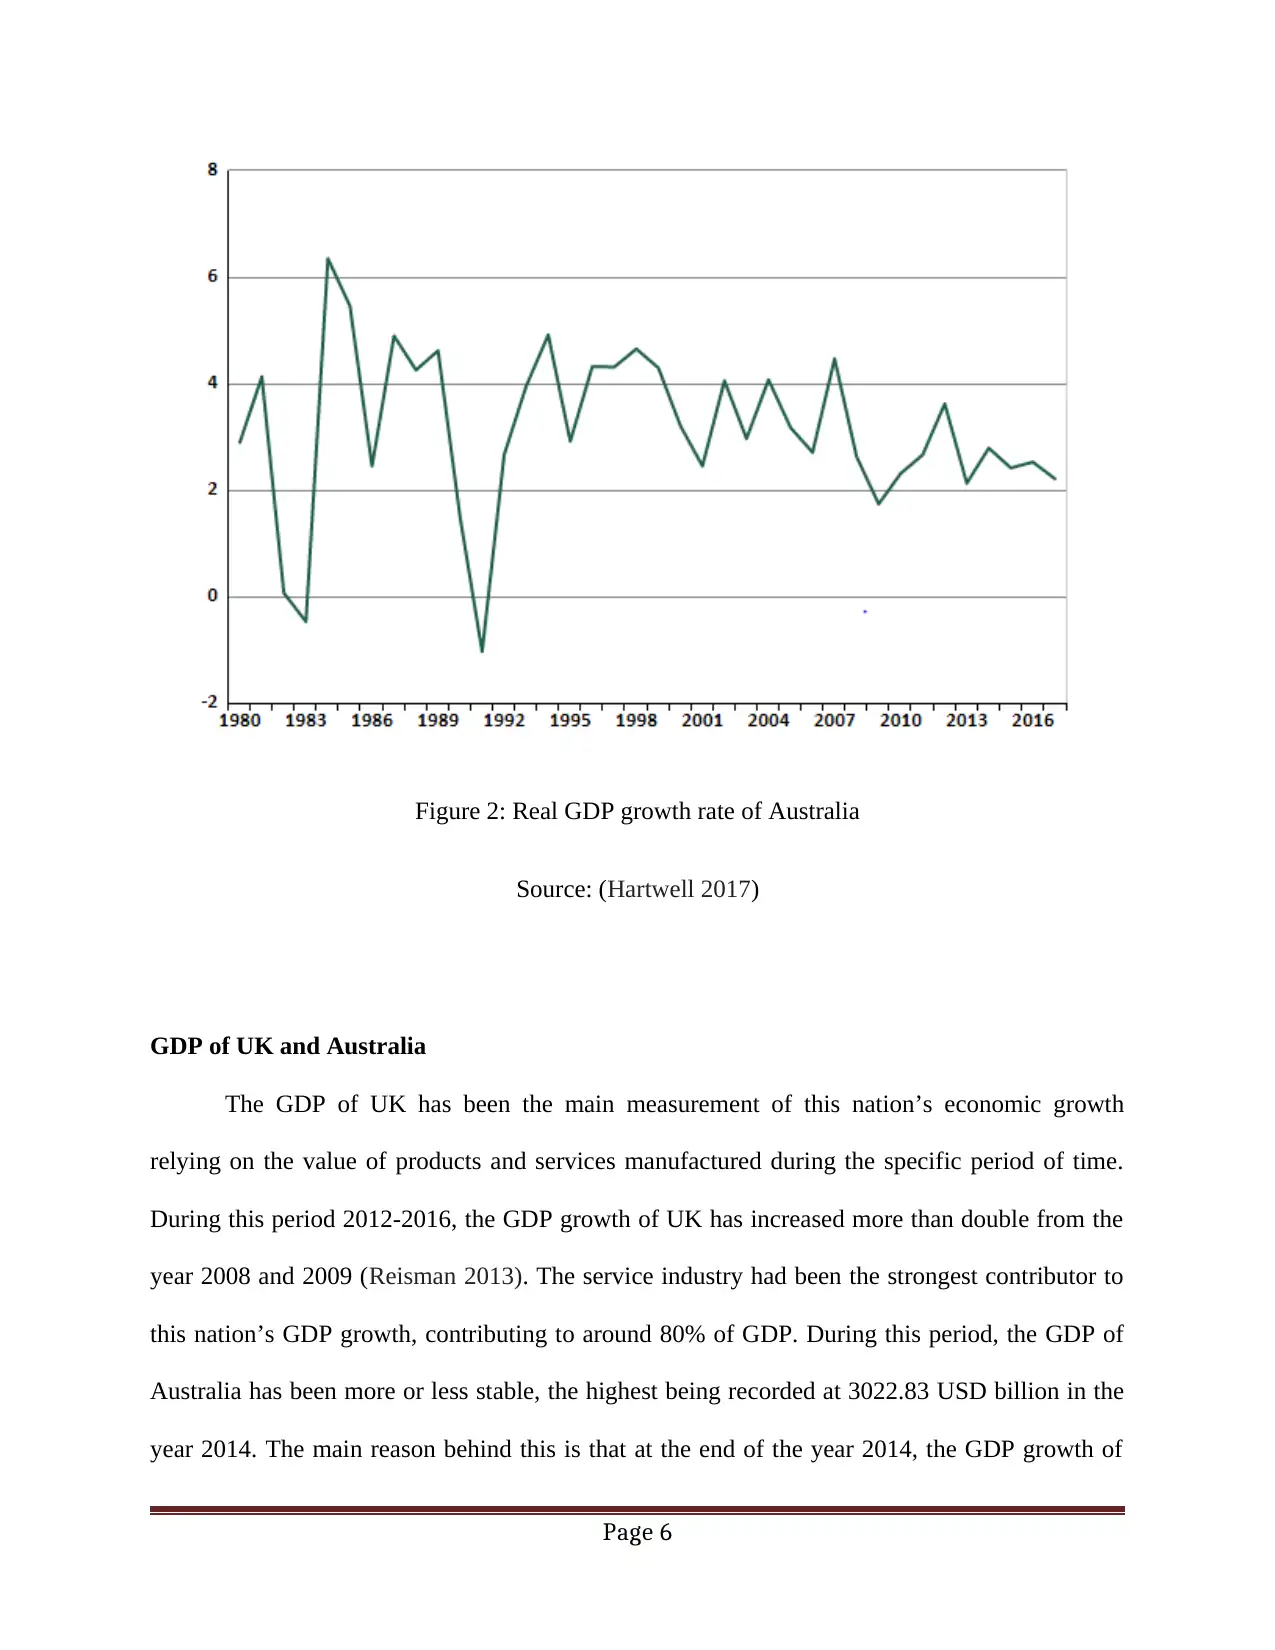
Figure 2: Real GDP growth rate of Australia
Source: (Hartwell 2017)
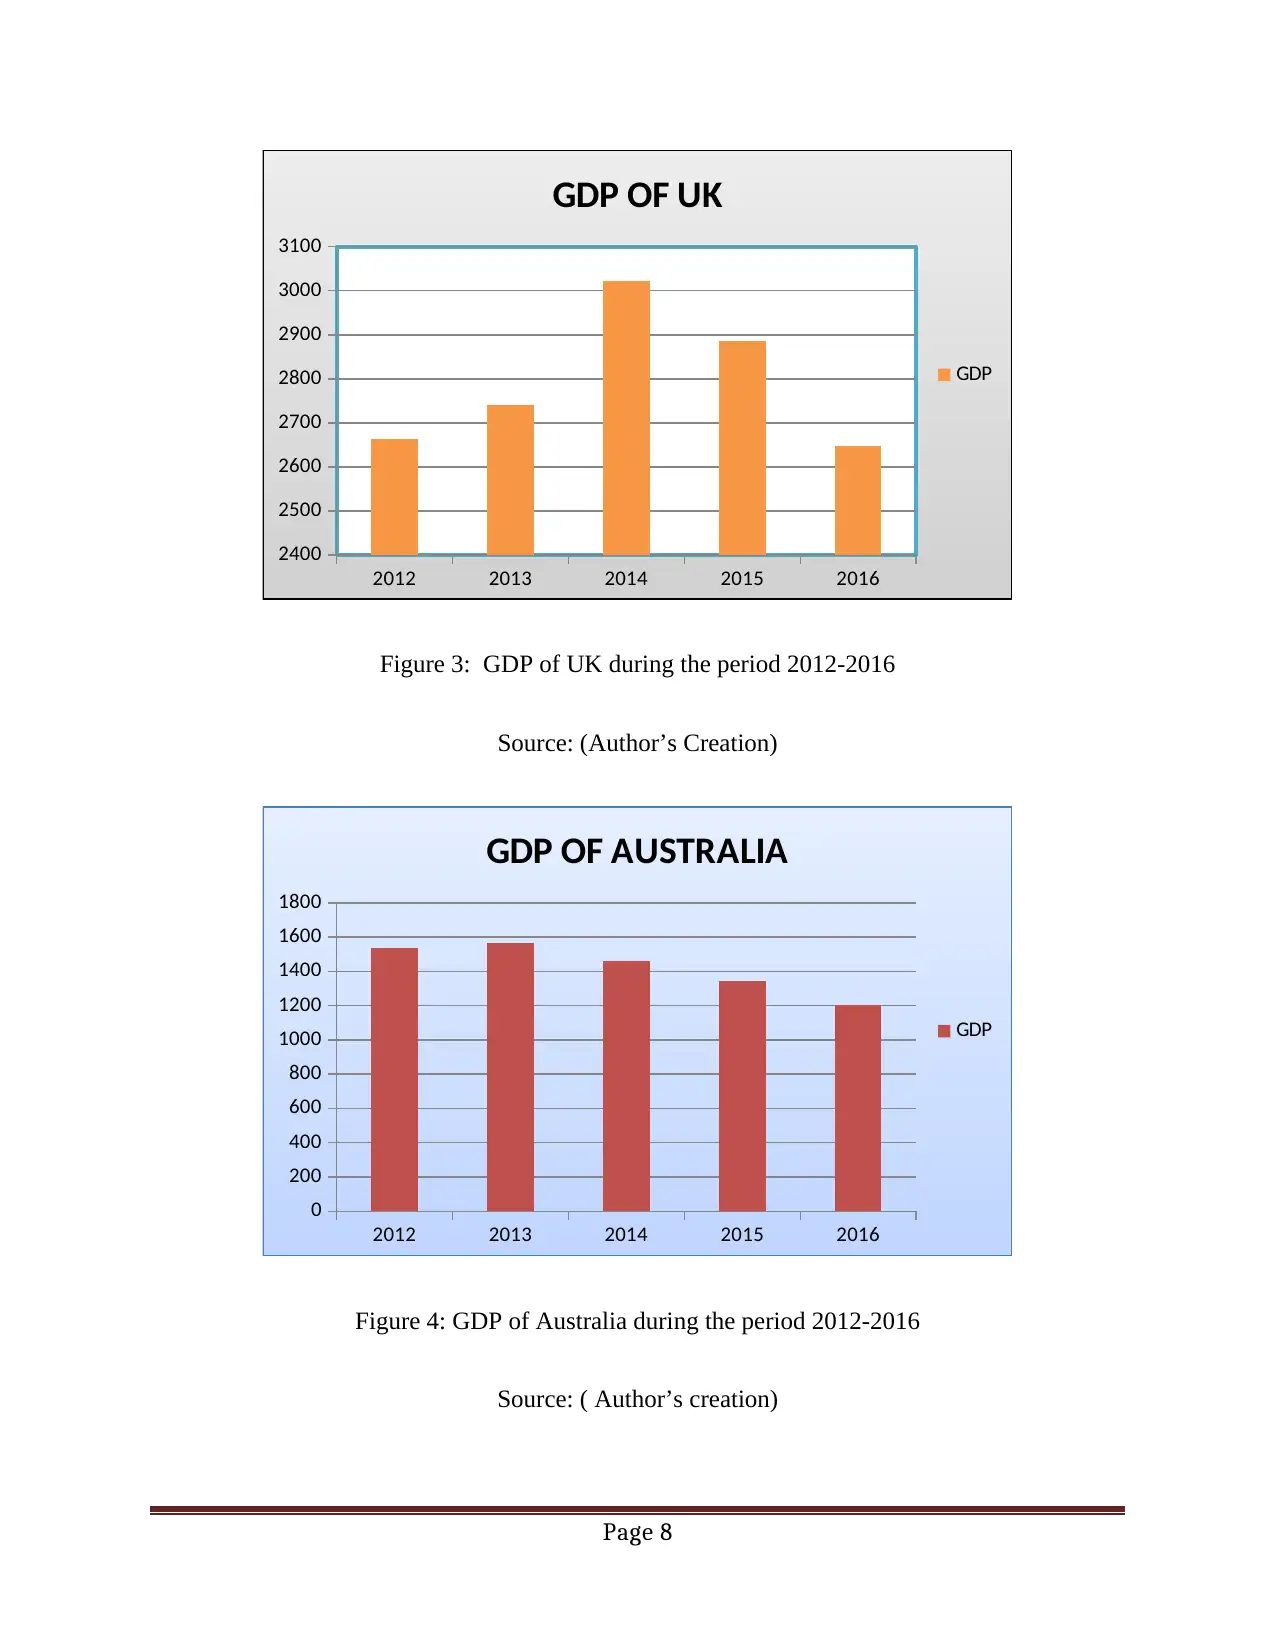
GDP of UK and Australia
The GDP of UK has been the main measurement of this nation’s economic growth
relying on the value of products and services manufactured during the specific period of time.
During this period 2012-2016, the GDP growth of UK has increased more than double from the
year 2008 and 2009 (Reisman 2013). The service industry had been the strongest contributor to
this nation’s GDP growth, contributing to around 80% of GDP. During this period, the GDP of
Australia has been more or less stable, the highest being recorded at 3022.83 USD billion in the
year 2014. The main reason behind this is that at the end of the year 2014, the GDP growth of
Page 6
Source: (Hartwell 2017)
GDP of UK and Australia
The GDP of UK has been the main measurement of this nation’s economic growth
relying on the value of products and services manufactured during the specific period of time.
During this period 2012-2016, the GDP growth of UK has increased more than double from the
year 2008 and 2009 (Reisman 2013). The service industry had been the strongest contributor to
this nation’s GDP growth, contributing to around 80% of GDP. During this period, the GDP of
Australia has been more or less stable, the highest being recorded at 3022.83 USD billion in the
year 2014. The main reason behind this is that at the end of the year 2014, the GDP growth of
Page 6
⊘ This is a preview!⊘
Do you want full access?
Subscribe today to unlock all pages.
Trusted by 1+ million students worldwide
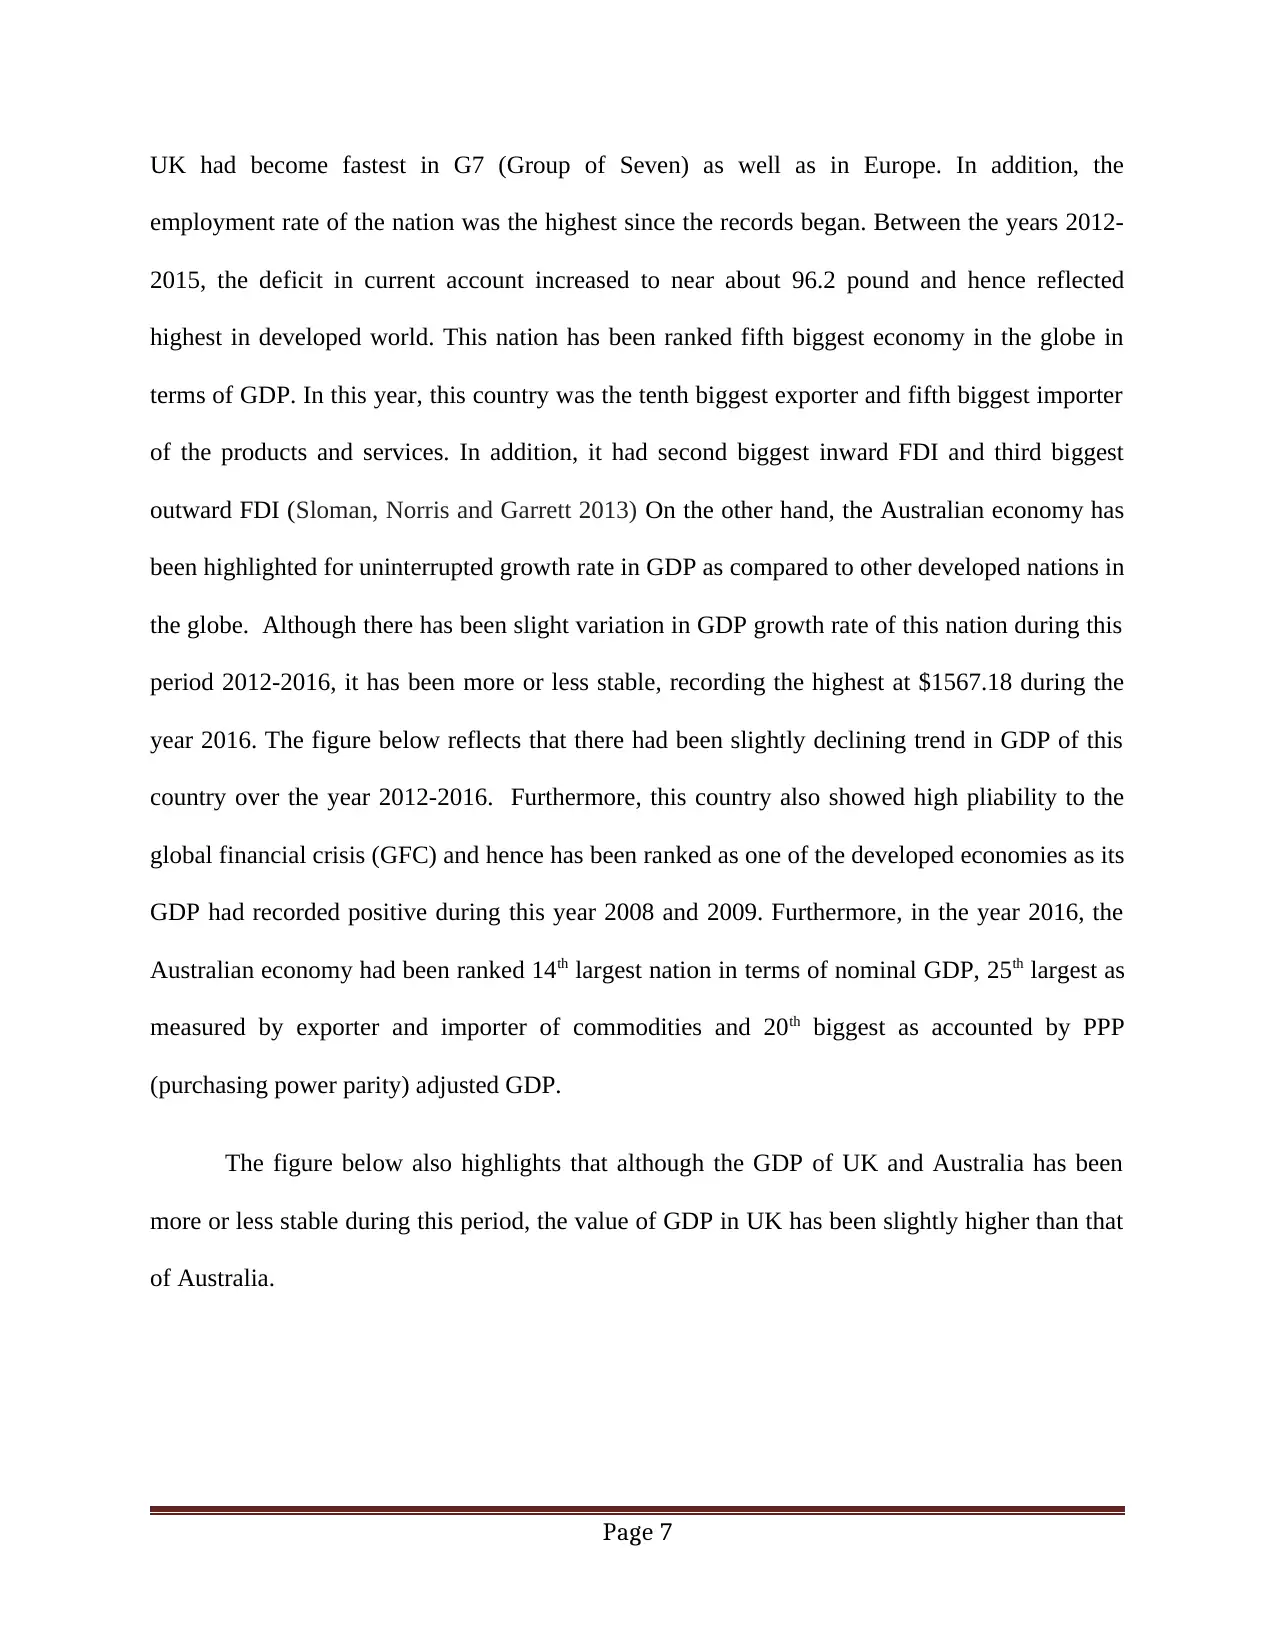
UK had become fastest in G7 (Group of Seven) as well as in Europe. In addition, the
employment rate of the nation was the highest since the records began. Between the years 2012-
2015, the deficit in current account increased to near about 96.2 pound and hence reflected
highest in developed world. This nation has been ranked fifth biggest economy in the globe in
terms of GDP. In this year, this country was the tenth biggest exporter and fifth biggest importer
of the products and services. In addition, it had second biggest inward FDI and third biggest
outward FDI (Sloman, Norris and Garrett 2013) On the other hand, the Australian economy has
been highlighted for uninterrupted growth rate in GDP as compared to other developed nations in
the globe. Although there has been slight variation in GDP growth rate of this nation during this
period 2012-2016, it has been more or less stable, recording the highest at $1567.18 during the
year 2016. The figure below reflects that there had been slightly declining trend in GDP of this
country over the year 2012-2016. Furthermore, this country also showed high pliability to the
global financial crisis (GFC) and hence has been ranked as one of the developed economies as its
GDP had recorded positive during this year 2008 and 2009. Furthermore, in the year 2016, the
Australian economy had been ranked 14th largest nation in terms of nominal GDP, 25th largest as
measured by exporter and importer of commodities and 20th biggest as accounted by PPP
(purchasing power parity) adjusted GDP.
The figure below also highlights that although the GDP of UK and Australia has been
more or less stable during this period, the value of GDP in UK has been slightly higher than that
of Australia.
Page 7
Paraphrase This Document
Need a fresh take? Get an instant paraphrase of this document with our AI Paraphraser
2012 2013 2014 2015 2016
2400
2500
2600
2700
2800
2900
3000
3100
GDP OF UK
GDP
Figure 3: GDP of UK during the period 2012-2016
Source: (Author’s Creation)
2012 2013 2014 2015 2016
0
200
400
600
800
1000
1200
1400
1600
1800
GDP OF AUSTRALIA
GDP
Figure 4: GDP of Australia during the period 2012-2016
Source: ( Author’s creation)
Page 8
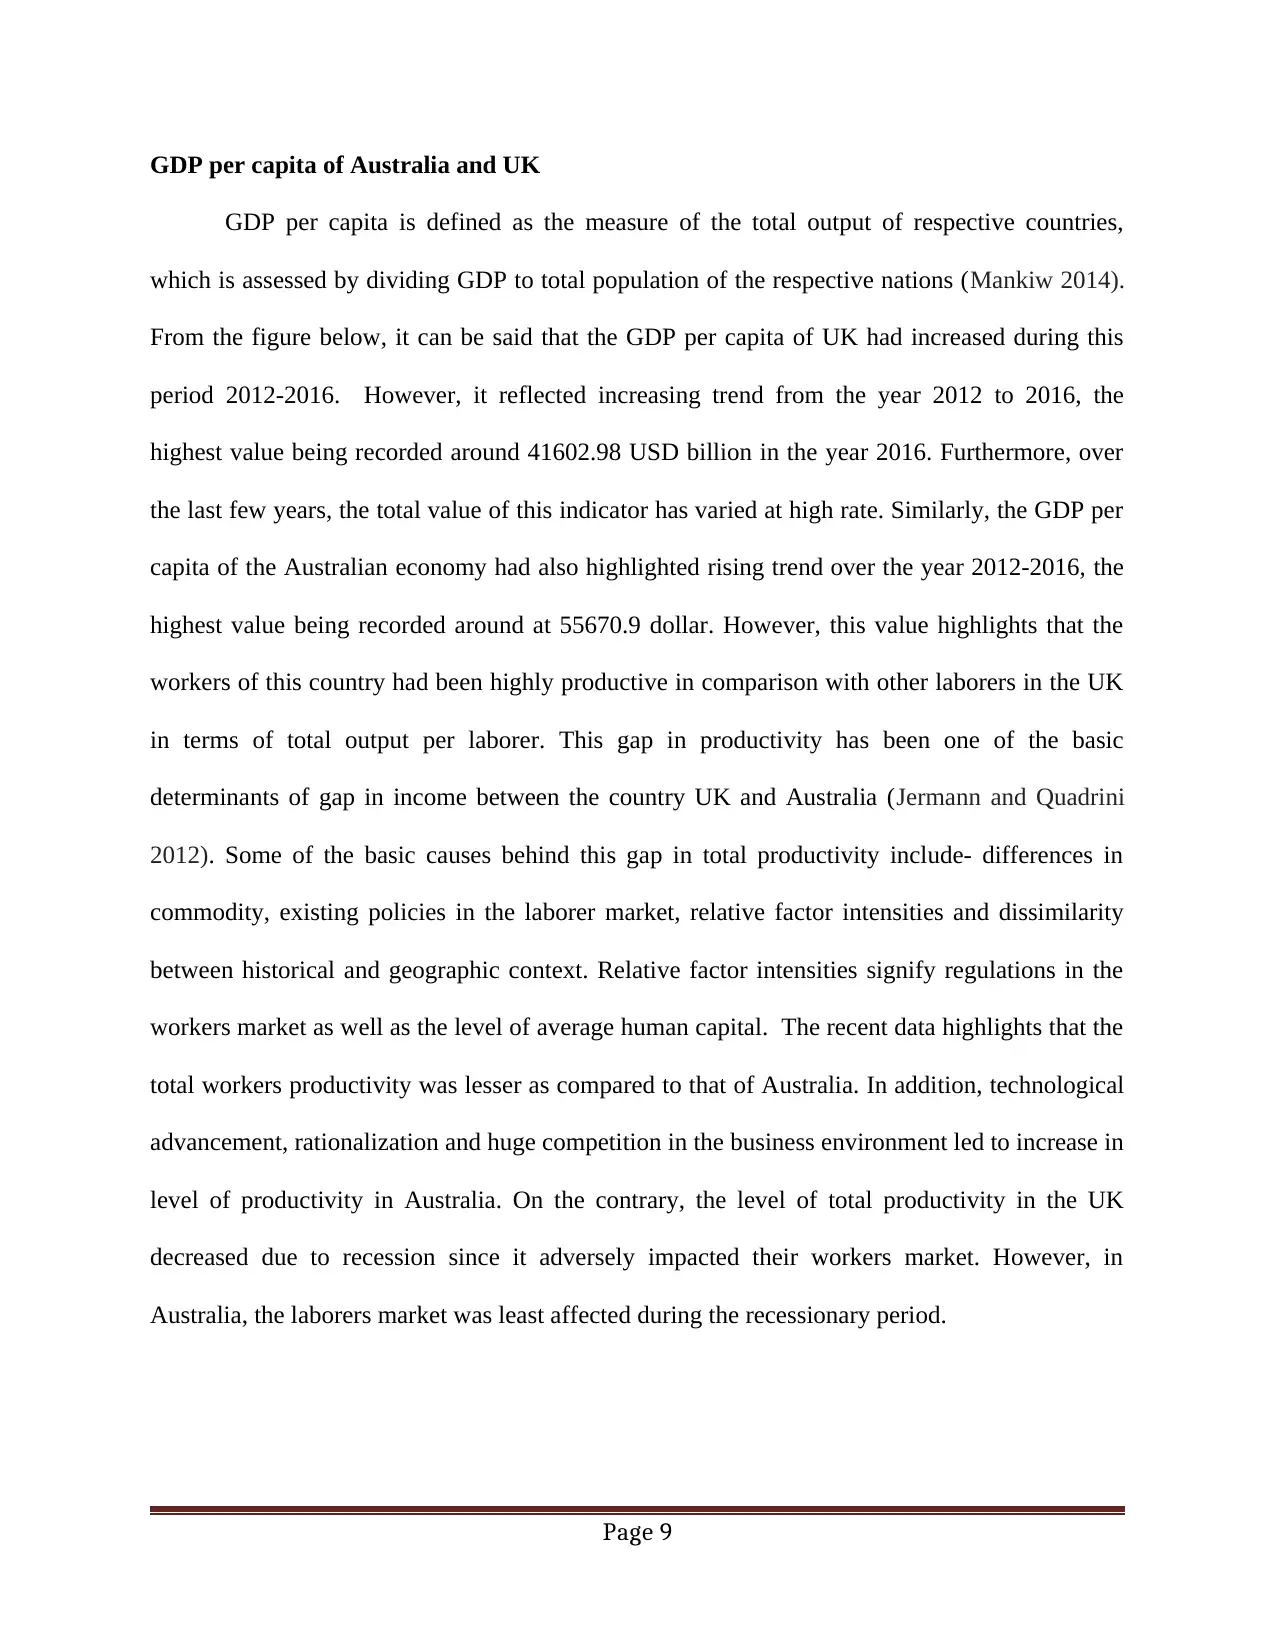
GDP per capita of Australia and UK
GDP per capita is defined as the measure of the total output of respective countries,
which is assessed by dividing GDP to total population of the respective nations (Mankiw 2014).
From the figure below, it can be said that the GDP per capita of UK had increased during this
period 2012-2016. However, it reflected increasing trend from the year 2012 to 2016, the
highest value being recorded around 41602.98 USD billion in the year 2016. Furthermore, over
the last few years, the total value of this indicator has varied at high rate. Similarly, the GDP per
capita of the Australian economy had also highlighted rising trend over the year 2012-2016, the
highest value being recorded around at 55670.9 dollar. However, this value highlights that the
workers of this country had been highly productive in comparison with other laborers in the UK
in terms of total output per laborer. This gap in productivity has been one of the basic
determinants of gap in income between the country UK and Australia (Jermann and Quadrini
2012). Some of the basic causes behind this gap in total productivity include- differences in
commodity, existing policies in the laborer market, relative factor intensities and dissimilarity
between historical and geographic context. Relative factor intensities signify regulations in the
workers market as well as the level of average human capital. The recent data highlights that the
total workers productivity was lesser as compared to that of Australia. In addition, technological
advancement, rationalization and huge competition in the business environment led to increase in
level of productivity in Australia. On the contrary, the level of total productivity in the UK
decreased due to recession since it adversely impacted their workers market. However, in
Australia, the laborers market was least affected during the recessionary period.
Page 9
⊘ This is a preview!⊘
Do you want full access?
Subscribe today to unlock all pages.
Trusted by 1+ million students worldwide
2012 2013 2014 2015 2016
38000
38500
39000
39500
40000
40500
41000
41500
42000
GDP PER CAPITA OF UK
GDP PER CAPITA
Figure 5: GDP per capita of UK during the year 2012-2016
Source: (Author’s creation)
2012 2013 2014 2015 2016
52000
52500
53000
53500
54000
54500
55000
55500
56000
GDP PER CAPITA OF AUSTRALIA
GDP PER CAPITA
Figure 6: GDP per capita of Australia over the year 2012-2016
Source: (Author’s creation)
Page 10
Paraphrase This Document
Need a fresh take? Get an instant paraphrase of this document with our AI Paraphraser
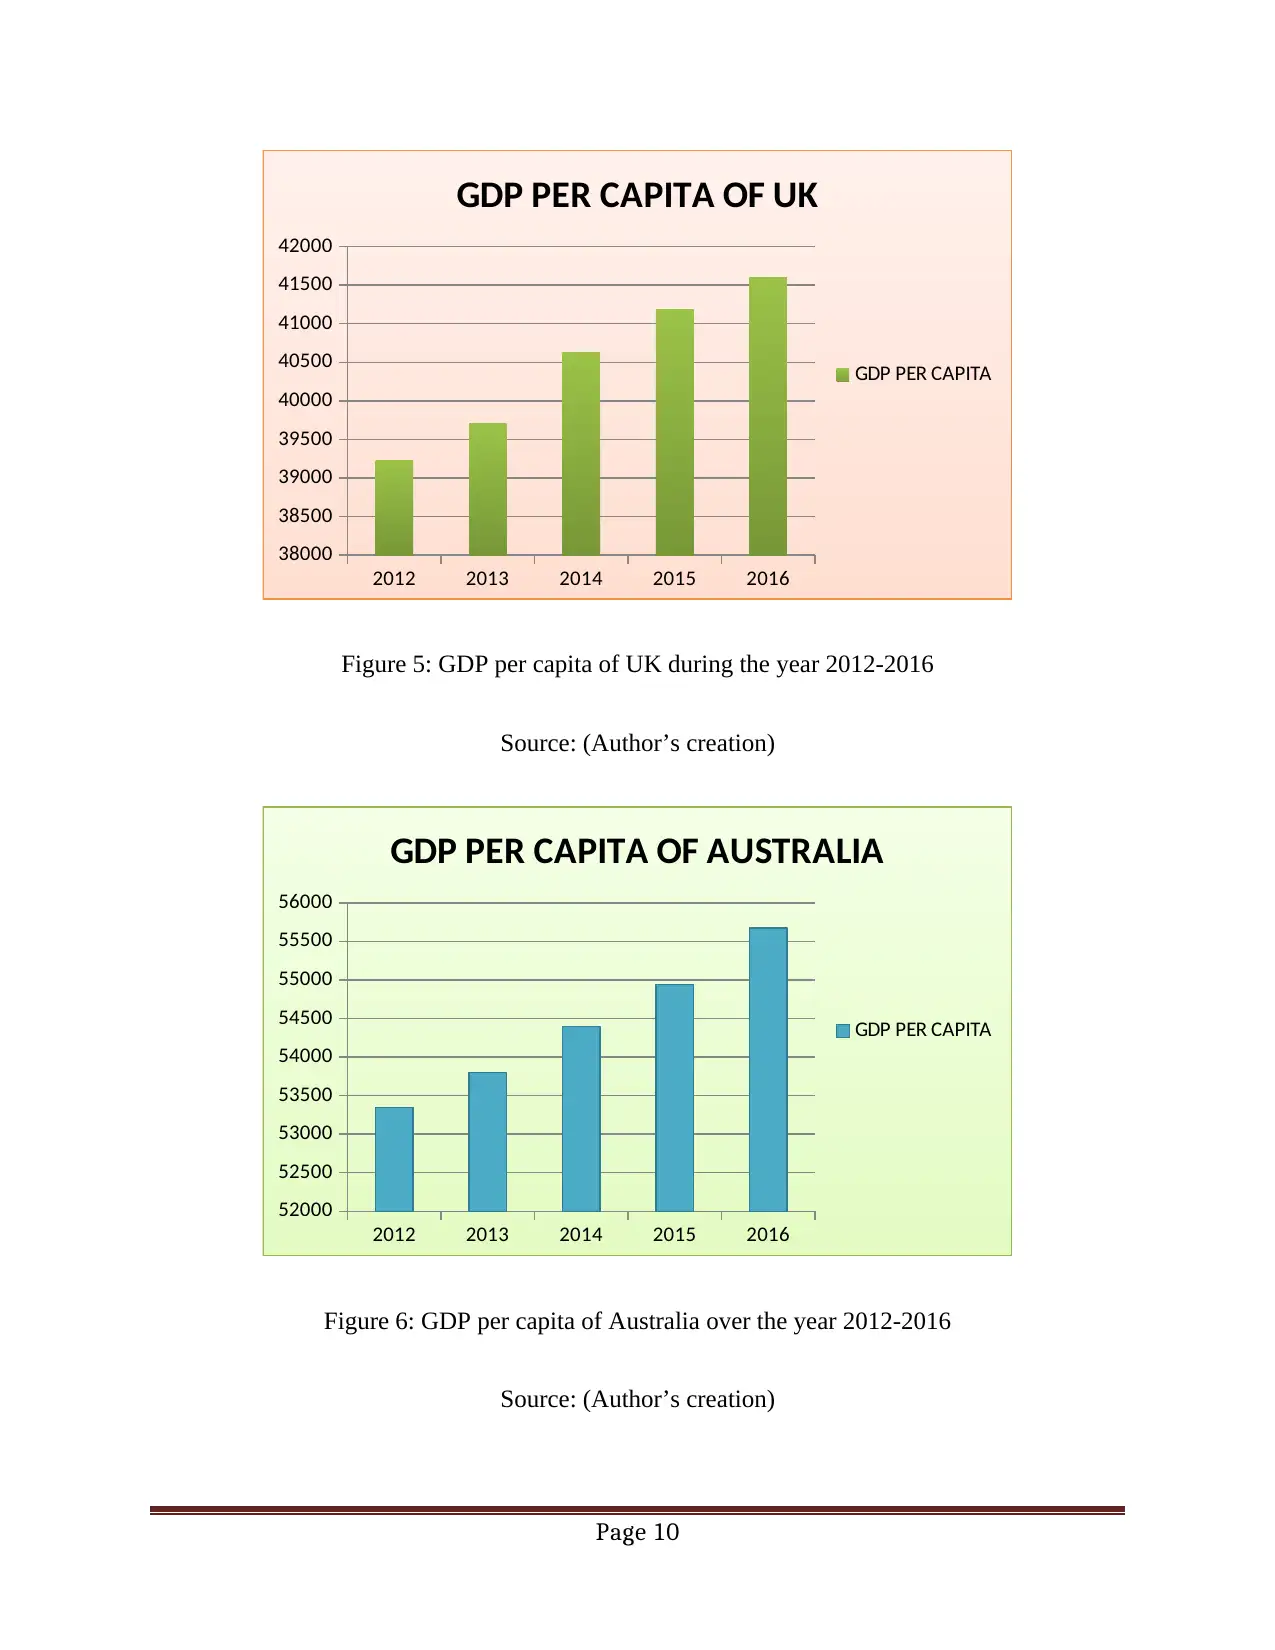
Production Possibility Frontier (PPF)
PPF denotes the maximum output potentiality of two commodities or services that a
nation can attain when its resources are efficiently employed. Increase in total output of the
nation is mainly reflected by the outward movement in PPF. This outward movement indicates
that the country has enhanced their capacity in manufacturing commodities. Since total
workforce of the country is another determinant of economic growth, increase in population
shifts this PPF curve in outward direction (Rios, McConnell and Brue 2013). The Australian
economy implemented new immigration policy for raising their workforce, which in turn makes
outward shift of PPF curve. On the other hand, the UK government invested huge amount of
money in new technologies in order to increase possible output for products and services. This is
because new technology increases efficiency of workers than old ones. As a result, the PPF curve
shifts outward and thereby highlights that economic growth of these two nations increased
during this period.
Page 11
Capital product
Consumer product
Outward shift of PPF curve
Figure 7: PPF curve of Australia and UK
Source: (Author’s Creation)
Business Cycle
Business cycle also known as trade cycle indicates variation in economic activities,
which a country experiences during a particular time period. It is generally evaluated with the
help of real GDP growth rate of the nation. There are five stages of this cycle namely- expansion,
peak, contraction, trough and recovery. During the expansion phase, economic indicators
including employment, output etc increases at high rate. When the economy attains maximum
growth limit, it indicates the peak stage (Gabisch and Lorenz 2013). This stage then leads to
recession phase, in which demand for products begins to decline steadily. The economy then
reaches trough phase, which reflects negative economic growth rate. This however leads to the
recovery stage where the economy begins to recover until it reaches steady growth. During the
Page 12
⊘ This is a preview!⊘
Do you want full access?
Subscribe today to unlock all pages.
Trusted by 1+ million students worldwide
1 out of 16
Related Documents


Your All-in-One AI-Powered Toolkit for Academic Success.
+13062052269
info@desklib.com
Available 24*7 on WhatsApp / Email
![[object Object]](/_next/static/media/star-bottom.7253800d.svg)
Unlock your academic potential
Copyright © 2020–2026 A2Z Services. All Rights Reserved. Developed and managed by ZUCOL.